Fig. 5
Download original image
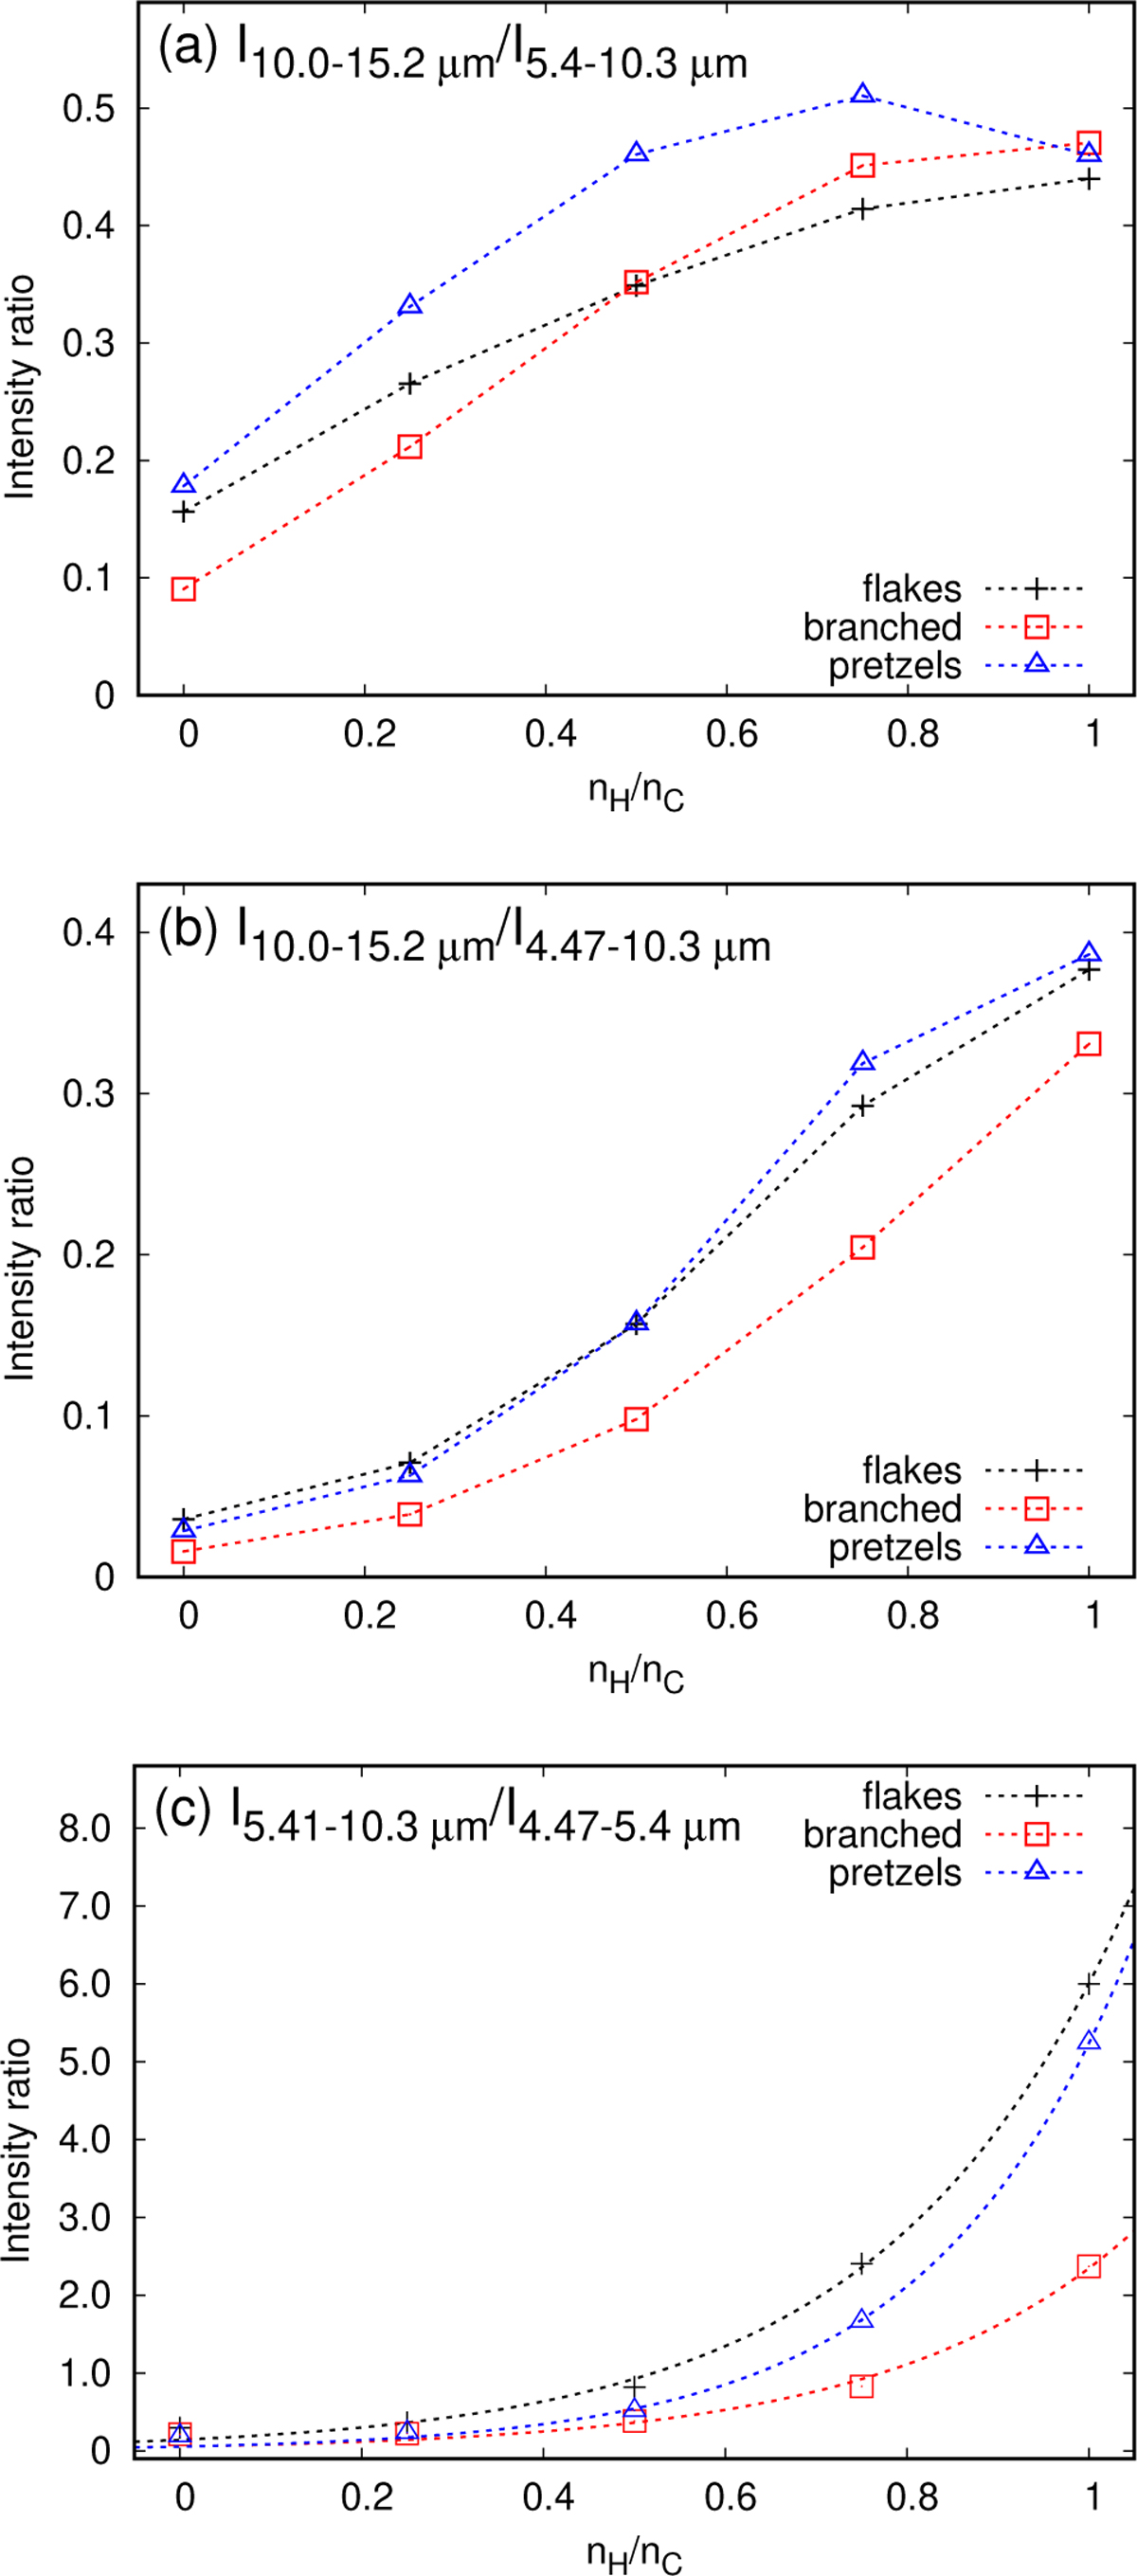
Intensity ratios I10.0–15.2 μm/I5.4–103 μm (a), I10.0–15.2 μm/I4.47–10.3 μm (b), and I5.41–10.3 μm/I4.47–5.4 μm (c) as a function of the nH/nC fraction for the flakes family (black crosses), branched family (red squares), and pretzels family (blue triangles). The dashed lines in plots (a) and (b) were drawn to guide the eye, whereas in plot (c), these lines show the exponential fitting of the data (see Appendix B for the details of the fit).
Current usage metrics show cumulative count of Article Views (full-text article views including HTML views, PDF and ePub downloads, according to the available data) and Abstracts Views on Vision4Press platform.
Data correspond to usage on the plateform after 2015. The current usage metrics is available 48-96 hours after online publication and is updated daily on week days.
Initial download of the metrics may take a while.