Fig. 2
Download original image
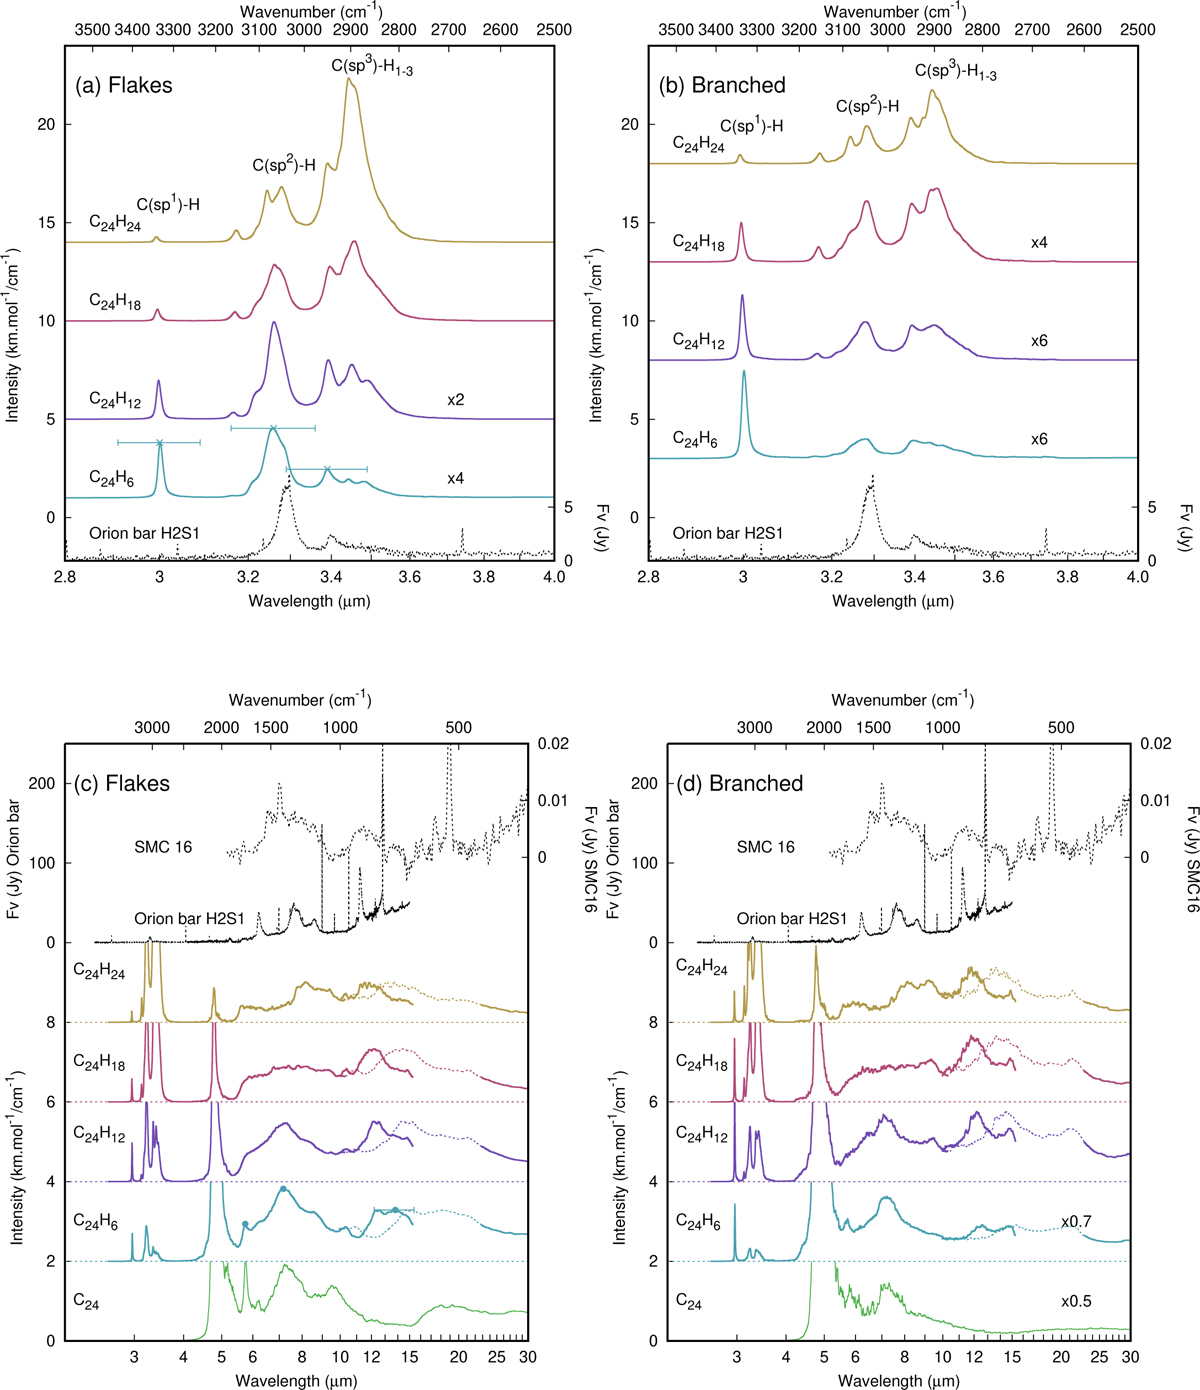
Infrared spectra for the flakes and branched families and comparison with astronomical spectra. Panels a and b show a zoom into the [2.8–4 µm] region. Panels c and d show the features represented with dashed lines in the [10.2–22.7 µm] region rescaled using the appropriate factors for C–H bend (see main text and Appendix A). The final shifted band in the [10.0–15.3 µm] domain is represented in plain lines. The emission spectra from the Orion bar H2S1(Van Diedenhoven et al. 2004) and from the SMP SMC 16 planetary nebula (García-Hernández et al. 2010) are added for comparison. Error bars are reported in panels a and c for the most intense bands of the IR spectrum of C24H6 flakes only, but can be applied to similar modes for all stoichiometries and families.
Current usage metrics show cumulative count of Article Views (full-text article views including HTML views, PDF and ePub downloads, according to the available data) and Abstracts Views on Vision4Press platform.
Data correspond to usage on the plateform after 2015. The current usage metrics is available 48-96 hours after online publication and is updated daily on week days.
Initial download of the metrics may take a while.