Fig. B.1
Download original image
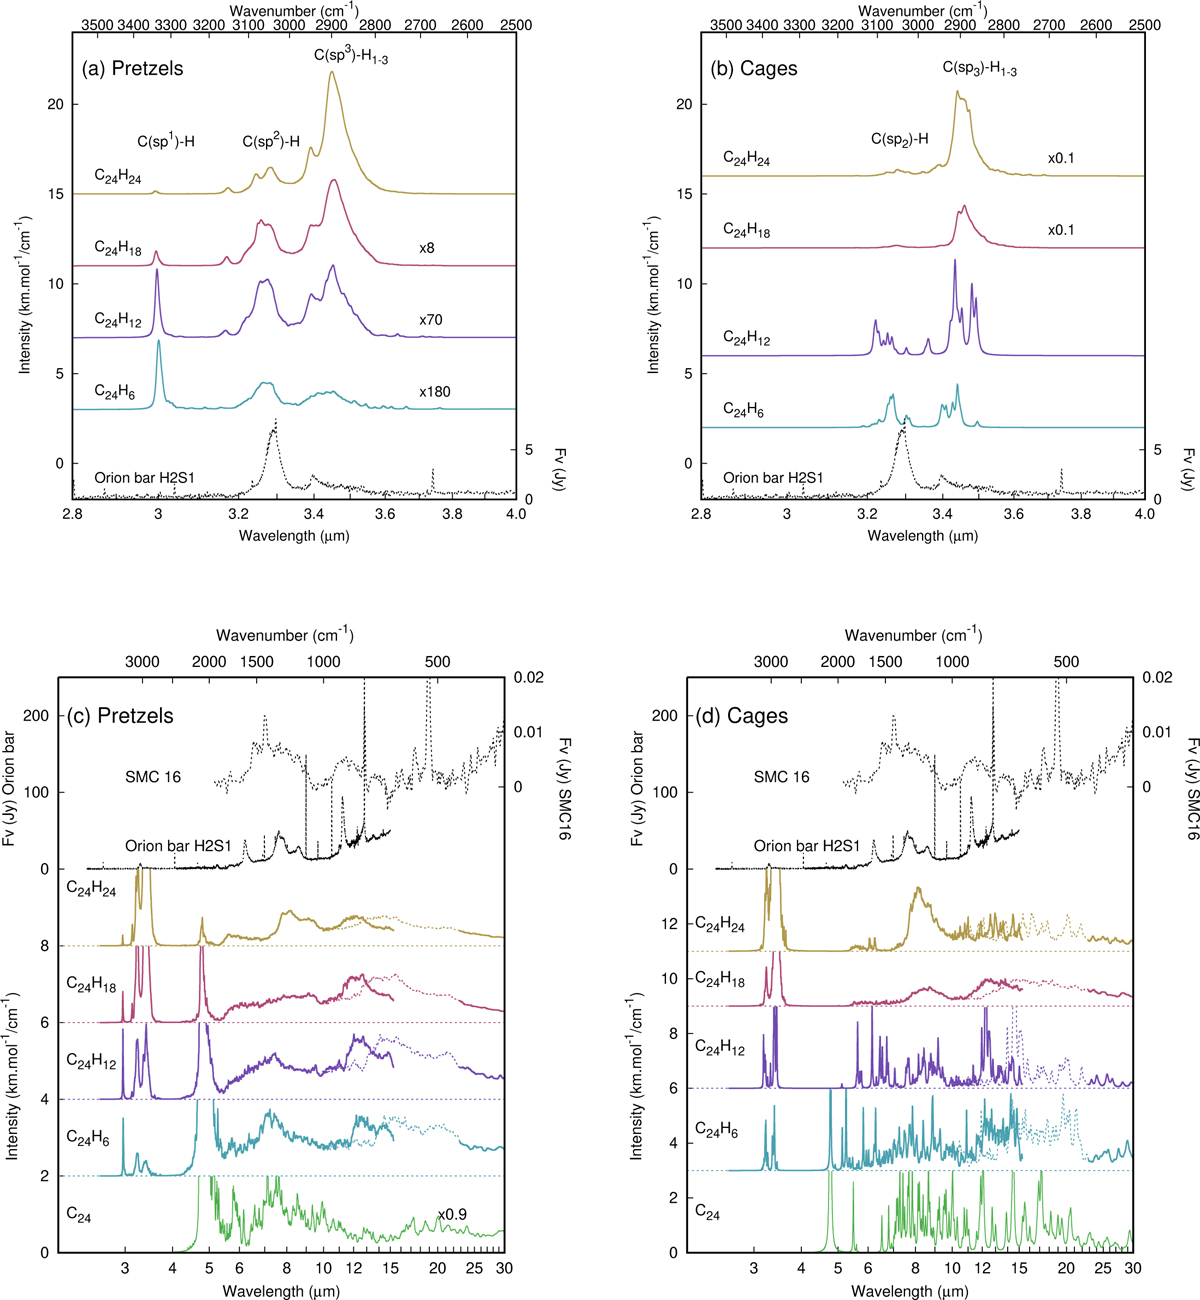
Infrared spectra for the pretzels and cages families. (a), (b) Zoom into the [2.8 - 4 µm] region. The intensities were multiplied by 4 for C24H6 and by 2 for C24H12 to make the structures of the bands visible. (c), (d) The features represented with dashed lines in the [10.2 - 22.7 µm] region were rescaled using the appropriate factors for C-H bend (see main text and Appendix A). The final shifted band in the [10.0 - 15.3 µm] domain is represented in plain lines. The emission spectra from the Orion bar H2S1(Van Diedenhoven et al. 2004) and from the SMP SMC 16 planetary nebula (García-Hernández et al. 2010) are added for comparison.
Current usage metrics show cumulative count of Article Views (full-text article views including HTML views, PDF and ePub downloads, according to the available data) and Abstracts Views on Vision4Press platform.
Data correspond to usage on the plateform after 2015. The current usage metrics is available 48-96 hours after online publication and is updated daily on week days.
Initial download of the metrics may take a while.