| Issue |
A&A
Volume 669, January 2023
|
|
|---|---|---|
| Article Number | L4 | |
| Number of page(s) | 8 | |
| Section | Letters to the Editor | |
| DOI | https://doi.org/10.1051/0004-6361/202245392 | |
| Published online | 10 January 2023 | |
Letter to the Editor
The pristine nature of SMSS 1605−1443 revealed by ESPRESSO⋆
1
Dipartimento di Fisica e Astronomia, Universit á degli Studi di Firenze, Via G. Sansone 1, 50019 Sesto Fiorentino, Italy
2
INAF-Osservatorio Astrofisico di Arcetri, Largo E. Fermi 5, 50125 Firenze, Italy
3
Instituto de Astrofísica de Canarias, Vía Láctea, 38205 La Laguna, Tenerife, Spain
e-mail: This email address is being protected from spambots. You need JavaScript enabled to view it.
4
GEPI, Observatoire de Paris, Université PSL, CNRS, 5 Place Jules Janssen, 92190 Meudon, France
5
INAF-Osservatorio Astronomico di Trieste, Via G.B. Tiepolo 11, 34143 Trieste, Italy
6
Institute of Fundamental Physics of the Universe, Via Beirut 2, Miramare, Trieste, Italy
7
Universidad de La Laguna, Departamento de Astrofísica, 38206 La Laguna, Tenerife, Spain
8
Consejo Superior de Investigaciones Científicas, 28006 Madrid, Spain
9
Centro de Astrobiología (CSIC-INTA), Carretera Ajalvir km 4, 28850 Torrejón de Ardoz, Madrid, Spain
10
Dŕpartement d’astronomie de l’Université de Genève, Chemin Pegasi 51, 1290 Versoix, Switzerland
11
Instituto de Astrofísica e Ciências do Espaço, CAUP, Universidade do Porto, Rua das Estrelas, 4150-762 Porto, Portugal
12
Departamento de Física e Astronomia, Faculdade de Cióncias, Universidade do Porto, Rua Campo Alegre, 4169-007 Porto, Portugal
13
Scuola Normale Superiore, P.zza dei Cavalieri, 7, 56126 Pisa, Italy
14
Instituto de Astrofísica e Cióncias do Espaço, Faculdade de Cincias da Universidade de Lisboa, Campo Grande, 1749-016 Lisboa, Portugal
15
Centro de Astrofísica da Universidade do Porto, Rua das Estrelas, 4150-762 Porto, Portugal
16
INFN, Sezione di Trieste, Via Valerio 2, 34127 Trieste, Italy
17
INAF – Osservatorio Astrofisico di Torino, Via Osservatorio 20, 10025 Pino Torinese, Italy
Received:
7
November
2022
Accepted:
22
November
2022
Abstract
Context. SMSS J160540.18−144323.1 is the carbon-enhanced metal-poor (CEMP) star with the lowest iron abundance ever measured, [Fe/H] = −6.2, which was first reported with the SkyMapper telescope. The carbon abundance is A(C)≈6.1 in the low-C band, as the majority of the stars in this metallicity range. Yet, constraining the isotopic ratio of key species, such as carbon, sheds light on the properties and origin of these elusive stars.
Aims. We performed high-resolution observations of SMSS 1605−1443 with the ESPRESSO spectrograph to look for variations in the radial velocity (vrad) with time. These data have been combined with older MIKE and UVES archival observations to enlarge the temporal baseline. The 12C/13C isotopic ratio is also studied to explore the possibility of mass transfer from a binary companion.
Methods. A cross-correlation function against a natural template was applied to detect vrad variability and a spectral synthesis technique was used to derive 12C/13C in the stellar atmosphere.
Results. We confirm previous indications of binarity in SMSS 1605−1443 and measured a lower limit 12C/13C > 60 at more than a 3σ confidence level, proving that this system is chemically unmixed and that no mass transfer from the unseen companion has happened so far. Thus, we confirm the CEMP-no nature of SMSS 1605−1443 and show that the pristine chemical composition of the cloud from which it formed is currently imprinted in its stellar atmosphere free of contamination.
Key words: stars: abundances / stars: Population II / stars: Population III / Galaxy: abundances / Galaxy: formation / Galaxy: halo
Based on ESPRESSO GTO collected under ESO programmes 1104.C-0350, 108.2268.001, PI: P. Molaro. Based also on UVES data retrieved from the ESO archive under programme 105.20K7.001.
© The Authors 2023
 Open Access article, published by EDP Sciences, under the terms of the Creative Commons Attribution License (https://creativecommons.org/licenses/by/4.0), which permits unrestricted use, distribution, and reproduction in any medium, provided the original work is properly cited.
This article is published in open access under the Subscribe-to-Open model. This email address is being protected from spambots. You need JavaScript enabled to view it. to support open access publication.
1. Introduction
Ultra, hyper, and mega metal-poor stars (corresponding to [Fe/H] < −4, [Fe/H] < −5, and [Fe/H] < −6, respectively) are messengers from the early Universe. They provide crucial clues as to the yields of the first stars, their initial mass function, and the first stages of their chemical enrichment. At the lowest iron abundances, we can find three groups: (a) stars with no carbon enhancement (carbon-normal, see e.g., Caffau et al. 2011; Starkenburg et al. 2018); (b) stars enriched in carbon, [C/Fe] > +1, and also enhanced in neutron-capture process elements [Eu/Fe] > +0.7 and/or [Ba/Fe] > +1, CEMP-r, and/or -s (see e.g. Hansen et al. 2015b, 2016; Holmbeck et al. 2020); and (c) stars enriched in carbon [C/Fe] > +1, but not in r- or s-process elements, the so-called CEMP-no group (see e.g., Spite et al. 2013; Yong et al. 2013; Yoon et al. 2016). The first group, the carbon-normal metal-poor stars, is less populated towards lower metallicities (see e.g., Cohen et al. 2005; Carollo et al. 2012; Placco et al. 2014) with important consequences on the likelihood of low-mass star-formation at earlier times (see e.g., Bromm & Loeb 2003). The second group is made up of CEMP-s and CEMP-r/s (also known as CEMP-i), and they are likely binary systems where carbon and the heavy elements were produced by a more massive stellar companion and subsequently donated to the star (Herwig 2005; Jones et al. 2016). This group is also characterised by absolute carbon abundances reaching values as high as the solar abundance (A(C)∼8.4) (Spite et al. 2013; Bonifacio et al. 2015; Yoon et al. 2016). Finally, the CEMP-no group stars show lower carbon abundances (A(C)∼6.4), with no evidence of over-abundances of neutron capture elements. They dominate the population at lower metallicities. When looked for, they were shown to be single and therefore it is not expected that this group is populated by binary systems that undergo mass transfer following the production of neutron capture elements (Ryan et al. 2005; Lucatello et al. 2005; Carollo et al. 2008; Zepeda et al. 2022).
One remarkable exception is the well-known CEMP-no star HE 0107−5240 with [Fe/H] = −5.4, which was discovered by Christlieb et al. (2001) and thought to be a single system for 20 years. However, after an exhaustive follow-up (Arentsen et al. 2019; Bonifacio et al. 2020; Aguado et al. 2022), the binary nature of HE 0107−5240 was revealed. Aguado et al. (2022) showed that the isotopic ratio 12C/13C is high, indicating that HE 0107−5240 did not undergo mass transfer. According to the classification of Beers & Christlieb (2005), SMSS 1605−1443 is a mega iron-poor star with [Fe/H] = −6.2 ± 0.2 and a carbon enrichment at [C/Fe] = +3.9 ± 0.2, as first reported by Nordlander et al. (2019). At the time of writing, the available upper limits ([Sr/Fe] < +0.2 and [Ba/Fe] < +1.0) suggest this is a CEMP-no star. However, the ultimate nature of this star has been questioned by Aguado et al. (2022), who found a significant vrad variation in the observations from Echelle Spectrograph for Rocky Exoplanets and Stable Spectroscopic Observations (ESPRESSO). Therefore, confirmation of the binarity of SMSS 1605−1443 is required and further chemical analysis is necessary to address the question of whether the chemical composition of SMSS 1605−1443 is indeed pristine. In this work, we integrate the kinematical analysis with archival UVES spectra and derive an informative lower limit of 12C/13C. The relevance of these findings for understanding binarity among the most iron-poor stars known to date is discussed.
2. Observations and data reduction
To study and characterise SMSS 1605−1443, we worked with three different sources of spectroscopic data: (a) intermediate spectral resolution (R ≈ 28 000) observations with the Magellan Inamori Kyocera Echelle (MIKE) spectrograph at the Magellan telescope published by Nordlander et al. (2019); (b) higher resolution (R ≈ 41 000) follow-up with the Ultraviolet Visual Echelle Spectrograph (UVES; Dekker et al. 2000) on the 8.2 m Kueyen Very Large Telescope (VLT) publicly available from the European Southern Observatory (ESO) archive1; and (c) an ESO Guaranteed Time Observations (GTO) programme with the ultra-stable ESPRESSO spectrograph (R ≈ 138 000) at VLT (Pepe et al. 2021). The MIKE data are not publicly available, and therefore we refer to the original paper by Nordlander et al. (2019) and quote the results of the single observing night of September 1, 2018, summarised in Table A.1.
Five additional UVES observations of SMSS 1605−1443 taken between February 21, 2021 and September 6, 2021 are freely available. A  slit was used with 2 × 2 binning in dark sky conditions and a maximum airmass of ∼1.4. The setting used was dichroic, #2, with central wavelengths at 437 nm for the blue arm and +760 for the red arm, providing a spectral coverage between 380 and 946 nm. We corrected each spectrum for the barycentric velocity. The average signal-to-noise per pixel in the spectra was ∼27 at 430 nm and the seeing average of the five nights was
  (see Table A.1 for further details). The data were reduced using the REFLEX environment (Freudling et al. 2013) within the ESO Common Pipeline Library.
The ESPRESSO observations were taken in the Single42 mode. ESPRESSO has two fibres, one for the object and one for the sky, with a diameter of 140 μm that corresponds to a 1 0 aperture in the sky. The binning of the CCD was 4 × 2 pixel and we selected the slow readout mode. The five spectra were taken in service mode with an individual exposure time of 3150 s, leading to data with S/N between 11 and 13 at 430 nm. The observing criteria were: seeing
  , airmass ≤ 1.5, water vapour ≤ 30 mm, and a minimum lunar distance of 30°. The first observation (see Table A.1) was taken with higher seeing so that the exposure was repeated. Data reduction was performed by using the automatic ESPRESSO pipeline, including sky subtraction, bias, and flat-fielding correction. The wavelength calibration combines a ThAr lamp with a Fabry-Pérot etalon (Pepe et al. 2013). In Sect. A we show the combined ESPRESSO spectrum.
3. Analysis
3.1. Stellar parameters and radial velocity
Nordlander et al. (2019) found good agreement between stellar parameters (effective temperature and surface gravity), which were derived both photometrically and spectroscopically, converging into Teff = 4850 ± 100 K and log g = 2.0 ± 0.2. Based on the Gaia colours (Gaia Collaboration 2021) and applying the calibration by Mucciarelli et al. (2021), we derived Teff = 4830 ± 100 K. Additionally, based on the Gaia parallax (with a zero point), we found log g = 1.8 ± 0.2. Both parameters are in excellent agreement with the original ones; therefore, we assumed those from Nordlander et al. (2019). We marginally detected the strong iron line at 404.5 nm, in contrast with the ten Fe I lines detected in the blue region of the MIKE spectrum. This is not surprising since ESPRESSO is less efficient in the blue, where the strongest Fe I are. Therefore, we also adopted the metallicity from Nordlander et al. (2019), [Fe/H] = −6.2.
To derive radial velocities from UVES and ESPRESSO, we followed the same iterative process explained in Aguado et al. (2022). We used a template based on the same set of stellar parameters and performed a cross-correlation function (CCF) against each individual exposure in the range 420−431 nm. The CCF was done in Fourier space using the algorithm from Tonry & Davis (1979) implemented in the fxcor package within IRAF (Tody 1993). Then, by correcting all the spectra and by combining them, we created a natural template in the rest of the frame for both instruments. Finally, we cross-correlated these templates with all individual spectra and derived final vrad measurements. This step allowed us to significantly reduce the derived uncertainties that are summarised in Table A.1. While with UVES we get uncertainties of a few hundred of metres per second, with the ESPRESSO data these are an order of magnitude lower (tens of metres per second). On the other hand, as previously explained, the vrad measurement from MIKE data is directly taken from Nordlander et al. (2019; see our Table A.1). Although no error bar is provided, from our experience with MIKE with giant metal-poor stars, we estimate it as 1 km s−1. Finally, we have searched the literature for further vrad measurements associated with this object. Unfortunately, SMSS 1605−1443 is not bright enough to be observed with the Radial Velocity Spectrometer (RVS, Cropper et al. 2018) within the Gaia mission, and no data were found. We also checked the Survey of Surveys (SoS, Tsantaki et al. 2022) including vrad measurements from different spectroscopic surveys, and no measurements were available.
3.2. Carbon isotopic ratio 12C/13C
Metallic absorptions in the ESPRESSO spectra are almost exclusively due to carbon (CH) features. The extremely low metallicity of this star and the very high carbon enrichment account for this fact. However, the resolution and the relatively high quality of the ESPRESSO spectrum allowed us to derive the absolute carbon abundance A(C) and set a critical lower limit on the carbon isotopic ratio 12C/13C. By assuming stellar parameters (Teff, log g, and [Fe/H]) discussed in Sect. 3, microturbulence of 1.8 km s−1, and a [α/Fe] = +0.4, we computed a stellar model with the ATLAS 9 model atmosphere code using an opacity distribution function of metallicity −5.52. Using this model atmosphere, we computed a grid of synthetic spectra using the with SYNTHE code (Kurucz 2005; Sbordone 2005). To derive the absolute carbon abundance, we fitted the ESPRESSO spectrum with the collection of synthetic spectra in the G band, between 420 and 427 nm, by minimisation of the χ2. The best fit provides A(C)=5.97 ± 0.10. If we assume a solar carbon abundance A(C)⊙ = 8.43 from Asplund et al. (2009), we end up with [C/Fe] = +3.75 ± 0.20, which is in good agreement with the value originally reported of [C/Fe] = +3.9 ± 0.2. Nordlander et al. (2019) refrained from giving a lower limit for the isotopic ratio 12C/13C due to the resolution of the MIKE spectrum. However, with the ESPRESSO data, we are able to give an informative value to 12C/13C. In Fig. 1 we show the spectral region within the G band where some of the most prominent 13C features are located. However, to optimise the calculation of a lower limit, we decided not use individual lines but the entire information on 13C present in the range 415−435 nm with a Markov chain Monte Carlo (MCMC) self-adaptative algorithm (Vrug et al. 2009) available within the FERRE code (Allende Prieto et al. 2006). We conclude that 12C/13C > 60 is a robust lower limit with a statistical significance larger than 3σ. Other values (12C/13C = 3 or 30) with higher 13C abundance have been ruled out (red and purple lines, respectively). The complete MCMC methodology already tested by Aguado et al. (2019) is detailed in Appendix B.
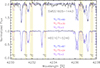 |
Fig. 1. Narrow region of the ESPRESSO combined spectrum of SMSS 1605−1443 and HE 0107−5240 around the G band. Three different synthetic models computed with SYNTHE are also shown. |
4. Discussion and conclusion
4.1. The vrad variability of SMSS 1605−1443
The re-normalised unit weight error (RUWE) published by Gaia EDR3 (Gaia Collaboration 2021) is 1.06 and does not allow us to conclude about binarity whatsoever. This is not surprising since the star is at a distance of ∼8.9 kpc (Bailer-Jones et al. 2018), which is far from the sensitivity range of Gaia parallaxes. However, an indication of radial velocity variability was reported by Aguado et al. (2022) based on the same five ESPRESSO observations. Thanks to the ultra stability of this spectrograph, we can see the decreasing trend shown in Fig. 2 (red points) and this would be sufficient to claim a vrad variation. However, a longer time range would be highly desirable to confirm this hypothesis and to have clues as to the period. Luckily, the early MIKE data (green point in Fig. 2) and the subsequent UVES observations (blue points) all together span five years of radial velocity data. The error bars corresponding to different instruments are significantly different. MIKE’s are about ten times larger than UVES’s, and UVES’s are ten times larger than ESPRESSO’s. However, all of them are compatible with the same decreasing trend represented by the pink dashed line in Fig. 2. In other words, comparing the slopes of the vrad variation that we see when we consider only the ESPRESSO points (∼1.8 ± 0.4 m s−1 d−1) is compatible within the errors with the one calculated considering the measurements from the three instruments (∼1.4 ± 0.2 m s−1 d−1). Therefore, the additional data we provide in this analysis confirm the previous claim by Aguado et al. (2022), and SMSS 1605−1443 unambiguously shows a decreasing pattern in vrad. The underlying assumption of linear variation is, in general, not realistic, and it accounts for the small difference between the two calculated ratios.
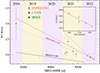 |
Fig. 2. Radial velocity points of SMSS 1605−1443 vs. modified Julian date (MJD), obtained with MIKE, UVES, and ESPRESSO. Grey and purple lines are a linear fit considering all instruments and ESPRESSO alone, respectively. The observed trend in HE 0107−5240 with ESPRESSO is also shown (black line, which has been vertically shifted to improve visibility). |
The time baseline covered by the vrad observations is too short for a reliable Keplerian analysis of the SMSS 1604−1443 system. We ran a preliminary set of orbital fit simulations on the joined radial velocity data (including MIKE, UVES, and ESPRESSO) within a Bayesian scheme with wide priors for all binary parameters, including the orbital period, semi-amplitude velocity, and eccentricity. The result points to long orbital periods above 8 yr, as well as low eccentricity and semi-amplitude velocity. New ESPRESSO observations are required during the next years to better constrain the orbital period and other binary parameters.
4.2. The pristine nature of SMSS 1605−1443
In their discovery paper, Nordlander et al. (2019) provided informative upper limits for n-capture elements, [Sr/Fe] < +0.2 and [Ba/Fe] < +1.0, suggesting this star belongs to the CEMP-no group. However, being a binary system, some mass transfer from a companion could have happened. If this were the case, the chemical composition of SMSS 1605−1443 would not reflect that of the natal cloud from which it was formed. The carbon isotopic ratio 12C/13C is frequently employed as an asymptotic giant branch (AGB) donation tracer since large amounts of the originally produced 12C are converted into 13C thanks to the CN cycle (Wannier 1980) during the red giant branch (RGB; Weiss et al. 2000). Consequently, the isotopic ratio in evolved stars rapidly decreases to low values, typically 12C/13C ∼ 3 − 4. Therefore, if SMSS 1605−1443 underwent mass transfer from a former giant companion, we should see low values of 12C/13C within its stellar atmosphere. However, as shown in Sect. 3, the obtained lower limit, 12C/13C > 60, is much higher than the equilibrium relation mentioned.
Old, metal-poor stars with no significant contribution from CN-processed material are considered chemical unmixed (Spite et al. 2005). Therefore, SMSS 1605−1443, with an amount of iron 1.5 million times lower than the Sun, is a real second-generation star exclusively polluted by previous SN events, though living with an unseeing companion. In Fig. 3 we show the existing metal-poor stars with 12C/13C measurements or lower limits (Kipper & Jorgensen 1994; Pilachowski et al. 1997; Hill et al. 2002; Frebel et al. 2006; Sivarani et al. 2006; Behara et al. 2010; Masseron et al. 2012; Placco et al. 2015; Hansen et al. 2016; Spite et al. 2021; Aguado et al. 2022). The number of points is still small due to the difficulty of measuring 12C/13C, but the data suggest that a more metal-poor unmixed star tends to form more in binary systems than other stars born in relatively more metal-rich regimes (Badenes et al. 2018; Arentsen et al. 2019).
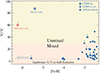 |
Fig. 3. 12C/13C−[Fe/H] plane for SMSS 1605−1443 (red symbols) and other stars from the literature (blue symbols). According to Spite et al. (2006), the 12C/13C = 30 value is also shown. |
It is rather difficult to place constraints on the binary mass function of the binary system f(M) due to the relatively short time range of available vrad measurements. However, we can discuss possible scenarios. There are several mechanisms of mass transfer in binaries depending on the relative distance scales of the system. Regardless of whether the binary separation (Db) is slightly larger than the dust formation radius (Rdust), the accretion is in the form of wind Roche lobe overflow. However, if Db < Rdust, Roche lobe overflow may happen. Finally, if Db ≫ Rdust, the accretion on to the secondary is a driven Bondi–Hoyle mechanism (see e.g., Frank et al. 2002; Chen et al. 2017). Therefore, even in wide binaries with Db of the order of tens of AU, stars could eventually receive mass from an AGB companion. Since such a possibility is discarded on the basis of its chemical composition, we conclude that the unseen component of the SMSS 1605−1443 system has never reached the giant phase. Our favoured explanation is that the unseen companion is a low-mass star that has not left the main sequence yet. We estimate that the mass of such a companion could not have exceeded 0.8 M⊙; otherwise, the companion would have plenty of time to start the H-shell burning phase and quickly rise up to the giant branch. We find clear similarities between SMSS 1605−1443 and HE 0107−5240, another binary system likely composed of two low-mass stars. Unfortunately, due to the faint magnitude of SMSS 1605−1443 (GGaia = 15.4), no spectral distribution of energy could be analysed since no GALEX ultraviolet data (Martin et al. 2005) are available for this star. Therefore, confirmation of the precise nature of its companion could not be obtained. More observations with ultra-stable ESPRESSO spectroscopy are required in a longer time interval to determine an orbit for the system.
4.3. The binary fraction in CEMP-no stars
Different origins have been proposed to explain the high carbon enrichment in extremely metal-poor stars. In particular, for CEMP-no stars, it was widely believed that the majority of them are not part of binary systems (Ryan et al. 2005; Starkenburg et al. 2014; Hansen et al. 2016). However, recent studies are now challenging this picture, at least at the metal-poor end of the Galactic halo (Arentsen et al. 2019; Bonifacio et al. 2020; Aguado et al. 2022). The fact that out of eight stars with [Fe/H] < −4.5 already observed with ESPRESSO, two of them are binaries increases the expected ratio of this rare class. We also notice that binarity could not be excluded from the other six stars with the data in hand (Aguado et al. 2022). Evidence of binarity among the most iron-poor CEMP-no stars is potentially very interesting. Indeed, theoretical models that study the fragmentation properties of star-forming clouds in the presence of dust (e.g., Omukai et al. 2005) found that gaseous environments with 10−5 Z⊙ < Z < 10−2 Z⊙ can fragment into very small sub-solar clumps, while the mass of these clumps increases for Z > 10−2 Z⊙. This implies that many low-mass stars can form in very metal-poor environments and thus that binary systems might be more common among very metal-poor stars (Matsukoba et al. 2022).
4.4. On the origin of carbon
Spite et al. (2013) noted that carbon is not following the general iron decrease, but it remains rather constant at the lowest metallicities. They suggested the existence of two different carbon levels: one with relatively high carbon abundance, [C/H] ≈ −2.0, and a second with about [C/H] ≈ −3.5. Carbon has a different origin in the two bands: in the high-C band, it is acquired from an AGB companion, together with n-capture elements. In the low-C band, it is instead representative of the environment of formation. However, what the stellar objects are that polluted this birth environment is still unclear.
Low-energy primordial faint supernovae (SNe) with mixing and fallback have been the first sources proposed to enrich the environment of formation of CEMP-no stars (e.g., Umeda & Nomoto 2003, 2005; Iwamoto et al. 2005; Tominaga et al. 2007; Ishigaki et al. 2014; Bonifacio et al. 2015). Recent models comparing the chemical abundances of five CEMP-no stars and the predicted SN yields confirm that SNe with a stellar mass of 11–22 M⊙ and low explosion energies, 0.3–1.8×1051 erg, are possible progenitors of CEMP-no stars (Almusleh et al. 2021). However, massive and fast-rotating low-metallicity ‘spinstars’ have also been proposed as possible sources of enrichment for the birth environment of CEMP-no stars (Meynet et al. 2006; Maeder et al. 2015). Ultimately, both solutions are plausible, and cosmological models can indeed successfully reproduce the observed fraction of CEMP-no stars at different [Fe/H] by including either primordial faint SNe (e.g., de Bennassuti et al. 2017) or spinstars (e.g., Liu et al. 2021). However, it has been shown that spinstars could produce a large amount of 13C (Meynet et al. 2006; Limongi & Chieffi 2018; Maeder et al. 2015), while zero-metallicity (faint) SNe do not (Heger & Woosley 2010).
Hence, our new results can allow us to finally constrain the progenitors of CEMP-no stars. SMSS 1605−1443 shows 12C/13C > 60 and in the CEMP-no star HE 0107−5240 this ratio is 87 ± 6 (Aguado et al. 2022). These high values in the carbon isotopic ratios rule out the significant production of 13C. Thus, the first generation of stars that polluted the gas from which CEMP-no stars are born does not seem to have made any significant amount of 13C. For this reason, the faint SNe hypothesis is favoured against spinstars. We note that Hansen et al. (2015a), Norris et al. (2013) measured low 12C/13C in a sample of CEMP-no stars. However, these stars also show [C/N] < 0, which is evidence of internal mixing according to Spite et al. (2006), and thus of a conversion of 12C into 13C (see also our Fig. 3).
The old, mega metal-poor star SMSS 1605−1443 ([Fe/H] = −6.2) is a unique single-lined, chemically unmixed binary star. Therefore, its chemical signature is likely reflecting the composition of the molecular natal cloud. New high-resolution ESPRESSO observations during the next years are required to constrain the orbital parameters. Finally, the new generation of not only spectroscopic but also photometric surveys such as Pristine (Starkenburg et al. 2017), S-Plus (Mendes de Oliveira et al. 2019), and J-Plus (Cenarro et al. 2019) will help to identify new CEMP-no candidates at [Fe/H] < −4 and shed light on the origin of these elusive fossils.
FERRE is available from http://github.com/callendeprieto/ferre
Acknowledgments
DA ans SS acknowledge support from the ERC Starting Grant NEFERTITI H2020/808240. EC acknowledges support from the French National Research Agency (ANR) funded project “Pristine” (ANR-18-CE31-0017). JIGH, CAP, ASM and RR acknowledge financial support from the Spanish Ministry of Science and Innovation (MICINN) project PID2020-117493GB-I00. MRZO acknowledges financial support from the Spanish Ministry of Science and Innovation through project PID2019-109522GB-C51. ASM acknowledges financial support from the Spanish Ministry of Science and Innovation (MICINN) under 2018 Juan de la Cierva program IJC2018-035229-I. ASM acknowledges financial support from the Government of the Canary Islands project ProID2020010129. FPE, CLO, and TMS would like to acknowledge the Swiss National Science Foundation (SNSF) for supporting research with ESPRESSO through the SNSF grants nr. 140649, 152721, 166227, 184618, and 193689. The ESPRESSO Instrument Project was partially funded through SNSF’s FLARE Programme for large infrastructures. DM is also supported by the INFN PD51 INDARK grant. This work was financed by FCT – Fundação para a Ciência e a Tecnologia under projects UIDB/04434/2020 & UIDP/04434/2020, CERN/FIS-PAR/0037/2019, PTDC/FIS-AST/0054/2021. CJM also acknowledges FCT and POCH/FSE (EC) support through Investigador FCT Contract 2021.01214.CEECIND/CP1658/CT0001.
References
- Aguado, D. S., González Hernández, J. I., Allende Prieto, C., & Rebolo, R. 2019, ApJ, 874, L21 [NASA ADS] [CrossRef] [Google Scholar]
- Aguado, D. S., Molaro, P., Caffau, E., et al. 2022, A&A, 668, A86 [NASA ADS] [CrossRef] [EDP Sciences] [Google Scholar]
- Allende Prieto, C., Beers, T. C., Wilhelm, R., et al. 2006, ApJ, 636, 804 [NASA ADS] [CrossRef] [Google Scholar]
- Almusleh, N. A., Taani, A., Özdemir, S., et al. 2021, Astron. Nachr., 342, 625 [NASA ADS] [CrossRef] [Google Scholar]
- Arentsen, A., Starkenburg, E., Shetrone, M. D., et al. 2019, A&A, 621, A108 [NASA ADS] [CrossRef] [EDP Sciences] [Google Scholar]
- Asplund, M., Grevesse, N., Sauval, A. J., & Scott, P. 2009, ARA&A, 47, 481 [NASA ADS] [CrossRef] [Google Scholar]
- Badenes, C., Mazzola, C., Thompson, T. A., et al. 2018, ApJ, 854, 147 [NASA ADS] [CrossRef] [Google Scholar]
- Bailer-Jones, C. A. L., Rybizki, J., Fouesneau, M., Mantelet, G., & Andrae, R. 2018, AJ, 156, 58 [Google Scholar]
- Beers, T. C., & Christlieb, N. 2005, ARA&A, 43, 531 [NASA ADS] [CrossRef] [Google Scholar]
- Behara, N. T., Bonifacio, P., Ludwig, H. G., et al. 2010, A&A, 513, A72 [NASA ADS] [CrossRef] [EDP Sciences] [Google Scholar]
- Bonifacio, P., Caffau, E., Spite, M., et al. 2015, A&A, 579, A28 [NASA ADS] [CrossRef] [EDP Sciences] [Google Scholar]
- Bonifacio, P., Molaro, P., Adibekyan, V., et al. 2020, A&A, 633, A129 [NASA ADS] [CrossRef] [EDP Sciences] [Google Scholar]
- Bromm, V., & Loeb, A. 2003, Nature, 425, 812 [NASA ADS] [CrossRef] [Google Scholar]
- Caffau, E., Bonifacio, P., François, P., et al. 2011, Nature, 477, 67 [NASA ADS] [CrossRef] [Google Scholar]
- Carollo, D., Beers, T. C., Lee, Y. S., et al. 2008, Nature, 451, 216 [NASA ADS] [CrossRef] [Google Scholar]
- Carollo, D., Beers, T. C., Bovy, J., et al. 2012, ApJ, 744, 195 [NASA ADS] [CrossRef] [Google Scholar]
- Cenarro, A. J., Moles, M., Cristóbal-Hornillos, D., et al. 2019, A&A, 622, A176 [NASA ADS] [CrossRef] [EDP Sciences] [Google Scholar]
- Chen, Z., Frank, A., Blackman, E. G., Nordhaus, J., & Carroll-Nellenback, J. 2017, MNRAS, 468, 4465 [NASA ADS] [CrossRef] [Google Scholar]
- Christlieb, N., Green, P. J., Wisotzki, L., & Reimers, D. 2001, A&A, 375, 366 [NASA ADS] [CrossRef] [EDP Sciences] [Google Scholar]
- Cohen, J. G., Shectman, S., Thompson, I., et al. 2005, ApJ, 633, L109 [NASA ADS] [CrossRef] [Google Scholar]
- Cropper, M., Katz, D., Sartoretti, P., et al. 2018, A&A, 616, A5 [NASA ADS] [CrossRef] [EDP Sciences] [Google Scholar]
- de Bennassuti, M., Salvadori, S., Schneider, R., Valiante, R., & Omukai, K. 2017, MNRAS, 465, 926 [NASA ADS] [CrossRef] [Google Scholar]
- Dekker, H., D’Odorico, S., Kaufer, A., Delabre, B., & Kotzlowski, H. 2000, in Optical and IR Telescope Instrumentation and Detectors, eds. M. Iye, & A. F. Moorwood, Proc. SPIE, 4008, 534 [Google Scholar]
- Frank, J., King, A., & Raine, D. J. 2002, Accretion Power in Astrophysics (Cambridge: Cambridge University Press) [Google Scholar]
- Frebel, A., Christlieb, N., Norris, J. E., et al. 2006, ApJ, 652, 1585 [Google Scholar]
- Freudling, W., Romaniello, M., Bramich, D. M., et al. 2013, A&A, 559, A96 [NASA ADS] [CrossRef] [EDP Sciences] [Google Scholar]
- Gaia Collaboration (Brown, A. G. A., et al.) 2021, A&A, 649, A1 [NASA ADS] [CrossRef] [EDP Sciences] [Google Scholar]
- Hansen, T., Hansen, C. J., Christlieb, N., et al. 2015a, ApJ, 807, 173 [Google Scholar]
- Hansen, T. T., Andersen, J., Nordström, B., et al. 2015b, A&A, 583, A49 [NASA ADS] [CrossRef] [EDP Sciences] [Google Scholar]
- Hansen, C. J., Nordström, B., Hansen, T. T., et al. 2016, A&A, 588, A37 [NASA ADS] [CrossRef] [EDP Sciences] [Google Scholar]
- Heger, A., & Woosley, S. E. 2010, ApJ, 724, 341 [Google Scholar]
- Herwig, F. 2005, ARA&A, 43, 435 [NASA ADS] [CrossRef] [Google Scholar]
- Hill, V., Plez, B., Cayrel, R., et al. 2002, A&A, 387, 560 [CrossRef] [EDP Sciences] [Google Scholar]
- Holmbeck, E. M., Hansen, T. T., Beers, T. C., et al. 2020, ApJS, 249, 30 [NASA ADS] [CrossRef] [Google Scholar]
- Ishigaki, M., Tominaga, N., Kobayashi, C., & Nomoto, K. 2014, ApJ, 792, L32 [NASA ADS] [CrossRef] [Google Scholar]
- Iwamoto, N., Umeda, H., Tominaga, N., Nomoto, K., & Maeda, K. 2005, Science, 309, 451 [NASA ADS] [CrossRef] [Google Scholar]
- Jones, S., Ritter, C., Herwig, F., et al. 2016, MNRAS, 455, 3848 [Google Scholar]
- Kipper, T., & Jorgensen, U. G. 1994, A&A, 290, 148 [NASA ADS] [Google Scholar]
- Kurucz, R. L. 2005, Mem. Soc. Astron. Ital., 8, 14 [Google Scholar]
- Limongi, M., & Chieffi, A. 2018, ApJS, 237, 13 [NASA ADS] [CrossRef] [Google Scholar]
- Liu, B., Sibony, Y., Meynet, G., & Bromm, V. 2021, MNRAS, 506, 5247 [NASA ADS] [CrossRef] [Google Scholar]
- Lucatello, S., Tsangarides, S., Beers, T. C., et al. 2005, ApJ, 625, 825 [NASA ADS] [CrossRef] [Google Scholar]
- Maeder, A., Meynet, G., & Chiappini, C. 2015, A&A, 576, A56 [NASA ADS] [CrossRef] [EDP Sciences] [Google Scholar]
- Martin, D. C., Fanson, J., Schiminovich, D., et al. 2005, ApJ, 619, L1 [Google Scholar]
- Masseron, T., Johnson, J. A., Lucatello, S., et al. 2012, ApJ, 751, 14 [NASA ADS] [CrossRef] [Google Scholar]
- Matsukoba, R., Tanaka, K. E. I., Omukai, K., Vorobyov, E. I., & Hosokawa, T. 2022, MNRAS, 515, 5506 [NASA ADS] [CrossRef] [Google Scholar]
- Mendes de Oliveira, C., Ribeiro, T., Schoenell, W., et al. 2019, MNRAS, 489, 241 [NASA ADS] [CrossRef] [Google Scholar]
- Meynet, G., Ekström, S., & Maeder, A. 2006, A&A, 447, 623 [NASA ADS] [CrossRef] [EDP Sciences] [Google Scholar]
- Mucciarelli, A., Bellazzini, M., & Massari, D. 2021, A&A, 653, A90 [NASA ADS] [CrossRef] [EDP Sciences] [Google Scholar]
- Nordlander, T., Bessell, M. S., Da Costa, G. S., et al. 2019, MNRAS, 488, L109 [Google Scholar]
- Norris, J. E., Yong, D., Bessell, M. S., et al. 2013, ApJ, 762, 28 [NASA ADS] [CrossRef] [Google Scholar]
- Omukai, K., Tsuribe, T., Schneider, R., & Ferrara, A. 2005, ApJ, 626, 627 [NASA ADS] [CrossRef] [Google Scholar]
- Pepe, F., Cristiani, S., Rebolo, R., et al. 2013, The Messenger, 153, 6 [NASA ADS] [Google Scholar]
- Pepe, F., Cristiani, S., Rebolo, R., et al. 2021, A&A, 645, A96 [NASA ADS] [CrossRef] [EDP Sciences] [Google Scholar]
- Pilachowski, C., Sneden, C., Hinkle, K., & Joyce, R. 1997, AJ, 114, 819 [NASA ADS] [CrossRef] [Google Scholar]
- Placco, V. M., Frebel, A., Beers, T. C., & Stancliffe, R. J. 2014, ApJ, 797, 21 [Google Scholar]
- Placco, V. M., Frebel, A., Lee, Y. S., et al. 2015, ApJ, 809, 136 [NASA ADS] [CrossRef] [Google Scholar]
- Ryan, S. G., Aoki, W., Norris, J. E., & Beers, T. C. 2005, ApJ, 635, 349 [NASA ADS] [CrossRef] [Google Scholar]
- Sbordone, L. 2005, Mem. Soc. Astron. Ital., 8, 61 [NASA ADS] [Google Scholar]
- Sivarani, T., Beers, T. C., Bonifacio, P., et al. 2006, A&A, 459, 125 [NASA ADS] [CrossRef] [EDP Sciences] [Google Scholar]
- Spite, M., Cayrel, R., Plez, B., et al. 2005, A&A, 430, 655 [NASA ADS] [CrossRef] [EDP Sciences] [Google Scholar]
- Spite, M., Cayrel, R., Hill, V., et al. 2006, A&A, 455, 291 [NASA ADS] [CrossRef] [EDP Sciences] [Google Scholar]
- Spite, M., Caffau, E., Bonifacio, P., et al. 2013, A&A, 552, A107 [NASA ADS] [CrossRef] [EDP Sciences] [Google Scholar]
- Spite, M., Spite, F., & Barbuy, B. 2021, A&A, 652, A97 [NASA ADS] [CrossRef] [EDP Sciences] [Google Scholar]
- Starkenburg, E., Shetrone, M. D., McConnachie, A. W., & Venn, K. A. 2014, MNRAS, 441, 1217 [Google Scholar]
- Starkenburg, E., Martin, N., Youakim, K., et al. 2017, MNRAS, 471, 2587 [NASA ADS] [CrossRef] [Google Scholar]
- Starkenburg, E., Aguado, D. S., Bonifacio, P., et al. 2018, MNRAS, 481, 3838 [NASA ADS] [CrossRef] [Google Scholar]
- Tody, D. 1993, in Astronomical Data, eds. R. J. Hanisch, R. J. V. Brissenden, & J. Barnes, ASP Conf. Ser., 52, 173 [NASA ADS] [Google Scholar]
- Tominaga, N., Umeda, H., & Nomoto, K. 2007, ApJ, 660, 516 [NASA ADS] [CrossRef] [Google Scholar]
- Tonry, J., & Davis, M. 1979, AJ, 84, 1511 [Google Scholar]
- Tsantaki, M., Pancino, E., Marrese, P., et al. 2022, A&A, 659, A95 [NASA ADS] [CrossRef] [EDP Sciences] [Google Scholar]
- Umeda, H., & Nomoto, K. 2003, Nature, 422, 871 [NASA ADS] [CrossRef] [PubMed] [Google Scholar]
- Umeda, H., & Nomoto, K. 2005, ApJ, 619, 427 [NASA ADS] [CrossRef] [Google Scholar]
- Vrug, A., ter Braak, C., Dicks, C., et al. 2009, Int. J. Nonlin. Sci. Numer. Simul., 10, 273 [Google Scholar]
- Wannier, P. G. 1980, ARA&A, 18, 399 [NASA ADS] [CrossRef] [Google Scholar]
- Weiss, A., Denissenkov, P. A., & Charbonnel, C. 2000, A&A, 356, 181 [NASA ADS] [Google Scholar]
- Yong, D., Norris, J. E., Bessell, M. S., et al. 2013, ApJ, 762, 26 [Google Scholar]
- Yoon, J., Beers, T. C., Placco, V. M., et al. 2016, ApJ, 833, 20 [Google Scholar]
- Zepeda, J., Beers, T. C., Placco, V. M., et al. 2022, AAS J., submitted [arXiv:2209.12224] [Google Scholar]
Appendix A: Co-added ESPRESSO spectrum and the table with vrad measurements.
The combined ESPRESSO spectrum of SMSS 1605−1443 is shown together with a table with all vrad measurements described in Sec 3.
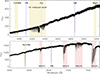 |
Fig. A.1. Co-added ESPRESSO spectrum of SMSS 1605−1443 (black lines). Absorptions corresponding to the Balmer series and Ca II H&K region are marked in red, purple, and yellow, respectively. Other metallic absorptions and the G band are also labelled. Regions with strong telluric contamination are masked in red. |
Radial velocities measurements from ESPRESSO, UVES and Mike.
Appendix B: 12C/13C calculation with an MCMC methodology
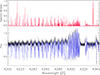 |
Fig. B.1. Upper-panel: Weights employed in the FERRE analysis (red). Lower-panel: Combined ESPRESSO spectrum around the G band (black) and the best fit derived with FERRE (blue). Both the data and the best fit were normalised with a running mean filter with a 300 pixel window. |
To derive a constringent 12C/13C lower limit, we employed an MCMC methodology already described in Aguado et al. (2019). First, following the recipe presented in Sec. 3.2, we computed a set of synthetic models with different values of 12C/13C, from ten to 90 in steps of ten. The rest of the stellar parameters, effective temperature, surface gravity, metallicity, and absolute carbon abundance were fixed to the values from Sec. 3. Then we packaged the stellar models in a FERREst3 readable shape.
Then, to identify the regions within the G band more sensible to 12C/13C variations, we subtracted the 12C/13C=90 normalised model from the 12C/13C=10 model. The result was scaled between 0 and 1 (top panel of Fig. B.1, in red). This difference was used to weigh the χ-squared evaluation: more weight was given to frequencies that contain more information on the 12C/13C ratio. FERRE is equipped with an option to read these weights and use them.
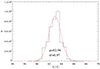 |
Fig. B.2. Sample distribution of Markov chain Monte Carlo experiments vs 12C/13C computed with FERRE (black histogram) and the modelled Gaussian distribution with parameters (red line). |
Subsequently, we normalised both the set of models and the ESPRESSO data by using a running mean filter with a 300 pixel window and indicated the code to fit the data with an MCMC self-adaptative randomised subspace sampling algorithm (Vrug et al. 2009). Ten chains of 5,000 experiments each (discarding the first 500) were run following this methodology. The data and the derived best fit is shown in Fig. B.1, in the lower panel. In Fig. B.2 we show the sample distribution of the MCMC experiments versus the most likely 12C/13C value. The distribution is somewhat skewed towards the higher values, and they could be approximated by a Gaussian with a central value of 62.94 and a variance of 0.97.
Although the result seems to be very robust with this methodology, we note that the spectral sensitivity at such high values of 12C/13C (i.e. low values of 13C) is relatively low. Thus, we worry about possible uncontrolled systematics and prefer to consider it as a lower limit. Then, considering the statistical parameters μ and σ2, we derived 12C/13C>60 at more than a 3 σ confidence level. Finally, we considered the central value of the distribution as a tentative detection of 13C with 12C/13C=62.94 and σ2 = 0.97.
All Tables
All Figures
|
Fig. 1. Narrow region of the ESPRESSO combined spectrum of SMSS 1605−1443 and HE 0107−5240 around the G band. Three different synthetic models computed with SYNTHE are also shown. |
| In the text | |
|
Fig. 2. Radial velocity points of SMSS 1605−1443 vs. modified Julian date (MJD), obtained with MIKE, UVES, and ESPRESSO. Grey and purple lines are a linear fit considering all instruments and ESPRESSO alone, respectively. The observed trend in HE 0107−5240 with ESPRESSO is also shown (black line, which has been vertically shifted to improve visibility). |
| In the text | |
|
Fig. 3. 12C/13C−[Fe/H] plane for SMSS 1605−1443 (red symbols) and other stars from the literature (blue symbols). According to Spite et al. (2006), the 12C/13C = 30 value is also shown. |
| In the text | |
|
Fig. A.1. Co-added ESPRESSO spectrum of SMSS 1605−1443 (black lines). Absorptions corresponding to the Balmer series and Ca II H&K region are marked in red, purple, and yellow, respectively. Other metallic absorptions and the G band are also labelled. Regions with strong telluric contamination are masked in red. |
| In the text | |
|
Fig. B.1. Upper-panel: Weights employed in the FERRE analysis (red). Lower-panel: Combined ESPRESSO spectrum around the G band (black) and the best fit derived with FERRE (blue). Both the data and the best fit were normalised with a running mean filter with a 300 pixel window. |
| In the text | |
|
Fig. B.2. Sample distribution of Markov chain Monte Carlo experiments vs 12C/13C computed with FERRE (black histogram) and the modelled Gaussian distribution with parameters (red line). |
| In the text | |
Current usage metrics show cumulative count of Article Views (full-text article views including HTML views, PDF and ePub downloads, according to the available data) and Abstracts Views on Vision4Press platform.
Data correspond to usage on the plateform after 2015. The current usage metrics is available 48-96 hours after online publication and is updated daily on week days.
Initial download of the metrics may take a while.