Open Access
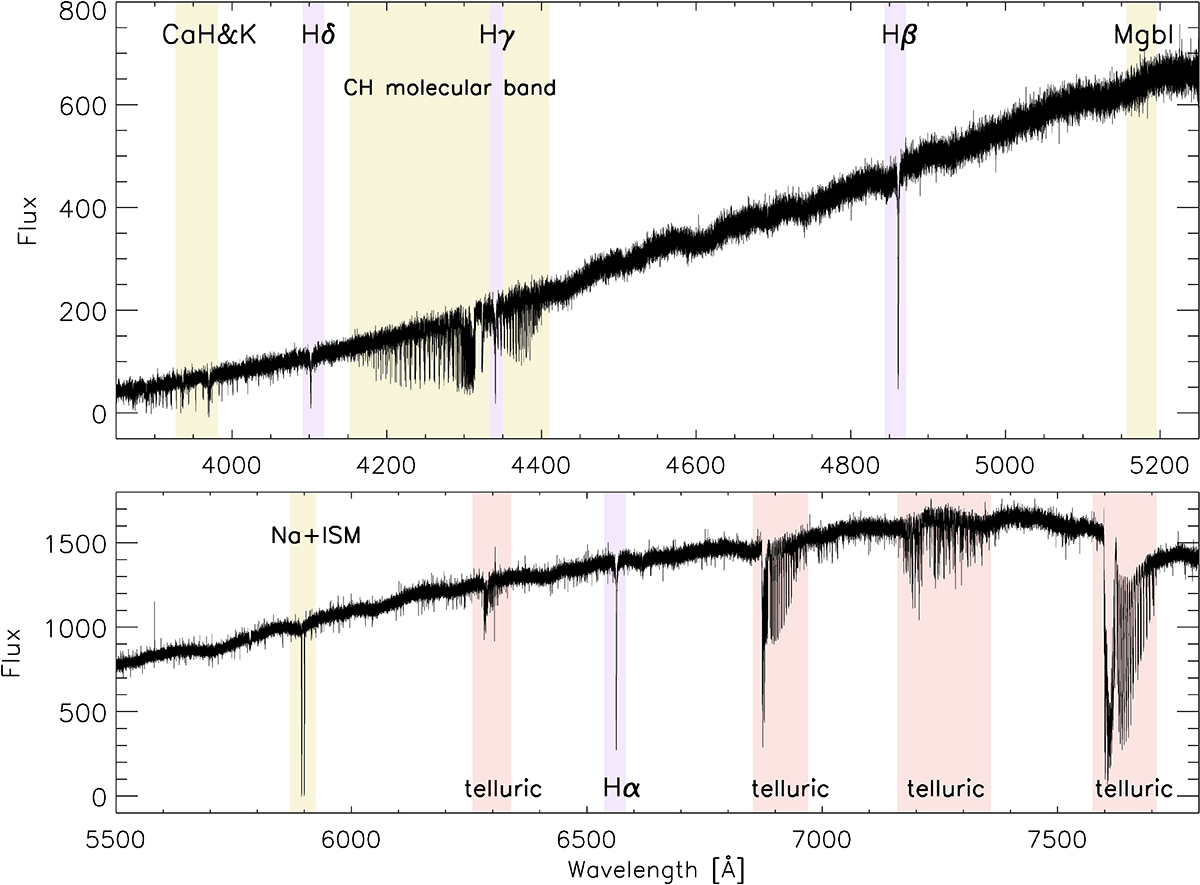
Fig. A.1.
Download original image
Co-added ESPRESSO spectrum of SMSS 1605−1443 (black lines). Absorptions corresponding to the Balmer series and Ca II H&K region are marked in red, purple, and yellow, respectively. Other metallic absorptions and the G band are also labelled. Regions with strong telluric contamination are masked in red.
Current usage metrics show cumulative count of Article Views (full-text article views including HTML views, PDF and ePub downloads, according to the available data) and Abstracts Views on Vision4Press platform.
Data correspond to usage on the plateform after 2015. The current usage metrics is available 48-96 hours after online publication and is updated daily on week days.
Initial download of the metrics may take a while.