| Issue |
A&A
Volume 669, January 2023
|
|
|---|---|---|
| Article Number | A7 | |
| Number of page(s) | 8 | |
| Section | Extragalactic astronomy | |
| DOI | https://doi.org/10.1051/0004-6361/202245034 | |
| Published online | 20 December 2022 | |
Unveiling a new extragalactic structure hidden by the Milky Way
1
Departamento de Geofísica y Astronomía, CONICET, Facultad de Ciencias Exactas, Físicas y Naturales, Universidad Nacional de San Juan, Av. Ignacio de la Roza 590 (O), J5402DCS Rivadavia, San Juan, Argentina
e-mail: This email address is being protected from spambots. You need JavaScript enabled to view it.
2
Facultad de Ciencias Astronómicas y Geofísicas, Universidad Nacional de La Plata, Paseo del Bosque s/n, B1900FWA La Plata, Argentina
3
Instituto de Astrofísica de La Plata, CONICET–UNLP, Paseo del Bosque s/n, B1900FWA La Plata, Argentina
4
Departamento de Astronomia, Universidade Federal do Rio Grande do Sul, Av. Bento Goncalves 9500, 91501-970 Porto Alegre, RS, Brasil
5
Instituto de Astrofísica, Facultad de Ciencias Exactas, Universidad Andres Bello, Av. Fernandez Concha 700, Las Condes, Santiago, Chile
6
Vatican Observatory, V00120 Vatican City State, Italy
Received:
19
September
2022
Accepted:
25
October
2022
Abstract
Context. The zone of avoidance (ZoA) does not allow for clear optical observations of extragalactic sources behind the Milky Way due to the meaningful extinction of the optical emission of these objects. Observations in near-infrared (NIR) wavelengths represent a potential source of astronomical discoveries that support the detection of new galaxies and potentially complete the picture of the large-scale structures in this as-yet poorly explored area of the sky.
Aims. Our aim is to decipher the nature of the overdensity located behind the Milky Way in tile b204 of the VISTA Variables in Vía Láctea (VVV) survey.
Methods. We studied an area of six arcmin around a galaxy concentration located at l = 354.82° and b = −9.81°. We selected five galaxies, taking into account the source distribution on the sky to optimise the requested time for the observations, and we obtained the spectra with Flamingos 2 long-slit spectrograph at Gemini South 8.1-meter telescope. To identify and characterise the absorption features, we fit the galaxies underlying spectrum using the STARLIGHT code together with the IRTF stellar library. In addition, the spectroscopic findings are reinforced using complementary photometric techniques such as red-sequence and photometric redshift estimation.
Results. The mean spectroscopic redshift estimated from the NIR spectra is z = 0.225 ± 0.014. This value presents a good agreement with that obtained from photometric analysis, photoz = 0.21 ± 0.08, and the probability distribution function of the galaxies in the studied region. Also, the red-sequence slope is consistent with the one expected for NIR observations of galaxy clusters.
Conclusions. The redshifts obtained from both, photometric and spectroscopic techniques are in good agreement, allowing for the confirmation of the nature of this structure at z = 0.225 ± 0.014, thereby unveiling a new galaxy cluster, VVVGCl-B J181435-381432, behind the Milky Way bulge.
Key words: Galaxy: structure / infrared: galaxies / techniques: spectroscopic / galaxies: clusters: general
© The Authors 2022
 Open Access article, published by EDP Sciences, under the terms of the Creative Commons Attribution License (https://creativecommons.org/licenses/by/4.0), which permits unrestricted use, distribution, and reproduction in any medium, provided the original work is properly cited.
This article is published in open access under the Subscribe-to-Open model. This email address is being protected from spambots. You need JavaScript enabled to view it. to support open access publication.
1. Introduction
The observation of extragalactic sources beyond the Milky Way is wrought with a continuing challenge due to Galactic dust absorption. In this area of the sky, called the zone of avoidance (ZoA), the local dust and stars obstruct optical observations. The resulting dust absorption impedes the retrieval of data and offers an incomplete picture of the existing galaxies, and, thus of the extragalactic structures behind the ZoA.
To obtain better information on this region, several galaxy catalogues have been developed across different wavelengths. The optical catalogues of Kraan-Korteweg & Lahav (2000) and Woudt et al. (2004) have allowed for the detection of new galaxies at low Galactic latitudes, although the gathering of information is restricted by Galactic dust and stars. Furthermore, near-infrared (NIR), X-ray, and H I radio surveys (Roman et al. 1998; Ebeling et al. 2002; Vauglin et al. 2002; Koribalski et al. 2004; Paturel et al. 2005; Skrutskie et al. 2006; Huchra et al. 2012) have detected galaxies and galaxy clusters at low Galactic latitudes. Also, Jarrett et al. (2000) have identified and extracted extended sources from the Two Micron All-Sky Survey (2MASS) catalogue and Macri et al. (2019) presented redshifts for 1041 2MASS Redshift Survey galaxies, mostly located within the ZoA, that had previously lacked this information.
Moreover, several works have attempted to reveal the presence of extragalactic structures, such as groups or clusters behind the Milky Way. In this line, Nagayama et al. (2004) performed a deep NIR survey with 19 confirmed galaxies and 38 galaxy candidates in a region of 36 × 36 arcmin2 centred on the giant elliptical radio galaxy PKS 1343−601, in the core of an unknown rich cluster located in the Great Attractor region. Also, Skelton et al. (2009) published a deep Ks band photometric catalogue containing 390 sources (235 galaxies and 155 galaxy candidates), in a region of 45 × 45 arcmin2, around the core of the rich nearby Norma cluster (ACO3627).
Furthermore, using the H I Parkes All-Sky Survey, Staveley-Smith et al. (2016) have observed 883 galaxies, delineating possible clusters and superclusters in the Great Attractor region, at low Galactic latitude. On the other hand, Schröder et al. (2019) published a catalogue with 170 galaxies, from the blind H I survey with the Effelsberg 100 m radio telescope, located in the northern region of the ZoA. These new large-scale extragalactic structures could be part of possible filaments at the edge of the local volume. Also, Kraan-Korteweg et al. (2017) discovered a supercluster of galaxies in the ZoA by performing optical spectroscopic observations of galaxies on the Vela region. These results imply a great advance but still leaving a large unexplored area.
The NIR public survey VISTA Variables in Vía Láctea (VVV; Minniti et al. 2010; Saito et al. 2012) has proven that although the main scientific goals of VVV are related to stellar sources (Minniti et al. 2011; Beamín et al. 2013; Ivanov et al. 2013), its exquisite depth (three magnitudes deeper than 2MASS) and high angular resolution make it an excellent tool for finding and studying extragalactic objects in the ZoA. For example, Amôres et al. (2012) identified 204 new galaxy candidates from the VVV photometry of a 1.636 square degrees region near the Galactic plane, increasing the surface density of known galaxies behind the Milky Way by more than an order of magnitude. Furthermore, Baravalle et al. (2018) found 530 new galaxy candidates in two tiles in the region of the Galactic disk using a combination of SExtractor and PSFEx techniques to detect and characterise these candidates. Baravalle et al. (2021) presented the VVV NIR galaxy catalogue containing 5563 galaxies beyond the MW disk.
With regard to extragalactic structures, Coldwell et al. (2014) found the VVV NIR galaxy counterparts of a new cluster of galaxies at redshift z = 0.13 observed in X-ray with SUZAKU (Mori et al. 2013). They detected 15 new candidate galaxy members, within the central region of the cluster up to 350 kpc from the X-ray peak emission, with typical magnitudes and colours of galaxies. In addition, Baravalle et al. (2019) confirmed the existence of the first galaxy cluster, discovered by the VVV survey beyond the galactic disk, by using spectroscopic data from the spectrograph Flamingos 2 (hereafter F2) at Gemini South Observatory. More recently, Galdeano et al. (2022) present an NIR view of Ophiuchus, the second-brightest galaxy cluster in the X-ray sky, finding seven times more cluster galaxy candidates than the number of reported Ophiuchus galaxies in previous works.
In Galdeano et al. (2021) (hereafter, G21) we found an unusual concentration of galaxies by exploring the b204 VVV tile, located at low latitude in the bulge region. In this area of 1.636 square degrees, we detected 624 extended sources, of which 607 correspond to new galaxy candidates that have been catalogued for the first time. By exploring the spatial galaxy distribution, we found a smaller region with a radius of 15 arcmin with a noticeable higher density, representing approximately 12% of the whole tile b204. This region contains 118 visually confirmed galaxies which is thrice higher density than the remaining tile area. In addition, the comparison of the number of galaxies in this area with the values obtained from mock catalogues allowed us to reinforce the existence of a galaxy overdensity. Even though the results from G21 provide strong evidence of extragalactic structures, the confirmation throughout spectroscopic redshifts measuring ensures a better knowledge of the nature of this structure. Based on these earlier studies, in this paper we present the results of Gemini South Observatory spectroscopic NIR observations of galaxies from the detected overdensity in G21. Moreover we complement the analysis with systematic photometric studies of this region with the aim of unveiling new extragalactic structures behind the ZoA.
This paper is structured as follows: in Sect. 2 we describe the data and the galaxy sample used for the analysis, along with the spectroscopic observations and data reduction. In Sect. 3 we present our general results, describing in Sect. 3.1 the techniques we used to obtain the spectroscopic redshift. The red-sequence analysis is presented in Sect. 3.2 and in Sect. 3.3 we describe the method to obtain photometric redshift. Finally, we discuss and summarise our main conclusions in Sect. 4. The adopted cosmology throughout this paper is Ω = 0.3, ΩΛ = 0.7, and H0 = 100 km s−1 Mpc.
2. The data
The results obtained from G21 motivated us to perform a deeper study of this area of the sky that has been reported to be characterised by an overdensity. With this aim, we selected a sample of galaxies to carry out NIR spectroscopy and decipher the nature of this structure. In order to optimise the requested time for the observations, we took into account the source distribution on the sky. Then, we chose five galaxies to perform the spectroscopic confirmation, by using two F2 slit positions to observe two and three galaxies simultaneously in each position. In addition, the selected galaxies were bright enough to guaranteed a suitable S/N, reducing the observation time and presenting photometric features, such as morphology and colours typical of galaxies in dense environments. The coordinates and total magnitudes of the spectroscopic NIR observational targets are detailed in Table 1.
ID, VVV name, coordinates, and total magnitudes of the spectroscopic targets properties observed with F2.
The overdensity of galaxies behind the Milky Way can be noticed in Fig. 1 (top panel), where the density profile is estimated as a function of the angular distance from the geometric centre of this region (l = 354.82° and b = −9.81°). In this figure, a clear excess is observed toward the region closer to the considered central position. Therefore, with the aim of confirming the existence of an overdense structure consistent with a galaxy cluster, in this paper we restricted the analysis to a smaller region around the central coordinates of the galaxy concentration considering a radius of six arcmin. This limiting value approximately corresponds to the radius where the excess becomes noticeable. In this area, 58 galaxy candidates fulfil the selection criteria described in G21.
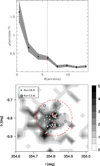 |
Fig. 1. Distribution of visually confirmed galaxies. Top panel: density profile as a function of the angular distance to the geometric centre of the overdensity region detected in the work of G21. The uncertainties were derived via a bootstrap resampling technique (Barrow et al. 1984). Bottom panel: density map of visually confirmed galaxies around the central overdense region. Filled contours are colour-codded according to number counts in pixels of 2 arcmin × 2 arcmin. The dashed circle represents the six arcmin radius studied area. Grey dots indicate the positions of the 58 visually detected galaxies (dot sizes are weighted according size is proportional to the Ks magnitude). The open red squares correspond to the galaxies observed with F2. |
The spatial distribution of the visually confirmed galaxies in the considered area can be observed in Fig. 1 (bottom panel). From the density map, it is possible to detect the region with higher density of extragalactic sources. The five selected galaxies are shown as red squares. In addition, in Fig. 2, we show a VVV false-colour multi-band (Z, J, Ks) image of the six arcmin radius studied area. It is possible to appreciate the five galaxies observed with F2 (red squares). Most of the detected extragalactic sources exhibit an extended morphology that is typical of galaxies, as well as presenting redder colours than the foreground stellar sources, which can be clearly observed for the 58 galaxy candidates zoomed in the right boxes the of Fig. 2. This remarkably large number of extragalactic sources, found in a very limited region of the sky, could indicate the presence of a group or cluster of galaxies.
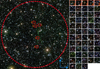 |
Fig. 2. False-colour Z (blue), J (green), and Ks (red) image of a region corresponding to the galaxy group or cluster candidate. The red dashed circle delimits the six arcmin radius central area, the green lines indicate the two long-slit positions and the red squares show the five galaxies observed with F2. In the right panels, we zoomed in on the 58 galaxy candidates within the studied area. The length of each box side is 20 arcsec. |
For the spectroscopic observations, we selected F2, which is a NIR imaging, long-slit, and (more recently) multi-object spectrograph at Gemini South 8.1-m telescope, located in Cerro Pachón, Chile. This instrument offers a wavelength range of 0.9–2.5 μm and a circular field of view of 6.1 arcmin on a 2048 × 2048 pixels HAWAII-2 detector array. It has a refractive all-spherical optical system, providing 0.18 arcsec pixels.
We observed a total of five galaxies with F2 in April 2019 (Program ID: GS-2019A-Q-123). These sources were selected from the list of 58 candidates, according to their spatial distribution and brightness in order to optimise the requested time for spectroscopic observations.
The observations were made by using HK (1.2–2.4 μm) band grism. Taking into account the VISTA telescope scale and the half-light radius calculated with SExtractor for the five galaxy candidates, we estimated the apparent width of these objects in approximately 1.1 arcsec. In this way we selected the six-pixel longslit width in order to collect the galaxy signal, but avoiding the light of the stars on the field. In this configuration, we obtained a spectral resolution close to 1400. The observations were performed with an airmass lower than 1.2 and no cloud coverage. The average seeing during the observing run was estimated at 0.9 arcsec. For each target we observed 12 × 110 s (0.37 h) of exposure time and the observational sky conditions were optimal, allowing us to reach a signal-to-noise ration of S/N ∼ 70 for all galaxies in the spectral region between 2,1 μm and 2,2 μm. With the first slit position, we observed three galaxies with Ks magnitudes of 15.18, 14.32, and 13.69, respectively. The angular projected distance between the first and second galaxy is 2.25 arcmin and between the first and third is 3.81. We located the longslit at a position angle of 122° from E to N. At the second slit position, we observed two group or cluster galaxy candidates with magnitudes Ks = 15.09 and Ks = 14.82, respectively. The distance between galaxies is 0.42 arcmin. In this case the position angle of the longslit was 97° from E to N (see e.g., green lines in Fig. 2). In order to provide telluric standards at similar air masses, we observed HIP 92688, which is an AO V star.
The spectra were reduced with Gemini IRAF package Version 1.14. As part of the basic data reduction steps, we created the necessary dark images and the normalised flat field. Then, we reduced the arc and determined the wavelength solution. We reduced and combined the telluric data and applied the wavelength calibration to extract the telluric spectrum. Next, we reduced and combined the science data. These steps were carried out with nsreduce, nscombine, nsfitcoords, nstransform, and nsextract routines. Afterwards, the wavelength calibration was applied to the science data in order to extract the science spectrum, using suitable apertures to reduce the noise in each one in order to reach the best S/N. Finally, we applied the telluric correction.
3. Results
The knowledge obtained from spectroscopic observations from Gemini, using F2, can be reinforced by analysing the photometric information available from the VVV survey. In this section, we describe both the spectroscopic and photometric results.
3.1. Spectroscopic redshift estimation
The galaxies inhabiting high density regions have identifiable characteristics such as, for instance, absorption lines and red colours. In Fig. 3, we present the NIR spectral features and the detected lines. The RGB images from these galaxies show their bulge-type morphology and red colours, as can be expected for galaxies within galaxy clusters following the morphology-density relation from Dressler (1980).
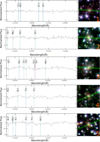 |
Fig. 3. Close-up of the 1.2–1.4 μm region. Left: final reduced and redshift-corrected NIR spectra. Right: RGB false colour image of the observed galaxies as in Fig. 2. The length of each box side is 20 arcsec. The green lines indicate the slit position. |
The observed spectra clearly present absorption features. Using as a first approach the photometric redshift estimates (see Sect. 3.3), these characteristics are located in the NIR spectral region, which is rich in absorption components (see Riffel et al. 2011, 2015, 2019). To correctly identify these features, we have cross-correlated the observed spectra with a set of stellar spectra, using the STARLIGHT code (Cid Fernandes et al. 2004, 2005; Asari et al. 2007; Cid Fernandes 2018). The procedures we have followed are described in Riffel et al. (2009, 2015, 2022), including, for example, the methods used to handle extinction, emission lines and differences in spectral resolution. Briefly, STARLIGHT fits an observed spectrum, Oλ, with a combination, in different proportions, of N* spectral base elements, solving the equation:
![Mathematical equation: $$ \begin{aligned} M_{\lambda }=M_{\lambda 0}\left[\sum _{j=1}^{N_{*}}x_j\,b_{j,\lambda }\,r_{\lambda } \right] \otimes G({v}_{*},\sigma _{*}), \end{aligned} $$](/articles/aa/full_html/2023/01/aa45034-22/aa45034-22-eq1.gif) (1)
(1)
where Mλ is a model spectrum, bj, λ rλ is the reddened spectrum of the jth N* normalised at λ0; rλ = 10−0.4(Aλ − Aλ0) is the reddening term; Mλ0 is the theoretical flux at the normalisation wavelength; x is the population vector, and G(v*, σ*) is the Gaussian distribution used to model the line-of-sight stellar motions, which is centred at velocity, v*, with dispersion σ*. The final fit is carried out searching for the minimum of the equation:
![Mathematical equation: $$ \begin{aligned} \chi ^2 = \sum _{\lambda }[(O_{\lambda }-M_{\lambda }){ w}_{\lambda }]^2, \end{aligned} $$](/articles/aa/full_html/2023/01/aa45034-22/aa45034-22-eq2.gif) (2)
(2)
where emission lines and spurious features are masked out by fixing wλ = 0 (normally, wλ = 1/eλ, with eλ being the uncertainty in Fλ). The quality of the fit is accessed by  which is the χ2 given by Eq. (2) divided by the number of points used in the fit and by adev = |Oλ − Mλ|/Oλ, namely the percentage mean deviation over all fitted pixels. For a detailed description of STARLIGHT see its manual1.
Since we are interested in identifying the stellar features to define the set of spectra used by the code to fit the underlying continuum we followed the approach of Riffel et al. (2015) and used their ‘stars approach’, which is a base composed of all the 210 dereddened stars (spectral types F–S/C and F being the hottest available) in the IRTF spectral library (Rayner et al. 2009; Cushing et al. 2005). Following this procedure, we were able to recognised absorption and emission lines considering Rayner et al. (2009). The spectral lines detected in the majority of galaxies are FeI, SiI, TiI, and MgI. In addition, the, CrI, KI, CaI, and MnI lines have been detected in a some cases.
The NIR detected lines for every individual galaxy, shown in Fig. 3 (left panels), are summarised as follows: ID 01 – VVVJ181430.28-381332.7 presents TiI (1.259 μm), FeI (1.265 μm), CrI (1.320 μm), and SiI (1.332 μm) lines in its spectrum, with all of them being absorption lines. From these lines, the estimated redshift is z = 0.225 ± 0.003. On the other hand, ID 02 – VVVJ181439.84-381447.1 shows SiI (1.228 μm), MgI (1.244 μm), FeI (1.257 μm), and SiI (1.310 μm) in absorption, with a measured redshift of z = 0.226 ± 0.003. Conversely, ID 03 – VVVJ181446.61-381537.5 presents CaI (1.308 μm) and SiI (1.310 μm) in emission, besides SiI (1.229 μm), FeI (1.262 μm), TiI (1.283 μm), and MnI (1.342 μm) in absorption. The measured redshift is z = 0.225 ± 0.004. Also, ID 04 – VVVJ181426.09-381408.0 shows FeI (1.227 μm) in emission, and SiI (1.258 μm) and TiI (1.283 μm, 1.308 μm) in absorption, with a redshift of z = 0.225 ± 0.002. Finally, ID 05 – VVVJ181429.59-381412.3 presents SiI (1.228 μm), MgI (1.242 μm), KI (1.252 μm), TiI (1.283 μm, 1.302 μm) and MnI (1.327 μm) in absorption, with a redshift of z = 0.225 ± 0.004. The measured redshifts of the five observed galaxies are pretty similar suggesting that they belong to a common system of galaxies with an estimated mean redshift of z = 0.225 ± 0.014. This finding allows us to speculate about the existence of a galaxy cluster behind the galactic bulge. In the following section, the photometric information on these galaxies, as well as on the remaining ones in the studied region, could shed light to this possibility.
3.2. Red sequence
Galaxy colours provide strong information about the evolutionary processes they have been subjected to and they are therefore indicative of the environment where they reside. The colour–magnitude diagrams of the galaxy clusters, known as the red-sequence (Gladders & Yee 2000), contain a well-defined and highly regular population of early-type galaxies, which have also been used by several authors to successfully identify clusters of galaxies (e.g., Gladders & Yee 2000; López-Cruz et al. 2004; Söchting et al. 2006).
In order to determine the nature of this overdense region, we used the VVV photometric information (as described in G21) of the galaxies within six arcmin radius from the estimated position of the overdensity to analyse the colour–magnitude relation. To further strengthen the identification of this region as a galaxy cluster, we used the model of Stott et al. (2009), calculated from semi-analytical model of Bower et al. (2006), considering the measured spectroscopic redshift z = 0.225 ± 0.014, obtaining a red-sequence model as shown in the colour–magnitude diagram of Fig. 4. Then, we performed χ-squared goodness-of-the-fit test finding a p > 0.05 value. As a result, we cannot reject the null hypothesis that this red-sequence model suitably fits our data.
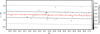 |
Fig. 4. Colour–magnitude diagram J − Ks vs. Ks. The points are colour-coded according to the projected distance at the centre of the overdensity zone. The red sequence model is shown as a red line, the dark grey lines represents ±1σ around the model and the light grey lines represents ±3σ. The black squares represents the five galaxies observed with F2. |
Figure 4 shows that all the galaxies in the 6 arcmin radius area are found within ±3σ around the red-sequence model. Furthermore, by restricting the selection to ±1σ around the linear model we found 40 galaxies (∼69%). This finding suggests that galaxies from this structure can reproduce a well-defined red-sequence corresponding to a galaxy cluster at the spectroscopic redshift estimated in Sect. 3.1. This result is consistent with what was found by Baravalle et al. (2019) and Galdeano et al. (2022) for other galaxy clusters studied using the VVV survey.
3.3. Photometric redshift
In order to investigate the redshift distribution of the 58 galaxy candidates in the area under study, we estimated the photometric redshift by running the software EAZY (Brammer et al. 2008). We considered the default set of parameters using all templates simultaneously, v1.0 template error function and the K-extended prior. To calculate the limiting redshift we consider that VVV photometry is three magnitudes deeper than 2MASS (Minniti et al. 2010). Therefore, taking into account the limiting redshift of 2MASS extended sources around z = 0.2 and Ks magnitude limit Ks = 15 (Bilicki et al. 2014), we can calculate an absolute magnitude limit of MKs ∼ −25 for 2MASS extended sources. If we take the limiting magnitude of our candidates, Ks = 17, we can observe a galaxy with absolute magnitude MKs ∼ −25.5 up to z ∼ 0.45; therefore, we permitted photometric redshift solutions in the range of 0 < z < 0.45, with a step of 0.01.
We built a photometric input catalogue that contains photometric fluxes and uncertainties observed in YJHKs VVV filters, requiring a minimum of three fluxes to perform the fit. We also required that peak-prob > 0.9 to prevent unreliable photometric redshift fits. Under these constrains, we are able to estimate the photometric redshifts for 34 galaxy candidates, obtaining a mean redshift of photoz = 0.21 ± 0.08.
In Fig. 5, we show the spatial distribution of galaxies in our sample, colour-coded according to the obtained photometric redshift. From this figure, we can appreciate the good agreement of the galaxy photometric redshifts in the area under study. In addition, there are some galaxies with estimated photometric redshift that differ significantly from the obtained spectroscopic redshift (six with photoz ∼ 0.05 and three with photoz ∼ 0.4). To study contaminant galaxies, we plot in the top panel of Fig. 6 the distribution of photoz as a function of the projected distance to the centre. We include, in this plot, the individual uncertainties in the photometric redshift estimation and show the obtained spectroscopic redshift and its associated errors. Here, we can appreciate that three of the most distant galaxies with photoz ∼ 0.05 may be considered as interlopers because they have a difference greater than 3σ as compared to the spectroscopic redshift. The errors associated to galaxies with photoz ∼ 0.4 are too large to allow for any conclusions to be drawn.
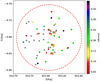 |
Fig. 5. Sky distribution of the 58 extended sources in the overdensity zone, colour-coded according to the obtained photometric redshift photoz. Grey dots represent objects with unreliable estimates and the open red squares are the galaxies observed with F2. The dashed circle represents the six arcmin area under study. |
To strengthen our result, we carried out an inspection of the probability distribution functions of galaxies with reliable photometric redshift. In the bottom panel of Fig. 6, we show the average probability distribution function for these 34 objects, finding that the resulting distribution is well behaved. We also plot the obtained spectroscopic redshift and its associated error (vertical red and grey lines, respectively). From the figure it can also be appreciated that the peak of the average probability distribution function is slightly moved toward higher redshifts with respect to the measured spectroscopic redshifts, with the difference being less than 3σ.
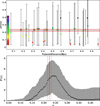 |
Fig. 6. Photometric redshifts estimates. Top: distribution of photoz as a function of the projected distance to the centre. The error bars correspond to 1σ individual uncertainties in the photometric redshift estimates. F2 observed galaxies are marked as red squares. Bottom: average probability distribution function of the 34 galaxies with reliable photometric redshifts in our sample. The line corresponds to the mean values and the shaded region to 1σ from the mean. The lines show the obtained spectroscopic redshift (grey) and its associated errors (red). |
4. Discussion and summary
Considering the high contamination by dust, gas, and stellar objects in the Milky Way’s central region, the lack of information about the extragalactic objects located behind this zone is a commonly recognised issue. With the aim to overcome this constraint, we analysed NIR images with the intention of reducing the contamination and highlighting the light coming from external galaxies. In this work, we present an analysis of an extragalactic overdense region located in the tile b204 of the VVV survey.
We restricted the analysis to an area of six arcmin around a galaxy concentration located at l = 354.82° and b = −9.81°, where 58 galaxy candidates can be observed by fulfilling the selection criteria described in G21. From this sample, we carefully selected five galaxies for which we went on to obtain NIR spectra, taking into account the magnitude and spatial distribution in order to optimise the requested time for spectroscopic observations. In this way, five spectra were taken with Flamingos 2 long-slit spectrograph at Gemini South 8.1-m telescope.
We found that all the spectra display absorption features, which is in agreement with the expected characteristics considering the morphology of the observed galaxies. In addition, we carried out a stellar population synthesis on the mean spectrum using the STARLIGHT spectral synthesis code. In this way, we found out that most galaxies show the continua dominated by stellar absorption features. The most abundant elements are Fe I, Si I, and Ti I. The spectroscopic redshift was calculated for every single galaxy, considering all lines identified in each spectrum, finding a mean redshift of z = 0.225 ± 0.014. Taking this result into account, the six arcmin radius used for the analysis performed in this paper corresponds to ≈1h−1Mpc, which represents a typical galaxy cluster radius located at this redshift.
In order to reinforce our result, complementary techniques such as red sequence and photometric redshift were applied. In this way, we analysed the NIR colour–magnitude diagram, considering the Ks magnitude and the J − Ks colours. Then, the red sequence model was performed following Stott et al. (2009) for a galaxy cluster at measured spectroscopic redshift z = 0.225 ± 0.014 finding 58 and 40 galaxies (∼100% and ∼69%), within ±3σ and ±1σ around the red-sequence linear model, respectively.
Furthermore, we estimated the photometric redshift of the galaxy candidates by running the EAZY software. We applied constraints requiring a minimum of three fluxes and peak-prob > 0.9 to ensure reliable fits. In this sense, the final sample features 34 galaxy candidates with reliable photometric redshift estimations with a mean value of photoz = 0.21 ± 0.08. Also, we made an inspection of the probability distribution functions of galaxies with reliable photometric redshifts, finding that the resulting average distribution is well behaved, with a mean and dispersion that are in good agreement with the average photoz.
Finally, considering the spectroscopic redshifts measurement of five galaxy members, we performed the estimation of the line-of-sight velocity dispersion of the cluster candidate using the gapper estimator described by Beers et al. (1990). Thus, for the velocity dispersion, we obtained a value of σ ≈ 400 km s−1. In addition, we calculated the virial radius and the virial mass of the galaxy cluster candidate following Merchán & Zandivarez (2005), finding Rvir ≈ 1.19 Mpc and Mvir ≈ 4.43 × 10¹³ M⊙. Although a high amount of spectroscopic observations will allow for accurate values of the cluster parameters to be obtained, these results are consistent with what is expected for rich galaxy groups (Domínguez et al. 2002; Merchán & Zandivarez 2005) or a galaxy cluster with a virial mass according to the redshift range z = 0.1 − 0.4 (Wiesner et al. 2015).
The agreement of the redshifts obtained from the three different methods and the estimated cluster parameters2 allow us to confirm the nature of this structure as a galaxy cluster at z = 0.225 ± 0.014. Named VVVGCl-B J181435-381432, its unveiling presents a new extragalactic system that had previously remained hidden behind the Milky Way bulge.
Acknowledgments
This work was partially supported by the Consejo Nacional de Investigaciones Científicas y Técnicas and the Secretaría de Ciencia y Técnica de la Universidad Nacional de San Juan. The authors gratefully acknowledge data from the ESO Public Survey program ID 179.B-2002 taken with the VISTA telescope, and products from the Cambridge Astronomical Survey Unit (CASU). This paper is based on observations obtained at the international Gemini Observatory, a program of NSF’s NOIRLab, which is managed by the Association of Universities for Research in Astronomy (AURA) under a cooperative agreement with the National Science Foundation on behalf of the Gemini Observatory partnership: the National Science Foundation (United States), National Research Council (Canada), Agencia Nacional de Investigación y Desarrollo (Chile), Ministerio de Ciencia, Tecnología e Innovación (Argentina), Ministério da Ciência, Tecnologia, Inovações e Comunicações (Brazil), and Korea Astronomy and Space Science Institute (Republic of Korea). RR thanks to Conselho Nacional de Desenvolvimento Científico e Tecnológico ( CNPq, Proj. 311223/2020-6, 304927/2017-1 and 400352/2016-8), Fundação de amparo à pesquisa do Rio Grande do Sul (FAPERGS, Proj. 16/2551-0000251-7 and 19/1750-2), Coordenação de Aperfeiçoamento de Pessoal de Nível Superior (CAPES, Proj. 0001). D.M. gratefully acknowledges support by the ANID BASAL projects ACE210002 and FB210003 and by Fondecyt Project No. 1220724. This research made use of Astropy, a community-developed core Python package for Astronomy (Astropy Collaboration 2013, 2018).
References
- Amôres, E. B., Sodré, L., Minniti, D., et al. 2012, AJ, 144, 127 [Google Scholar]
- Asari, N. V., Cid Fernandes, R., Stasińska, G., et al. 2007, MNRAS, 381, 263 [Google Scholar]
- Astropy Collaboration (Robitaille, T. P., et al.) 2013, A&A, 558, A33 [NASA ADS] [CrossRef] [EDP Sciences] [Google Scholar]
- Astropy Collaboration (Price-Whelan, A. M., et al.) 2018, AJ, 156, 123 [Google Scholar]
- Baravalle, L. D., Alonso, M. V., Nilo Castellón, J. L., Beamín, J. C., & Minniti, D. 2018, AJ, 155, 46 [Google Scholar]
- Baravalle, L. D., Nilo Castellón, J. L., Alonso, M. V., et al. 2019, ApJ, 874, 46 [Google Scholar]
- Baravalle, L. D., Alonso, M. V., Minniti, D., et al. 2021, MNRAS, 502, 601 [NASA ADS] [CrossRef] [Google Scholar]
- Barrow, J. D., Bhavsar, S. P., & Sonoda, D. H. 1984, MNRAS, 210, 19P [NASA ADS] [CrossRef] [Google Scholar]
- Beamín, J. C., Minniti, D., Gromadzki, M., et al. 2013, A&A, 557, L8 [NASA ADS] [CrossRef] [EDP Sciences] [Google Scholar]
- Beers, T. C., Flynn, K., & Gebhardt, K. 1990, AJ, 100, 32 [Google Scholar]
- Bilicki, M., Jarrett, T. H., Peacock, J. A., Cluver, M. E., & Steward, L. 2014, ApJS, 210, 9 [Google Scholar]
- Bower, R. G., Benson, A. J., Malbon, R., et al. 2006, MNRAS, 370, 645 [Google Scholar]
- Brammer, G. B., van Dokkum, P. G., & Coppi, P. 2008, ApJ, 686, 1503 [Google Scholar]
- Cid Fernandes, R. 2018, MNRAS, 480, 4480 [NASA ADS] [CrossRef] [Google Scholar]
- Cid Fernandes, R., Gu, Q., Melnick, J., et al. 2004, MNRAS, 355, 273 [Google Scholar]
- Cid Fernandes, R., Mateus, A., Sodré, L., Stasińska, G., & Gomes, J. M. 2005, MNRAS, 358, 363 [Google Scholar]
- Coldwell, G., Alonso, S., Duplancic, F., et al. 2014, A&A, 569, A49 [NASA ADS] [CrossRef] [EDP Sciences] [Google Scholar]
- Cushing, M. C., Rayner, J. T., & Vacca, W. D. 2005, ApJ, 623, 1115 [Google Scholar]
- Domínguez, M. J., Zandivarez, A. A., Martínez, H. J., et al. 2002, MNRAS, 335, 825 [CrossRef] [Google Scholar]
- Dressler, A. 1980, ApJ, 236, 351 [Google Scholar]
- Ebeling, H., Mullis, C. R., & Tully, R. B. 2002, ApJ, 580, 774 [Google Scholar]
- Galdeano, D., Pereyra, L., Duplancic, F., et al. 2021, A&A, 646, A146 [NASA ADS] [CrossRef] [EDP Sciences] [Google Scholar]
- Galdeano, D., Coldwell, G., Duplancic, F., et al. 2022, A&A, 663, A158 [NASA ADS] [CrossRef] [EDP Sciences] [Google Scholar]
- Gladders, M. D., & Yee, H. K. C. 2000, AJ, 120, 2148 [NASA ADS] [CrossRef] [Google Scholar]
- Huchra, J. P., Macri, L. M., Masters, K. L., et al. 2012, VizieR Online Data Catalog: J/ApJS/199/26 [Google Scholar]
- Ivanov, V. D., Minniti, D., Hempel, M., et al. 2013, A&A, 560, A21 [NASA ADS] [CrossRef] [EDP Sciences] [Google Scholar]
- Jarrett, T. H., Chester, T., Cutri, R., et al. 2000, AJ, 119, 2498 [Google Scholar]
- Koribalski, B. S., Staveley-Smith, L., Kilborn, V. A., et al. 2004, AJ, 128, 16 [Google Scholar]
- Kraan-Korteweg, R. C., & Lahav, O. 2000, A&ARv, 10, 211 [Google Scholar]
- Kraan-Korteweg, R. C., Cluver, M. E., Bilicki, M., et al. 2017, MNRAS, 466, L29 [NASA ADS] [CrossRef] [Google Scholar]
- López-Cruz, O., Barkhouse, W. A., & Yee, H. K. C. 2004, ApJ, 614, 679 [CrossRef] [Google Scholar]
- Macri, L. M., Kraan-Korteweg, R. C., Lambert, T., et al. 2019, ApJS, 245, 6 [Google Scholar]
- Merchán, M. E., & Zandivarez, A. 2005, ApJ, 630, 759 [CrossRef] [Google Scholar]
- Minniti, D., Lucas, P. W., Emerson, J. P., et al. 2010, New Astron., 15, 433 [Google Scholar]
- Minniti, D., Hempel, M., Toledo, I., et al. 2011, A&A, 527, A81 [NASA ADS] [CrossRef] [EDP Sciences] [Google Scholar]
- Mori, H., Maeda, Y., Furuzawa, A., Haba, Y., & Ueda, Y. 2013, PASJ, 65, 102 [NASA ADS] [Google Scholar]
- Nagayama, T., Woudt, P. A., Nagashima, C., et al. 2004, MNRAS, 354, 980 [Google Scholar]
- Paturel, G., Vauglin, I., Petit, C., et al. 2005, A&A, 430, 751 [NASA ADS] [CrossRef] [EDP Sciences] [Google Scholar]
- Rayner, J. T., Cushing, M. C., & Vacca, W. D. 2009, ApJS, 185, 289 [Google Scholar]
- Riffel, R., Pastoriza, M. G., Rodríguez-Ardila, A., & Bonatto, C. 2009, MNRAS, 400, 273 [Google Scholar]
- Riffel, R., Ruschel-Dutra, D., Pastoriza, M. G., et al. 2011, MNRAS, 410, 2714 [NASA ADS] [CrossRef] [Google Scholar]
- Riffel, R., Mason, R. E., Martins, L. P., et al. 2015, MNRAS, 450, 3069 [NASA ADS] [CrossRef] [Google Scholar]
- Riffel, R., Rodríguez-Ardila, A., Brotherton, M. S., et al. 2019, MNRAS, 486, 3228 [Google Scholar]
- Riffel, R., Dahmer-Hahn, L. G., Riffel, R. A., et al. 2022, MNRAS, 512, 3906 [NASA ADS] [CrossRef] [Google Scholar]
- Roman, A. T., Nakanishi, K., & Saito, M. 1998, PASJ, 50, 37 [Google Scholar]
- Saito, R. K., Hempel, M., Minniti, D., et al. 2012, A&A, 537, A107 [NASA ADS] [CrossRef] [EDP Sciences] [Google Scholar]
- Schröder, A. C., Flöer, L., Winkel, B., & Kerp, J. 2019, MNRAS, 489, 2907 [Google Scholar]
- Skelton, R. E., Woudt, P. A., & Kraan-Korteweg, R. C. 2009, MNRAS, 396, 2367 [Google Scholar]
- Skrutskie, M. F., Cutri, R. M., Stiening, R., et al. 2006, AJ, 131, 1163 [NASA ADS] [CrossRef] [Google Scholar]
- Söchting, I. K., Huber, M. E., Clowes, R. G., & Howell, S. B. 2006, MNRAS, 369, 1334 [CrossRef] [Google Scholar]
- Staveley-Smith, L., Kraan-Korteweg, R. C., Schröder, A. C., et al. 2016, AJ, 151, 52 [Google Scholar]
- Stott, J. P., Pimbblet, K. A., Edge, A. C., Smith, G. P., & Wardlow, J. L. 2009, MNRAS, 394, 2098 [NASA ADS] [CrossRef] [Google Scholar]
- Vauglin, I., Rousseau, J., Paturel, G., et al. 2002, A&A, 387, 1 [NASA ADS] [CrossRef] [EDP Sciences] [Google Scholar]
- Wiesner, M. P., Lin, H., & Soares-Santos, M. 2015, MNRAS, 452, 701 [NASA ADS] [CrossRef] [Google Scholar]
- Woudt, P. A., Kraan-Korteweg, R. C., Cayatte, V., Balkowski, C., & Felenbok, P. 2004, A&A, 415, 9 [NASA ADS] [CrossRef] [EDP Sciences] [Google Scholar]
All Tables
ID, VVV name, coordinates, and total magnitudes of the spectroscopic targets properties observed with F2.
All Figures
|
Fig. 1. Distribution of visually confirmed galaxies. Top panel: density profile as a function of the angular distance to the geometric centre of the overdensity region detected in the work of G21. The uncertainties were derived via a bootstrap resampling technique (Barrow et al. 1984). Bottom panel: density map of visually confirmed galaxies around the central overdense region. Filled contours are colour-codded according to number counts in pixels of 2 arcmin × 2 arcmin. The dashed circle represents the six arcmin radius studied area. Grey dots indicate the positions of the 58 visually detected galaxies (dot sizes are weighted according size is proportional to the Ks magnitude). The open red squares correspond to the galaxies observed with F2. |
| In the text | |
|
Fig. 2. False-colour Z (blue), J (green), and Ks (red) image of a region corresponding to the galaxy group or cluster candidate. The red dashed circle delimits the six arcmin radius central area, the green lines indicate the two long-slit positions and the red squares show the five galaxies observed with F2. In the right panels, we zoomed in on the 58 galaxy candidates within the studied area. The length of each box side is 20 arcsec. |
| In the text | |
|
Fig. 3. Close-up of the 1.2–1.4 μm region. Left: final reduced and redshift-corrected NIR spectra. Right: RGB false colour image of the observed galaxies as in Fig. 2. The length of each box side is 20 arcsec. The green lines indicate the slit position. |
| In the text | |
|
Fig. 4. Colour–magnitude diagram J − Ks vs. Ks. The points are colour-coded according to the projected distance at the centre of the overdensity zone. The red sequence model is shown as a red line, the dark grey lines represents ±1σ around the model and the light grey lines represents ±3σ. The black squares represents the five galaxies observed with F2. |
| In the text | |
|
Fig. 5. Sky distribution of the 58 extended sources in the overdensity zone, colour-coded according to the obtained photometric redshift photoz. Grey dots represent objects with unreliable estimates and the open red squares are the galaxies observed with F2. The dashed circle represents the six arcmin area under study. |
| In the text | |
|
Fig. 6. Photometric redshifts estimates. Top: distribution of photoz as a function of the projected distance to the centre. The error bars correspond to 1σ individual uncertainties in the photometric redshift estimates. F2 observed galaxies are marked as red squares. Bottom: average probability distribution function of the 34 galaxies with reliable photometric redshifts in our sample. The line corresponds to the mean values and the shaded region to 1σ from the mean. The lines show the obtained spectroscopic redshift (grey) and its associated errors (red). |
| In the text | |
Current usage metrics show cumulative count of Article Views (full-text article views including HTML views, PDF and ePub downloads, according to the available data) and Abstracts Views on Vision4Press platform.
Data correspond to usage on the plateform after 2015. The current usage metrics is available 48-96 hours after online publication and is updated daily on week days.
Initial download of the metrics may take a while.