Open Access
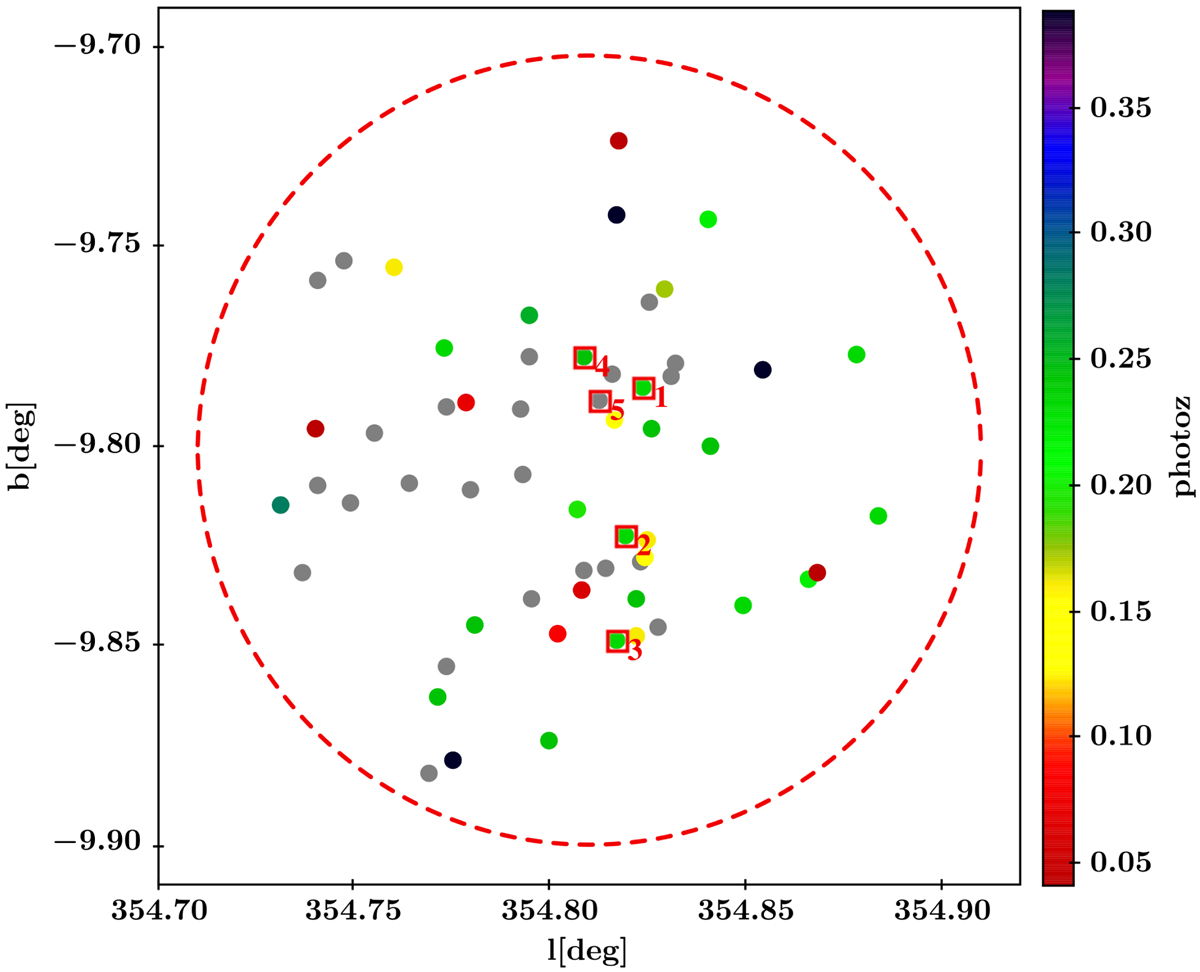
Fig. 5.
Download original image
Sky distribution of the 58 extended sources in the overdensity zone, colour-coded according to the obtained photometric redshift photoz. Grey dots represent objects with unreliable estimates and the open red squares are the galaxies observed with F2. The dashed circle represents the six arcmin area under study.
Current usage metrics show cumulative count of Article Views (full-text article views including HTML views, PDF and ePub downloads, according to the available data) and Abstracts Views on Vision4Press platform.
Data correspond to usage on the plateform after 2015. The current usage metrics is available 48-96 hours after online publication and is updated daily on week days.
Initial download of the metrics may take a while.