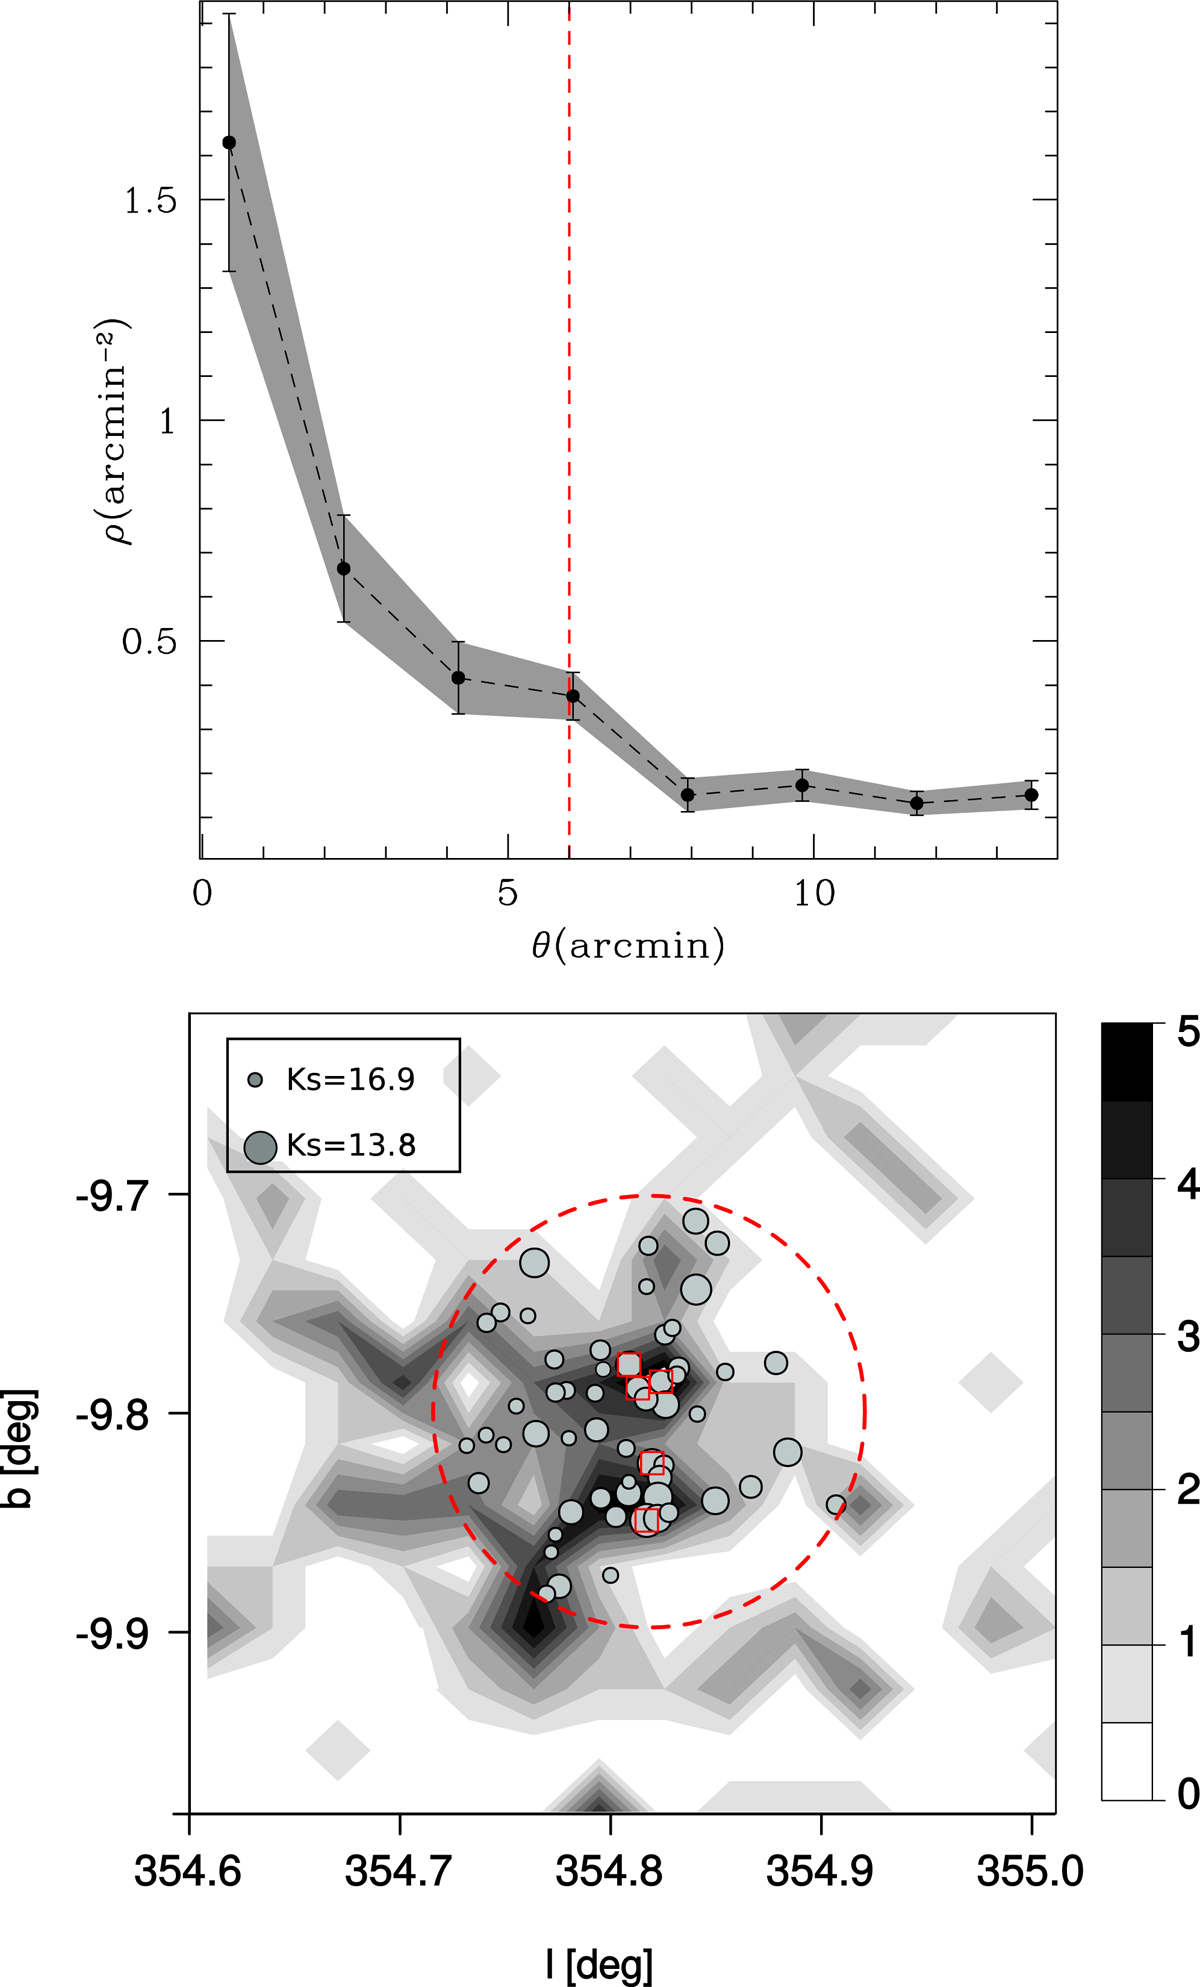
Fig. 1.
Download original image
Distribution of visually confirmed galaxies. Top panel: density profile as a function of the angular distance to the geometric centre of the overdensity region detected in the work of G21. The uncertainties were derived via a bootstrap resampling technique (Barrow et al. 1984). Bottom panel: density map of visually confirmed galaxies around the central overdense region. Filled contours are colour-codded according to number counts in pixels of 2 arcmin × 2 arcmin. The dashed circle represents the six arcmin radius studied area. Grey dots indicate the positions of the 58 visually detected galaxies (dot sizes are weighted according size is proportional to the Ks magnitude). The open red squares correspond to the galaxies observed with F2.
Current usage metrics show cumulative count of Article Views (full-text article views including HTML views, PDF and ePub downloads, according to the available data) and Abstracts Views on Vision4Press platform.
Data correspond to usage on the plateform after 2015. The current usage metrics is available 48-96 hours after online publication and is updated daily on week days.
Initial download of the metrics may take a while.