Open Access
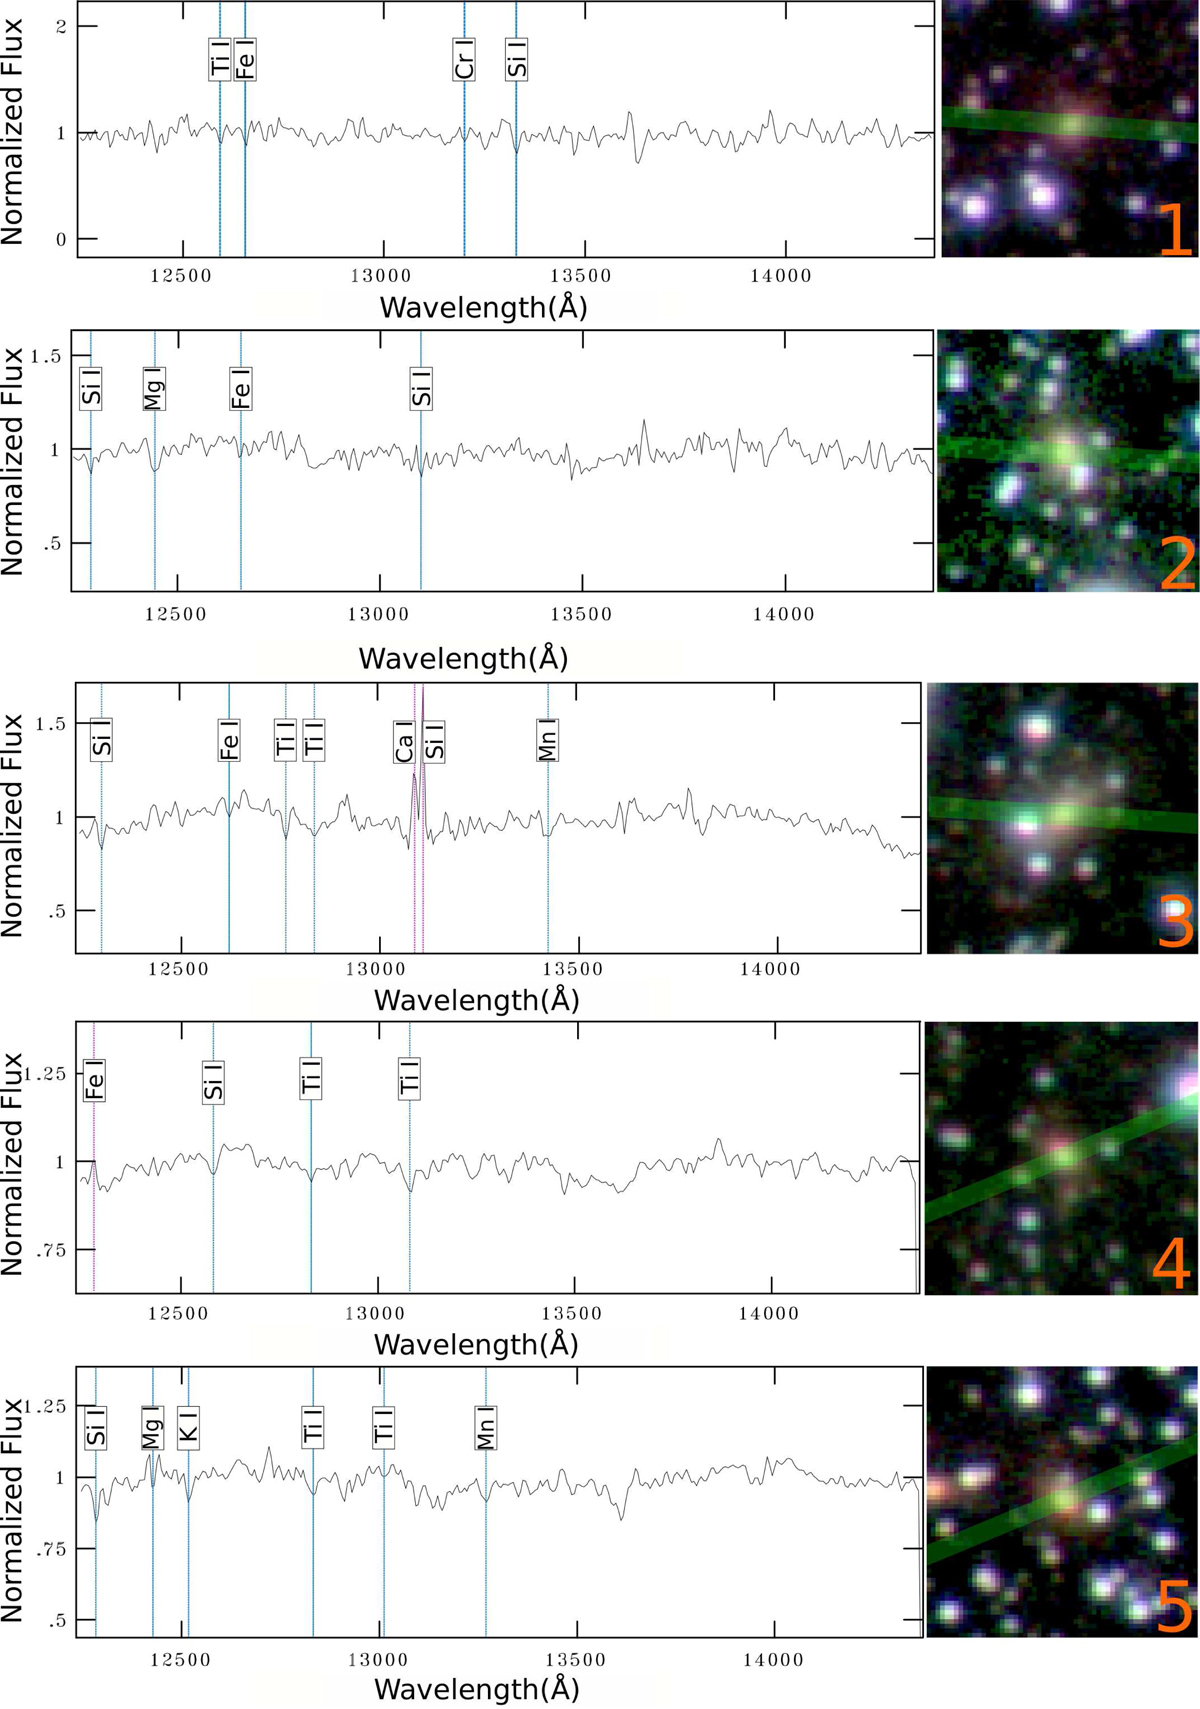
Fig. 3.
Download original image
Close-up of the 1.2–1.4 μm region. Left: final reduced and redshift-corrected NIR spectra. Right: RGB false colour image of the observed galaxies as in Fig. 2. The length of each box side is 20 arcsec. The green lines indicate the slit position.
Current usage metrics show cumulative count of Article Views (full-text article views including HTML views, PDF and ePub downloads, according to the available data) and Abstracts Views on Vision4Press platform.
Data correspond to usage on the plateform after 2015. The current usage metrics is available 48-96 hours after online publication and is updated daily on week days.
Initial download of the metrics may take a while.