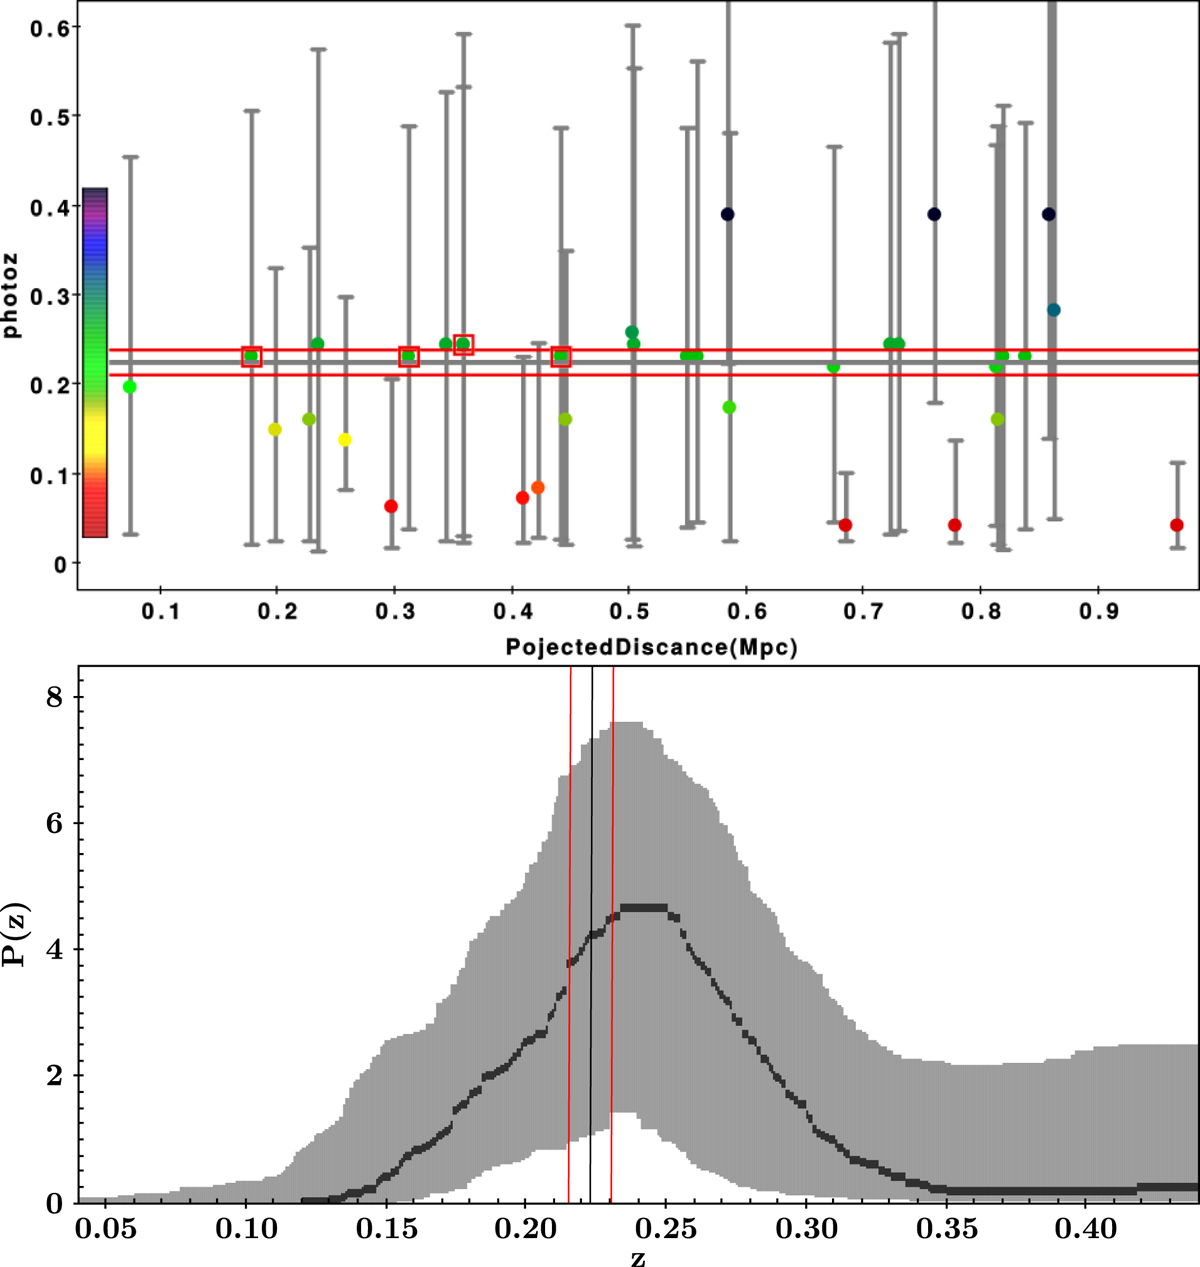
Fig. 6.
Download original image
Photometric redshifts estimates. Top: distribution of photoz as a function of the projected distance to the centre. The error bars correspond to 1σ individual uncertainties in the photometric redshift estimates. F2 observed galaxies are marked as red squares. Bottom: average probability distribution function of the 34 galaxies with reliable photometric redshifts in our sample. The line corresponds to the mean values and the shaded region to 1σ from the mean. The lines show the obtained spectroscopic redshift (grey) and its associated errors (red).
Current usage metrics show cumulative count of Article Views (full-text article views including HTML views, PDF and ePub downloads, according to the available data) and Abstracts Views on Vision4Press platform.
Data correspond to usage on the plateform after 2015. The current usage metrics is available 48-96 hours after online publication and is updated daily on week days.
Initial download of the metrics may take a while.