Fig. 4.
Download original image
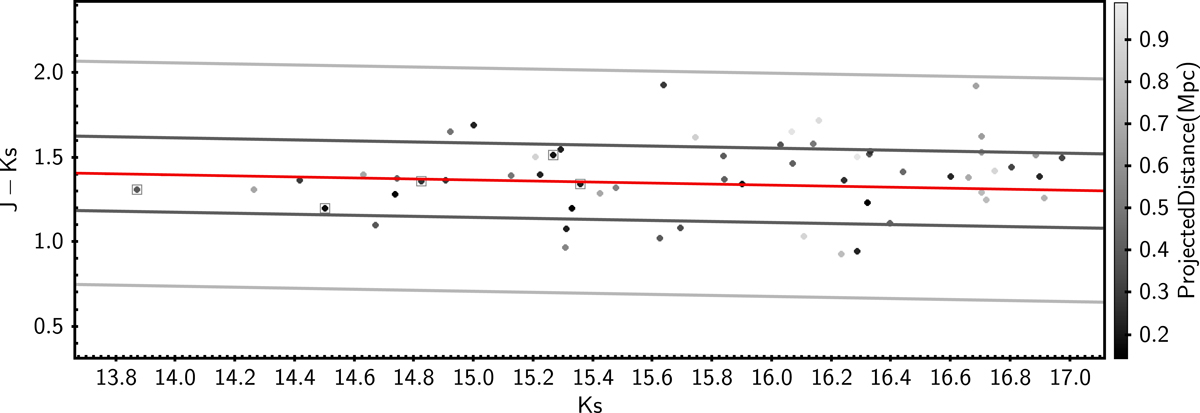
Colour–magnitude diagram J − Ks vs. Ks. The points are colour-coded according to the projected distance at the centre of the overdensity zone. The red sequence model is shown as a red line, the dark grey lines represents ±1σ around the model and the light grey lines represents ±3σ. The black squares represents the five galaxies observed with F2.
Current usage metrics show cumulative count of Article Views (full-text article views including HTML views, PDF and ePub downloads, according to the available data) and Abstracts Views on Vision4Press platform.
Data correspond to usage on the plateform after 2015. The current usage metrics is available 48-96 hours after online publication and is updated daily on week days.
Initial download of the metrics may take a while.