| Issue |
A&A
Volume 669, January 2023
|
|
|---|---|---|
| Article Number | A107 | |
| Number of page(s) | 9 | |
| Section | Galactic structure, stellar clusters and populations | |
| DOI | https://doi.org/10.1051/0004-6361/202142977 | |
| Published online | 18 January 2023 | |
Investigating the vertical distribution of the disk as a function of radial action
1
School of Physics, Shangqiu Normal University, 55 Pingyuan Road, Shangqiu 476000, PR China
e-mail: This email address is being protected from spambots. You need JavaScript enabled to view it.
2
CAS Key Laboratory of Optical Astronomy, National Astronomical Observatories, Chinese Academy of Sciences, 20A Datun Road, Chaoyang District, Beijing 100101, PR China
3
School of Astronomy and Space Science, University of Chinese Academy of Sciences, 19(A) Yuquan Road, Shijingshan District, Beijing 100049, PR China
Received:
22
December
2021
Accepted:
30
November
2022
Abstract
Aims. As heating processes can broaden the distributions of radial actions and the vertical distributions of the Galactic disks, we investigate the vertical distribution of the Galactic disks as a function of radial action based on Apache Point Observatory Galactic Evolution Experiment (APOGEE) and Gaia data in order to deepen our understanding of the formation and heating history of the Galactic disks.
Methods. The vertical distributions of the thin and thick Galactic disks defined in the chemical plane were fitted with a simple exponential function with a free parameter of scale height in different radial action ranges. Therefore, we were able to analyze the scale height as a function of radial action for different disk populations.
Results. We find that the distributions of radial action for both the thin and thick disks can be approximately described by pseudo-isothermal distributions, which give a statistical measurement for the temperature of the disk as indicated by the mean radial action of the star sample. Estimations of the scale heights in different radial action ranges for these pseudo-isothermal distributions of the disks seem to show fixed relationships between radial action JR and scale height h. We describe these relationships with a two-parameter function of h = √(JR/a)+b, where a and b are free parameters. When testing with a three-parameter function of h = α√(JR/a)+b, we find that this two-parameter function describes the thin disk well, but we note the function should be used with care for the thick disk. When comparing the best-fit relationships between the inner and outer disk for both of the thin and thick disks, we find that the relationships are nearly the same for the thin disks but are different for the thick disks. The inner thick disk shows a nearly flattened relationship, while the outer thick disk presents a gradually increasing relationship. This work highlights an alternative way to unveil the heating history of the disks by investigating the relationship between scale height and radial action, as these relationships encode the formation and heating history of the Galactic disks.
Key words: Galaxy: disk / Galaxy: formation / Galaxy: structure / Galaxy: fundamental parameters
© The Authors 2023
 Open Access article, published by EDP Sciences, under the terms of the Creative Commons Attribution License (https://creativecommons.org/licenses/by/4.0), which permits unrestricted use, distribution, and reproduction in any medium, provided the original work is properly cited.
This article is published in open access under the Subscribe-to-Open model. This email address is being protected from spambots. You need JavaScript enabled to view it. to support open access publication.
1. Introduction
It has long been recognized that Galactic disk stars could be scattered by giant molecular clouds (Spitzer & Schwarzschild 1953; Lacey 1984; Hänninen & Flynn 2002) or transient spiral structures (Barbanis & Woltjer 1967; Lynden-Bell & Kalnajs 1972; Carlberg & Sellwood 1985), or by both (Julian & Toomre 1966, or see Sellwood 2014), increasing the random motion (or radial action) of the stars. Such processes could drive secular changes in the energy and angular momentum (or guiding radius) of disk stars and result in a gradual increase in velocity dispersion with age for subgroups of disk stars. For this reason, such processes are loosely referred to as heating processes.
These kinds of dynamical processes are also found to be responsible for the formation of the Galactic thick disk because they are able to bring disk stars from a small vertical extent into a large one, allowing the thin disk stars to develop into the thick disk stars. For example, the heating of a preexisting thin disk through minor mergers (e.g., Quinn et al. 1993; Villalobos & Helmi 2008) is a mechanism widely used to explain the origin of the Galactic thick disk. However, there are other mechanisms that allow the Galactic thick disk to form: (i) accretion from disrupted satellites (Abadi et al. 2003) and (ii) in situ triggered star formation with various causes (e.g., Brook et al. 2004, 2005; Bournaud et al. 2009; Bird et al. 2013, 2021), which form the disk in an “upside-down” fashion (i.e., old stars form in a relatively thick layer, while young stars form in a thin layer). In addition, as evidenced by previous works (e.g., Nissen & Schuster 2010, 2011; Belokurov et al. 2018; Haywood et al. 2018; Di Matteo et al. 2019), major merger events are another possible mechanism contributing to the formation of the thick disk stars, which is supported by the work of Helmi et al. (2018), Gallart et al. (2019), Zhao & Chen (2021).
Previous research has shown that spiral structures do not always heat the Galactic disks. The pioneering work of Sellwood & Binney (2002) demonstrated that stars near corotation of a spiral pattern can vary their angular momenta without heating, which is a process known as radial migration. Further investigations have shown that radial migration can indeed occur due to a variety of sources, for example, spirals (e.g., Roškar et al. 2012), bars (e.g., Friedli et al. 1994), and satellites (e.g., Quillen et al. 2009; Bird et al. 2012), and conserves the vertical actions of stars (Solway et al. 2012; Minchev et al. 2012). It should be noted that kinematic heating can also occur during episodes of radial migration when resonant overlap is possible (Minchev & Quillen 2006; Minchev & Famaey 2010; Minchev et al. 2011; Daniel et al. 2019). Radial migration has been found to be able to account for the formation of the Galactic thick disk by the pioneering work of Schönrich & Binney (2009a) and further supported by subsequent research (e.g., Schönrich & Binney 2009b; Loebman et al. 2011; Roškar et al. 2013; Sharma et al. 2021), though these works are controversial because radial migration is found to have little effect on the thickening of the disk (Minchev et al. 2012; Halle et al. 2015). However, Schönrich & McMillan (2017) stated that the outward radial migration process under action conservation can achieve larger scale heights, which makes this mechanism a still possible scenario for the origin of the Galactic thick disk. Moreover, kinematic heating caused by radial migration (Daniel et al. 2019) increases radial action, which could affect the vertical distribution of disk stars and partly contribute to the formation of the Galactic thick disk.
Although there are different mechanisms related to the origin of the Galactic thick disk, it is helpful to investigate whether the thick disk stars are born thick or thin in order to partly distinguish the mechanism that dominates the formation of the Galactic thick disk. The cosmological simulations that have been run with different galaxy formation codes fail to give a consistent result for this question but nonetheless highlight the role of the physical processes in star formation (House et al. 2011), for example, the recipe for feedback (Miranda et al. 2016). An observational work using more than a hundred star-forming galaxies to investigate the variation in ionized gas velocity dispersions with redshift indicates that the thick disk is born hot (Wisnioski et al. 2015), while the work of Fraternali et al. (2021) studying high-redshift galaxies with emission lines of cold interstellar matter reveals the contrary.
In the Milky Way, the lack of direct observational evidence causes this topic to remain unresolved. The main reason is that the estimation of birth sites for the disk stars is nontrivial, especially for the thick disk stars, and the radial migration process makes this situation even worse (e.g., Wielen et al. 1996; Frankel et al. 2018; Minchev et al. 2018; Quillen et al. 2018; Chen et al. 2019; Feltzing et al. 2020). However, measuring the thickness of a population of related stars with a variable that can characterize heating is informative to the study of the heating origin of the thick disk. For this purpose, radial action is a suitable parameter, since it gradually increases by heating processes. Previous works have provided several ways to characterize these heating processes by using actions (e.g., Binney 2010; Binney & McMillan 2011; Ting & Rix 2019; Frankel et al. 2020), but there is no direct measurement for the relation of radial action with the thickness of the Galactic disk.
In this work, we investigate the relationship between radial action and the vertical distribution of the Galactic disk using data from the Apache Point Observatory Galactic Evolution Experiment (APOGEE) and Gaia with the purpose of deepening our understanding of the formation and heating history of the Galactic disks. This paper is structured as follows: in Sect. 2, we briefly describe the data adopted in this work; the methods and results are presented in Sect. 3. Finally, a discussion and conclusions are given in Sect. 4.
2. Data
In this work, we used a sample of the Galactic disk stars similar to (Jia et al. 2018, hereafter J18) that was obtained through cross-matching between the 14th data release of APOGEE (APOGEE DR14) and the second data release of Gaia (Gaia DR2). However, where the stellar heliocentric distances in J18 were computed by inverting the parallaxes from Gaia, in this work we updated the distances and kinematical and orbital parameters using a Bayesian approach that follows Yan et al. (2019). The details of parameter inference can be found in the above literature and references therein. In this section, we summarize the key points.
The posterior probability distribution of the parameters (heliocentric distance, tangential speed, and travel direction) were derived by multiplying a Gaussian distribution likelihood by a separable prior of parameters. The heliocentric distance prior is an exponentially decreasing space density distribution (Bailer-Jones 2015) with a Galactic longitude- and latitude-dependent length scale taken from Bailer-Jones et al. (2018). The tangential speed prior is a beta distribution where α = 2, β = 3, and vmax = 750 km s−1. The travel direction prior is a uniform distribution. We obtained the posterior probability distribution of radial velocity by multiplying a Gaussian distribution likelihood by a uniform prior in order to further estimate the kinematical and orbital parameters. The mean and standard deviation in Gaussian distribution of radial velocity were provided by the values of radial velocity and their error in the APOGEE catalog.
We used EMCEE (Foreman-Mackey et al. 2013) to draw random samples from the above posterior distributions for the parameters of heliocentric distance, tangential speed, travel direction, and radial velocity. The medians of the posterior samples were then used to derive the distance in Galactic cylindrical coordinates R and Z and the spatial velocities (U, V, W) in right-hand Cartesian coordinates. Coordinate transformation was adopted to obtain the cylindrical coordinate velocities VR and Vϕ after correcting the solar peculiar motion of (U, V, W)=(11.1, 12.24, 7.25) km s−1 (Schönrich et al. 2010). Then, the guiding radius (Rg) and orbital parameters, such as peri-center (Rp), apo-center (Ra), and eccentricity (e = (Ra − Rp)/(Ra + Rp)), were estimated with galpy (Bovy 2015) under the potential of McMillan17 (McMillan 2017). The actions were calculated with the Staeckel approximation (Binney 2012) under this potential. In the calculation, we adopted the Gaia parallax zero point of −0.0523 mas (Leung & Bovy 2019), a distance from the Sun to the Galactic center of 8.21 kpc, and a local standard of rest velocity of 233.1 km s−1 (McMillan 2017).
The Galactic disk star sample was selected by using the same criteria as in J18, which excluded stars with metallicities less than −1.0 dex; total velocities ( have been corrected for the solar peculiar motion) of less than 150 km s−1, to diminish the contamination from the halo; and stars at the fields of (l, |b|) < (10°, 10°), to remove the bulge stars. At this stage, the star sample comprised 149 685 giant stars. However, there were 736 stars among them whose actions failed to be calculated under the potential of McMillan17. Considering that these stars constituted less than one percent of our total star sample, we dropped them from the sample. The final number of stars in the sample adopted by this work is 148 949.
Most of the stars in this sample are located in a wide spatial range of the Galactic disk: 2 < R < 14 kpc and |Z|< 5 kpc (as shown in Fig. 1 where star distributions in the chemical plane of [M/H] vs. [Mg/Fe] are also presented in the bottom panel). Following J18, a solid line was used to cut the sample into a high-[Mg/Fe] sample and a low-[Mg/Fe] sample, corresponding to a thick disk star sample and a thin disk star sample, respectively.
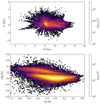 |
Fig. 1. Upper panel: distribution of the disk star sample in the R vs. Z plane. Bottom panel: distribution of the star sample in the [M/H] vs. [Mg/Fe] chemical plane. The solid line divides the thin disk from the thick disk. |
3. Method and results
As mentioned in the introduction, heating processes increase the random motions of stars and tend to move stars into more eccentric orbits. We illustrate the relations among the radial actions JR, eccentricities e, and R − Rg of the sample stars in Fig. 2. According to the theory of the epicycle approximation, the radial action of a star with a near-circular orbit can be expressed by its eccentricity through  , where κ denotes radial frequency. In the lower-left panel of Fig. 2, a black dashed line shows the relation between radial action and eccentricity for stars with a guiding radius of 8 kpc and radial frequency of 39 km s−1 kpc−1. Figure 2 shows that kinematically hot stars tend to have large radial actions and large |R − Rg|.
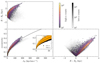 |
Fig. 2. Relations among radial action JR, eccentricity, and R − Rg. The black dashed line in the lower-left panel represents the relation between eccentricity and radial action for stars with a guiding radius of 8 kpc and a radial frequency of 39 km s−1 kpc−1 derived from epicycle approximation. |
Before investigating the relations between radial actions and the vertical distributions for the thin and thick disks, we focused on the distributions of radial actions for the thin and thick disks in Fig. 3. These distributions can be described by pseudo-isothermal distributions (Carlberg & Sellwood 1985; Binney 2010),  , where
  is a free parameter standing for the temperature of the disk. We estimated this parameter by using the maximum likelihood technique (Bienayme et al. 1987). Specifically, we obtained the ratio of the star number in a given JR bin and the bin’s width and compared them with the simulated data deriving from the above pseudo-isothermal distribution to search for the best-fit
  . The uncertainty was similarly estimated to that of Chang et al. (2011) and Chen et al. (2017).
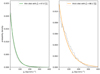 |
Fig. 3. Distributions of radial actions for the thin and thick disks. The solid lines represent the best-fit pseudo-isothermal distribution |


We calculated the likelihood 500 times using the observed data and the simulations of the best fitting model, applying the individual Poisson noise. The resulting likelihood range defined the uncertainty. The best-fit  for each disk is listed in the legends of Fig. 3, which is 47.0 kpc km s−1 and 88.1 kpc km s−1 for the thin disk and the thick disk, respectively. The pseudo-isothermal distribution of radial action requires that the best-fit
  be equal to the mean radial action of the star sample, which in our case is 47.1 kpc km s−1 for the thin disk and 81.9 kpc km s−1 for the thick disk. Regarding the uncertainties of the best-fit
  listed in the legend of Fig. 3, the best-fit value of
  almost matches the mean radial action of the star sample, indicating that either
  or the mean radial action is a suitable proxy for the temperature of the disk. Once a heating process increases the temperature of a star population from a pseudo-isothermal distribution with a low temperature to a high one, the mean radial action (or
  ) for that star population would also increase.
3.1. Results from the overall Galactic disk
In Fig. 4 we illustrate the vertical distributions in different radial action ranges for both the thin and thick disk star samples. In order to quantify the relation of radial action with the vertical distribution, every vertical number density distribution was fitted with an exponential function, that is, ρ(Z)∝exp(−|Z|/h), where h is the scale height, by using a procedure similar to what we used when fitting the distributions of radial action. We note that, at a large distance, this exponential function is approximate to the isothermal distribution, ρ(Z)∝sech2(−|Z|/(2h)). The resulting best-fit scale heights with their uncertainties are listed in the legend in each of the panels in Fig. 4.
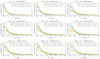 |
Fig. 4. Vertical distributions coupled with their best-fit models of the star samples in different radial action ranges. The vertical distributions have been fitted with a simple exponential function with a scale height. The best-fit scale heights are listed in the legends. In all panels, the solid lines are drawn from the best-fit results. |
In Fig. 5 we show the relations between radial action JR and scale height h for both the thin and thick disk, which are derived from Fig. 4. We attempt to describe the scale height as a function of radial action with a form of JR = a ⋅ (h − b)2, where a and b are free parameters. An alternative form of this function is  . The best-fit relations obtained from the maximum likelihood estimation technique are also shown in Fig. 5.
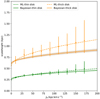 |
Fig. 5. Relations between radial action JR and scale height h for the thin and thick disks. The relations are fitted with a function of |

Considering that the best-fit scale heights may be less reliable due to the large uncertainties in large radial action bins (especially in the thick disk), which would affect the estimated parameters, we also applied a Bayesian inference. Compared to the maximum likelihood estimation technique, the advantage of Bayesian inference is that it directly compares the data with the model, avoiding the estimation of the scale height. By combining the normalized vertical number density of  and the relationship of
  , we can easily write the logarithm of the probability of finding a star with a given radial action of JR at distance Z,
 (1)
(1)
Therefore, the probability of finding a star where the radial action is JR and the distance is Z can be expressed through the known pseudo-isothermal distribution of radial action( ), that is:

By taking the logarithm of the above equation, we obtained the likelihood function:
 (2)
(2)
Then assuming a uniform prior that requires a > 0 and b > 0, we formulated the logarithm of posterior (up to a constant) to be:
 (3)
(3)
The summation is over all stars, and the value of  was chosen to be the mean of radial action of the star sample, instead of the best-fit values shown in Fig. 3 for the thin and thick disks. We find that this choice does not affect the estimated best-fit parameters.
We sampled the posterior via the EMCEE package with 1000 steps and 100 walkers. The initial start points of the chain are just the best-fit parameters that were obtained from the maximum likelihood estimation. Figure 6 illustrates the sampling of the model parameter posterior after discarding the initial 100 steps, and we used the 16th, 50th, and 84th percentiles to quote the uncertainties of the parameters. The best-fit relations from Bayesian inference are
 (4)
(4)
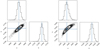 |
Fig. 6. Posterior of the model parameters for the overall thin (left panel) and thick (right panel) disks. The medians of the parameters are shown by blue lines. |
Predictions from these best-fit results are shown in Fig. 5 as are the uncertainties in predictions.
Figure 5 clearly shows that the maximum likelihood (or the data points) and Bayesian estimations give a consistent relationship for the thin disk, while they present a discrepancy for the thick disk. This discrepancy might arise from the estimated scale heights of the thick disk in large radial action ranges that are less reliable, reflected by their large uncertainties in Fig. 4. However, when taking the uncertainties of the Bayesian prediction and the best-fit scale heights into account, the resulting relation from Bayesian inference is basically in line with the data points. Considering that the Bayesian inference directly compares the model with data, we favor the results derived from this method.
We also explored a three-parameter function of JR = a ⋅ (h − b)α to describe the relationship between radial action and scale height. In the case where α = 2, this three-parameter function is the same model that we used in Fig. 5. The best-fit results of this three-parameter model are illustrated in Fig. 7. The best-fit α estimated from Bayesian inference is  for the thin disk, which is highly consistent with the function that was used in Fig. 5. For the thick disk, the best-fit α is
  , which might indicate that the function used in Fig. 5 is inappropriate for the thick disk. The uncertainties of α and of the prediction from Bayesian inference are too large for the thick disk, reducing the reliability of this three-parameter function. Thus, we prefer to still use the two-parameter function (JR = a ⋅ (h − b)2) to describe the relationship between radial action and scale height for the thick disk in this work, but we note that this two-parameter function for the thick disk should be used carefully in other works.
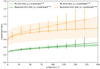 |
Fig. 7. Testing a three-parameter function (JR = a ⋅ (h − b)α or |
![Mathematical equation: $ h=\sqrt[\alpha]{J_{\mathrm{R}}/a}+b $](/articles/aa/full_html/2023/01/aa42977-21/aa42977-21-eq29.gif)
To better understand the relationships between the radial action and scale height we obtained, we started from the isothermal limit and epicycle approximation. In the isothermal limit (e.g., Problems 4.21 in Binney & Tremaine 2008) and epicycle approximation, the radial action is  and
and  . To express radial action JR in terms of scale height required σR to be a known function of σz. In our case, JR ∝ (h − b)2 requires
  . Therefore, the existence of the relationship between radial action and scale height reveals a fixed relationship between σR and σz. Without the knowledge of the exact relation between σR and σz from other data or theory to justify the relationship we measured, we elected to use JR = a ⋅ (h − b)2 to describe the relationship between radial action and scale height for both of the disks.
3.2. Results from the inner and outer disk
Previous works have found that some of the properties of the inner disk are different from the outer disk (e.g., Haywood et al. 2013, 2016; Mackereth et al. 2019), which seems to indicate different evolutionary histories. By using the guiding radius, we separated the Galactic disks into an inner disk set and an outer disk set. We defined the stars with a guiding radius smaller than 8 kpc as being an inner disk, and those with a guiding radius larger than 8 kpc as being an outer disk. The reason for using the guiding radius instead of the current galactocentric radius was that the guiding radius is more suited to representing the position of a star’s orbit.
We obtained the vertical distributions of the defined inner and outer disks and their corresponding best-fit distributions as we had done in Fig. 4, which are illustrated in Figs. 8 and 9, respectively. We point out that we increased the size of the radial action ranges in the last two lower panels of Fig. 9, as the number of stars in the outer disk is relatively small.
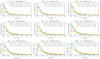 |
Fig. 8. Vertical distributions coupled with their best-fit models of the star samples in different radial action ranges in the inner disk (Rg < 8 kpc), as done in Fig. 4. |
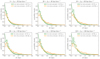 |
Fig. 9. Vertical distributions coupled with their best-fit models of the star samples in different radial action ranges in the outer disk (Rg > 8 kpc), as done in Fig. 4. It should be noted that we increase the size of radial action ranges in the last two lower panels, as the number of stars is relatively small in the outer disk, and the thick disk gives a relatively poor fit in the lower-right panel due to the insufficient number of stars in this radial action range. |
The relationships between radial actions and scale heights for the inner and outer disks are shown in Fig. 10. As done in Fig. 5, both maximum likelihood and Bayesian estimations were applied, but the latter is preferred, as we explained in the previous subsection. The best-fit relations derived from Bayesian inference for the overall thin and thick disk star samples in Fig. 5 are also plotted for comparison. The inner and outer thin disks show nearly the same relations as that of the overall thin disk. However, the inner and outer thick disks present different relationships from each other. The inner thick disk has a relatively flat relation, and the scale heights are larger than those of the overall thick disk, except at the large radial action end. In contrast, the outer thick disk shows a similar trend with that of the overall thick disk, but the scale height is smaller at all radial actions.
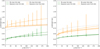 |
Fig. 10. Relationships between radial action JR and scale height h in the inner (left panel) and outer (right panel) disk. The relationships are fitted with a function of |

4. Discussion and conclusions
In this work, we have analyzed the scale height h as a function of radial action JR for the overall disk in Fig. 5 and for the inner and outer disk in Fig. 10 via two different approaches: maximum likelihood and Bayesian estimations. In order to directly compare this function with data, we estimated the scale heights in radial action ranges and then described the relationship between the scale height and radial action with a function of  using the maximum likelihood estimation technique. As the estimated scale heights for the thick disk at large radial action ranges are too large and may affect the best-fit relationship between radial action and scale height, we also applied a Bayesian estimation to directly compare the model with data, avoiding to estimate the scale height in different radial action ranges. It should be noted that we do not correct any biases in this work. The reasons are: (1) we only used chemical information to divide the thin and thick disks; (2) neither the APOGEE nor Gaia data are kinematically biased (Mackereth et al. 2019); and (3) most mono-age, mono-[Fe/H] populations are close to isothermal (e.g., Mackereth et al. 2019). Therefore, the disk stars are mostly phase-mixed in the vertical direction. The first two reasons demonstrate that the only bias arises from APOGEE spatial selection. However, the third reason assumes the bias does not strongly affect our main results, as we are only interested in the vertical distributions of the disk stars.
We find that a function of  is able to describe the thin disk well, but it should be used with care for the thick disk. The best-fit function given by Bayesian inference is
  for the thin disk, whereas
  for the thick disk. Moreover, we find that the thin disk has nearly the same relationship between the inner and outer disk, as seen from Fig. 10, while the thick disk presents different relationships: the inner thick disk shows a nearly flattened trend, and the outer thick disk has a gradually increasing trend.
As heating agents can broaden the distribution of radial action and increase the scale height of disk stars, the measured relationships encode the heating history and the origin information of the star samples. In the isothermal limit and epicycle approximation, we show that a function of  reveals a fixed relationship between the radial and vertical velocity dispersion, that is,
  . This relationship is the overall consequence from all of the heating agents. Without the aid of a simulation, it is hard to discuss the implications of these relationships on the formation and heating history of the disks. However, it is reasonable to suspect that giant molecular clouds may be a dominant or non-negligible heating agent to account for in these relationships, as they heat both radially and vertically and hence have a chance to form a fixed relationship between
  and
and  . We would like to further explore this content in the future. Most importantly, this work provides an alternative way to challenge models and thus study the heating history of the Galactic disks by investigating the relationship between radial action and scale height.
Acknowledgments
It is a pleasure to thank the referee for valuable comments and helpful suggestions which improve the manuscript much. This work is supported by the National Natural Science Foundation of China (Grant Nos. 11988101, 11890694, 11973042, 11973052), the China Manned Space Project with No. CMS-CSST-2021-B05, National Key R&D Program of China (Grant No. 2019YFA0405502) and the 2-m Chinese Space Survey Telescope project. Funding for the Sloan Digital Sky Survey IV has been provided by the Alfred P. Sloan Foundation, the U.S. Department of Energy Office of Science, and the Participating Institutions. SDSS-IV acknowledges support and resources from the Center for High-Performance Computing at the University of Utah. The SDSS web site is www.sdss.org. SDSS-IV is managed by the Astrophysical Research Consortium for the Participating Institutions of the SDSS Collaboration including the Brazilian Participation Group, the Carnegie Institution for Science, Carnegie Mellon University, the Chilean Participation Group, the French Participation Group, Harvard-Smithsonian Center for Astrophysics, Instituto de Astrofísica de Canarias, The Johns Hopkins University, Kavli Institute for the Physics and Mathematics of the Universe (IPMU)/University of Tokyo, Lawrence Berkeley National Laboratory, Leibniz Institut für Astrophysik Potsdam (AIP), Max-Planck-Institut für Astronomie (MPIA Heidelberg), Max-Planck-Institut für Astrophysik (MPA Garching), Max-Planck-Institut für Extraterrestrische Physik (MPE), National Astronomical Observatories of China, New Mexico State University, New York University, University of Notre Dame, Observatário Nacional/MCTI, The Ohio State University, Pennsylvania State University, Shanghai Astronomical Observatory, United Kingdom Participation Group, Universidad Nacional Autónoma de México, University of Arizona, University of Colorado Boulder, University of Oxford, University of Portsmouth, University of Utah, University of Virginia, University of Washington, University of Wisconsin, Vanderbilt University, and Yale University. This work has made use of data from the European Space Agency (ESA) mission Gaia (https://www.cosmos.esa.int/gaia), processed by the Gaia Data Processing and Analysis Consortium (DPAC, https://www.cosmos.esa.int/web/gaia/dpac/consortium). Funding for the DPAC has been provided by national institutions, in particular the institutions participating in the Gaia Multilateral Agreement.
References
- Abadi, M. G., Navarro, J. F., Steinmetz, M., & Eke, V. R. 2003, ApJ, 597, 21 [NASA ADS] [CrossRef] [Google Scholar]
- Bailer-Jones, C. A. L. 2015, PASP, 127, 994 [Google Scholar]
- Bailer-Jones, C. A. L., Rybizki, J., Fouesneau, M., Mantelet, G., & Andrae, R. 2018, AJ, 156, 58 [Google Scholar]
- Barbanis, B., & Woltjer, L. 1967, ApJ, 150, 461 [NASA ADS] [CrossRef] [Google Scholar]
- Belokurov, V., Erkal, D., Evans, N. W., Koposov, S. E., & Deason, A. J. 2018, MNRAS, 478, 611 [Google Scholar]
- Bienayme, O., Robin, A. C., & Creze, M. 1987, A&A, 180, 94 [NASA ADS] [Google Scholar]
- Binney, J. 2010, MNRAS, 401, 2318 [Google Scholar]
- Binney, J. 2012, MNRAS, 426, 1324 [Google Scholar]
- Binney, J., & McMillan, P. 2011, MNRAS, 413, 1889 [NASA ADS] [CrossRef] [Google Scholar]
- Binney, J., & Tremaine, S. 2008, Galactic Dynamics, 2nd edn. (Princeton: Princeton University Press) [Google Scholar]
- Bird, J. C., Kazantzidis, S., & Weinberg, D. H. 2012, MNRAS, 420, 913 [NASA ADS] [CrossRef] [Google Scholar]
- Bird, J. C., Kazantzidis, S., Weinberg, D. H., et al. 2013, ApJ, 773, 43 [Google Scholar]
- Bird, J. C., Loebman, S. R., Weinberg, D. H., et al. 2021, MNRAS, 503, 1815 [NASA ADS] [CrossRef] [Google Scholar]
- Bournaud, F., Elmegreen, B. G., & Martig, M. 2009, ApJ, 707, L1 [Google Scholar]
- Bovy, J. 2015, ApJS, 216, 29 [NASA ADS] [CrossRef] [Google Scholar]
- Brook, C. B., Gibson, B. K., Martel, H., & Kawata, D. 2005, ApJ, 630, 298 [NASA ADS] [CrossRef] [Google Scholar]
- Brook, C. B., Kawata, D., Gibson, B. K., & Freeman, K. C. 2004, ApJ, 612, 894 [NASA ADS] [CrossRef] [Google Scholar]
- Carlberg, R. G., & Sellwood, J. A. 1985, ApJ, 292, 79 [NASA ADS] [CrossRef] [Google Scholar]
- Chang, C.-K., Ko, C.-M., & Peng, T.-H. 2011, ApJ, 740, 34 [NASA ADS] [CrossRef] [Google Scholar]
- Chen, B.-Q., Liu, X.-W., Yuan, H.-B., et al. 2017, MNRAS, 464, 2545 [NASA ADS] [CrossRef] [Google Scholar]
- Chen, Y. Q., Zhao, G., Zhao, J. K., et al. 2019, AJ, 158, 249 [NASA ADS] [CrossRef] [Google Scholar]
- Daniel, K. J., Schaffner, D. A., McCluskey, F., Fiedler Kawaguchi, C., & Loebman, S. 2019, ApJ, 882, 111 [NASA ADS] [CrossRef] [Google Scholar]
- Di Matteo, P., Haywood, M., Lehnert, M. D., et al. 2019, A&A, 632, A4 [NASA ADS] [CrossRef] [EDP Sciences] [Google Scholar]
- Feltzing, S., Bowers, J. B., & Agertz, O. 2020, MNRAS, 493, 1419 [Google Scholar]
- Foreman-Mackey, D., Hogg, D. W., Lang, D., & Goodman, J. 2013, PASP, 125, 306 [Google Scholar]
- Frankel, N., Rix, H.-W., Ting, Y.-S., Ness, M., & Hogg, D. W. 2018, ApJ, 865, 96 [NASA ADS] [CrossRef] [Google Scholar]
- Frankel, N., Sanders, J., Ting, Y.-S., & Rix, H.-W. 2020, ApJ, 896, 15 [NASA ADS] [CrossRef] [Google Scholar]
- Fraternali, F., Karim, A., Magnelli, B., et al. 2021, A&A, 647, A194 [NASA ADS] [CrossRef] [EDP Sciences] [Google Scholar]
- Friedli, D., Benz, W., & Kennicutt, R. 1994, ApJ, 430, L105 [Google Scholar]
- Gallart, C., Bernard, E. J., Brook, C. B., et al. 2019, Nat. Astron., 3, 932 [NASA ADS] [CrossRef] [Google Scholar]
- Halle, A., Di Matteo, P., Haywood, M., & Combes, F. 2015, A&A, 578, A58 [NASA ADS] [CrossRef] [EDP Sciences] [Google Scholar]
- Hänninen, J., & Flynn, C. 2002, MNRAS, 337, 731 [CrossRef] [Google Scholar]
- Haywood, M., Di Matteo, P., Lehnert, M. D., Katz, D., & Gómez, A. 2013, A&A, 560, A109 [NASA ADS] [CrossRef] [EDP Sciences] [Google Scholar]
- Haywood, M., Lehnert, M. D., Di Matteo, P., et al. 2016, A&A, 589, A66 [NASA ADS] [CrossRef] [EDP Sciences] [Google Scholar]
- Haywood, M., Di Matteo, P., Lehnert, M. D., et al. 2018, ApJ, 863, 113 [Google Scholar]
- Helmi, A., Babusiaux, C., Koppelman, H. H., et al. 2018, Nature, 563, 85 [Google Scholar]
- House, E. L., Brook, C. B., Gibson, B. K., et al. 2011, MNRAS, 415, 2652 [NASA ADS] [CrossRef] [Google Scholar]
- Jia, Y., Chen, Y., Zhao, G., et al. 2018, ApJ, 863, 93 [NASA ADS] [CrossRef] [Google Scholar]
- Julian, W. H., & Toomre, A. 1966, ApJ, 146, 810 [NASA ADS] [CrossRef] [Google Scholar]
- Lacey, C. G. 1984, MNRAS, 208, 687 [NASA ADS] [CrossRef] [Google Scholar]
- Leung, H. W., & Bovy, J. 2019, MNRAS, 489, 2079 [CrossRef] [Google Scholar]
- Loebman, S. R., Roškar, R., Debattista, V. P., et al. 2011, ApJ, 737, 8 [Google Scholar]
- Lynden-Bell, D., & Kalnajs, A. J. 1972, MNRAS, 157, 1 [Google Scholar]
- Mackereth, J. T., Bovy, J., Leung, H. W., et al. 2019, MNRAS, 489, 176 [Google Scholar]
- McMillan, P. J. 2017, MNRAS, 465, 76 [NASA ADS] [CrossRef] [Google Scholar]
- Minchev, I., & Famaey, B. 2010, ApJ, 722, 112 [Google Scholar]
- Minchev, I., & Quillen, A. C. 2006, MNRAS, 368, 623 [NASA ADS] [CrossRef] [Google Scholar]
- Minchev, I., Famaey, B., Combes, F., et al. 2011, A&A, 527, A147 [NASA ADS] [CrossRef] [EDP Sciences] [Google Scholar]
- Minchev, I., Famaey, B., Quillen, A. C., et al. 2012, A&A, 548, A127 [NASA ADS] [CrossRef] [EDP Sciences] [Google Scholar]
- Minchev, I., Anders, F., Recio-Blanco, A., et al. 2018, MNRAS, 481, 1645 [NASA ADS] [CrossRef] [Google Scholar]
- Miranda, M. S., Pilkington, K., Gibson, B. K., et al. 2016, A&A, 587, A10 [NASA ADS] [CrossRef] [EDP Sciences] [Google Scholar]
- Nissen, P. E., & Schuster, W. J. 2010, A&A, 511, L10 [NASA ADS] [CrossRef] [EDP Sciences] [Google Scholar]
- Nissen, P. E., & Schuster, W. J. 2011, A&A, 530, A15 [NASA ADS] [CrossRef] [EDP Sciences] [Google Scholar]
- Quillen, A. C., Minchev, I., Bland-Hawthorn, J., & Haywood, M. 2009, MNRAS, 397, 1599 [NASA ADS] [CrossRef] [Google Scholar]
- Quillen, A. C., Nolting, E., Minchev, I., De Silva, G., & Chiappini, C. 2018, MNRAS, 475, 4450 [NASA ADS] [CrossRef] [Google Scholar]
- Quinn, P. J., Hernquist, L., & Fullagar, D. P. 1993, ApJ, 403, 74 [Google Scholar]
- Roškar, R., Debattista, V. P., Quinn, T. R., & Wadsley, J. 2012, MNRAS, 426, 2089 [Google Scholar]
- Roškar, R., Debattista, V. P., & Loebman, S. R. 2013, MNRAS, 433, 976 [CrossRef] [Google Scholar]
- Schönrich, R., & Binney, J. 2009a, MNRAS, 396, 203 [Google Scholar]
- Schönrich, R., & Binney, J. 2009b, MNRAS, 399, 1145 [Google Scholar]
- Schönrich, R., & McMillan, P. J. 2017, MNRAS, 467, 1154 [NASA ADS] [Google Scholar]
- Schönrich, R., Binney, J., & Dehnen, W. 2010, MNRAS, 403, 1829 [NASA ADS] [CrossRef] [Google Scholar]
- Sellwood, J. A. 2014, Rev. Mod. Phys., 86, 1 [Google Scholar]
- Sellwood, J. A., & Binney, J. J. 2002, MNRAS, 336, 785 [Google Scholar]
- Sharma, S., Hayden, M. R., & Bland-Hawthorn, J. 2021, MNRAS, 507, 5882 [NASA ADS] [CrossRef] [Google Scholar]
- Solway, M., Sellwood, J. A., & Schönrich, R. 2012, MNRAS, 422, 1363 [NASA ADS] [CrossRef] [Google Scholar]
- Spitzer, L., Jr, & Schwarzschild, M. 1953, ApJ, 118, 106 [NASA ADS] [CrossRef] [Google Scholar]
- Ting, Y.-S., & Rix, H.-W. 2019, ApJ, 878, 21 [NASA ADS] [CrossRef] [Google Scholar]
- Villalobos, Á., & Helmi, A. 2008, MNRAS, 391, 1806 [Google Scholar]
- Wielen, R., Fuchs, B., & Dettbarn, C. 1996, A&A, 314, 438 [NASA ADS] [Google Scholar]
- Wisnioski, E., Förster Schreiber, N. M., Wuyts, S., et al. 2015, ApJ, 799, 209 [Google Scholar]
- Yan, Y., Du, C., Liu, S., et al. 2019, ApJ, 880, 36 [NASA ADS] [CrossRef] [Google Scholar]
- Zhao, G., & Chen, Y. 2021, Sci. China Phys. Mech. Astron., 64, 239562 [NASA ADS] [CrossRef] [Google Scholar]
All Figures
|
Fig. 1. Upper panel: distribution of the disk star sample in the R vs. Z plane. Bottom panel: distribution of the star sample in the [M/H] vs. [Mg/Fe] chemical plane. The solid line divides the thin disk from the thick disk. |
| In the text | |
|
Fig. 2. Relations among radial action JR, eccentricity, and R − Rg. The black dashed line in the lower-left panel represents the relation between eccentricity and radial action for stars with a guiding radius of 8 kpc and a radial frequency of 39 km s−1 kpc−1 derived from epicycle approximation. |
| In the text | |
|
Fig. 3. Distributions of radial actions for the thin and thick disks. The solid lines represent the best-fit pseudo-isothermal distribution |
| In the text | |
|
Fig. 4. Vertical distributions coupled with their best-fit models of the star samples in different radial action ranges. The vertical distributions have been fitted with a simple exponential function with a scale height. The best-fit scale heights are listed in the legends. In all panels, the solid lines are drawn from the best-fit results. |
| In the text | |
|
Fig. 5. Relations between radial action JR and scale height h for the thin and thick disks. The relations are fitted with a function of |
| In the text | |
|
Fig. 6. Posterior of the model parameters for the overall thin (left panel) and thick (right panel) disks. The medians of the parameters are shown by blue lines. |
| In the text | |
|
Fig. 7. Testing a three-parameter function (JR = a ⋅ (h − b)α or |
| In the text | |
|
Fig. 8. Vertical distributions coupled with their best-fit models of the star samples in different radial action ranges in the inner disk (Rg < 8 kpc), as done in Fig. 4. |
| In the text | |
|
Fig. 9. Vertical distributions coupled with their best-fit models of the star samples in different radial action ranges in the outer disk (Rg > 8 kpc), as done in Fig. 4. It should be noted that we increase the size of radial action ranges in the last two lower panels, as the number of stars is relatively small in the outer disk, and the thick disk gives a relatively poor fit in the lower-right panel due to the insufficient number of stars in this radial action range. |
| In the text | |
|
Fig. 10. Relationships between radial action JR and scale height h in the inner (left panel) and outer (right panel) disk. The relationships are fitted with a function of |
| In the text | |
Current usage metrics show cumulative count of Article Views (full-text article views including HTML views, PDF and ePub downloads, according to the available data) and Abstracts Views on Vision4Press platform.
Data correspond to usage on the plateform after 2015. The current usage metrics is available 48-96 hours after online publication and is updated daily on week days.
Initial download of the metrics may take a while.