Fig. 10.
Download original image
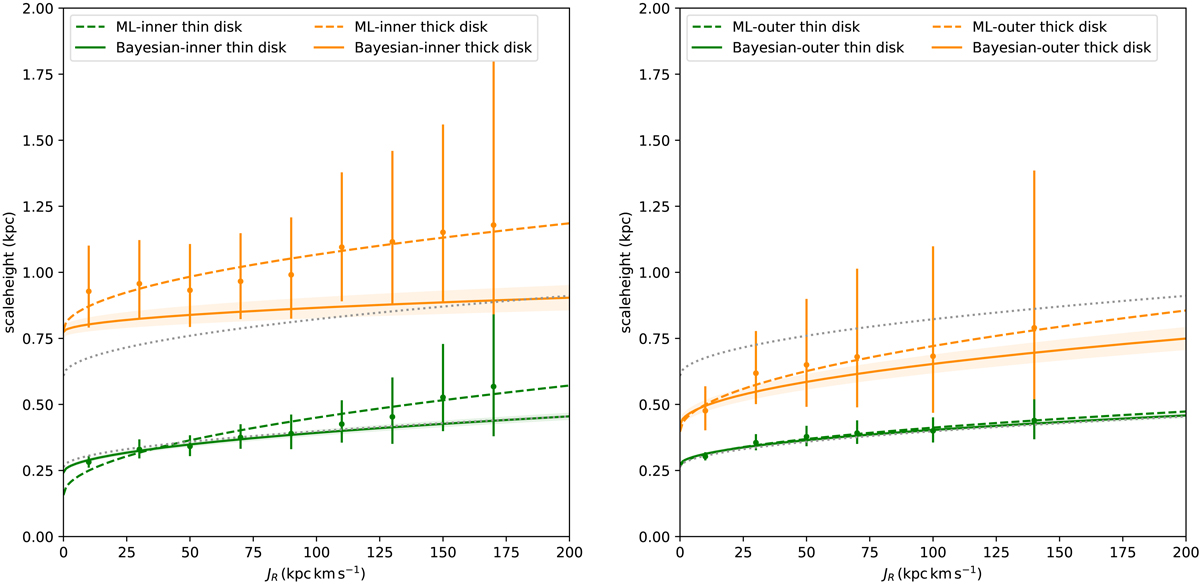
Relationships between radial action JR and scale height h in the inner (left panel) and outer (right panel) disk. The relationships are fitted with a function of ![]() , as done in Fig. 5. The best-fit relationships estimated from Bayesian inference for the overall thin and thick disk star samples in Fig. 5 are also plotted for comparison as dotted gray lines.
, as done in Fig. 5. The best-fit relationships estimated from Bayesian inference for the overall thin and thick disk star samples in Fig. 5 are also plotted for comparison as dotted gray lines.
Current usage metrics show cumulative count of Article Views (full-text article views including HTML views, PDF and ePub downloads, according to the available data) and Abstracts Views on Vision4Press platform.
Data correspond to usage on the plateform after 2015. The current usage metrics is available 48-96 hours after online publication and is updated daily on week days.
Initial download of the metrics may take a while.