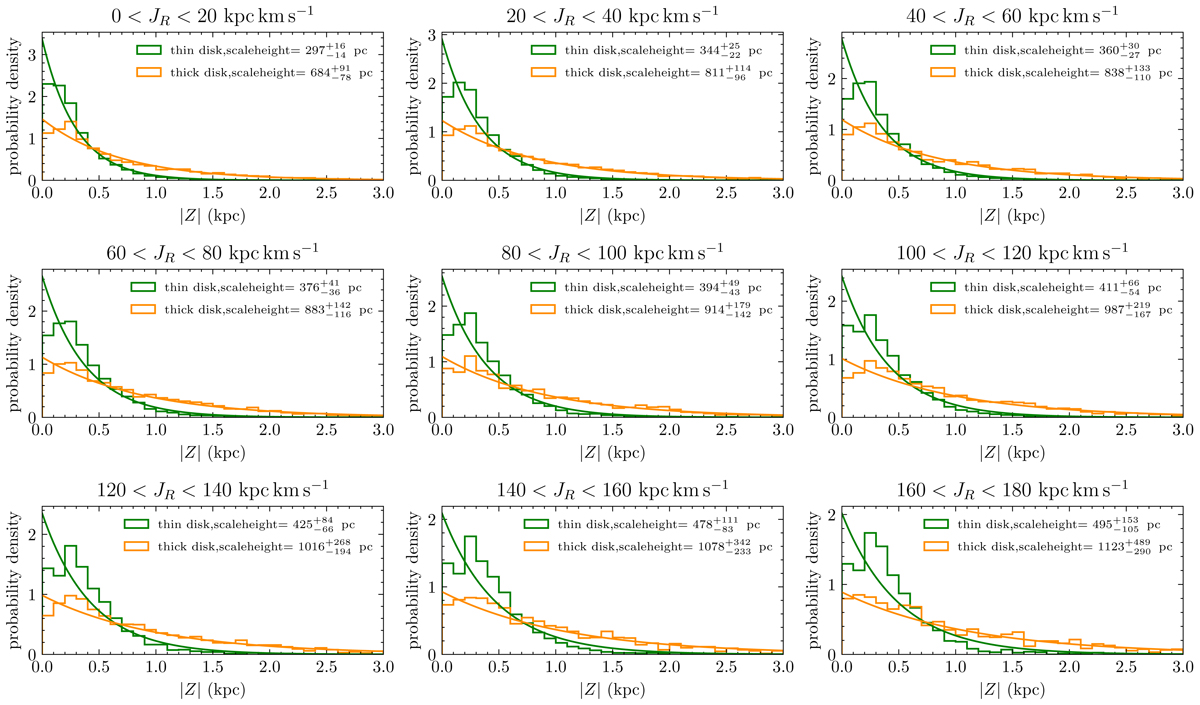
Fig. 4.
Download original image
Vertical distributions coupled with their best-fit models of the star samples in different radial action ranges. The vertical distributions have been fitted with a simple exponential function with a scale height. The best-fit scale heights are listed in the legends. In all panels, the solid lines are drawn from the best-fit results.
Current usage metrics show cumulative count of Article Views (full-text article views including HTML views, PDF and ePub downloads, according to the available data) and Abstracts Views on Vision4Press platform.
Data correspond to usage on the plateform after 2015. The current usage metrics is available 48-96 hours after online publication and is updated daily on week days.
Initial download of the metrics may take a while.