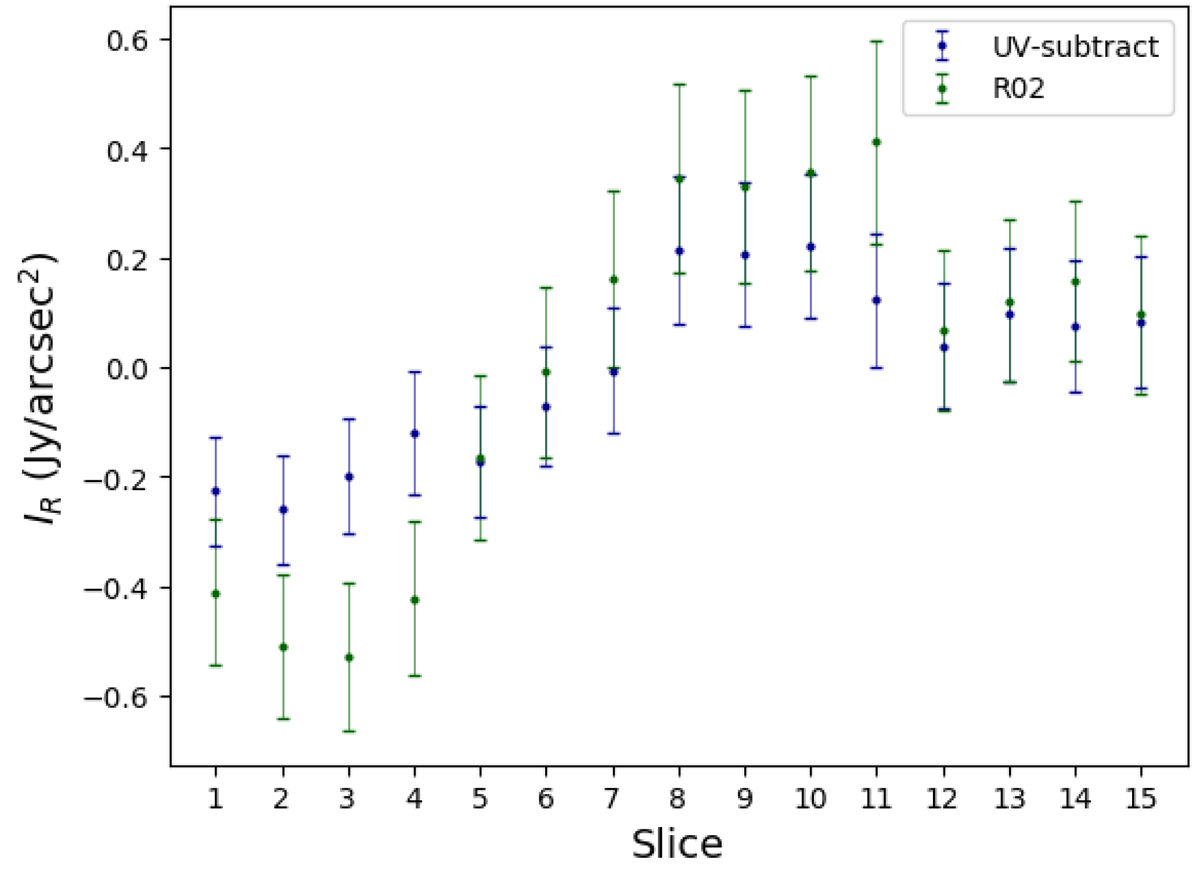
Fig. 8.
Download original image
Mean radio surface brightness from the slices from the left panel in Fig. 6, manually masked for bright AGNs, for the R02 filter and uv-subtracted radio data. The slice numbers correspond to the order of the slices in the direction from the arrow. The R02 filter removes more from the diffuse emission than the uv-subtract. Error bars include the statistic and systematic uncertainties.
Current usage metrics show cumulative count of Article Views (full-text article views including HTML views, PDF and ePub downloads, according to the available data) and Abstracts Views on Vision4Press platform.
Data correspond to usage on the plateform after 2015. The current usage metrics is available 48-96 hours after online publication and is updated daily on week days.
Initial download of the metrics may take a while.