| Issue |
A&A
Volume 691, November 2024
|
|
|---|---|---|
| Article Number | A99 | |
| Number of page(s) | 11 | |
| Section | Cosmology (including clusters of galaxies) | |
| DOI | https://doi.org/10.1051/0004-6361/202451529 | |
| Published online | 05 November 2024 | |
Mind the gap between A2061 and A2067: Unveiling new diffuse, large-scale radio emission
1
Dipartimento di Fisica e Astronomia, Università degli Studi di Bologna,
via P. Gobetti 93/2,
40129
Bologna,
Italy
2
INAF – Istituto di Radioastronomia,
via P. Gobetti 101,
40129
Bologna,
Italy
3
Department of Physics and Electronics, Rhodes University,
PO Box 94,
Makhanda
6140,
South Africa
4
South African Radio Astronomy Observatory (SARAO),
Black River Park, 2 Fir Street, Observatory,
Cape Town
7925,
South Africa
5
INAF – IASF Milano,
Via A. Corti 12,
20133
Milano,
Italy
6
DiSAT, Università degli Studi dell’Insubria,
Via Valleggio 11,
22100
Como,
Italy
7
Hamburger Sternwarte, Universitat Hamburg,
Gojenbergsweg 112,
21029
Hamburg,
Germany
8
Leiden Observatory, Leiden University,
PO Box 9513,
2300 RA
Leiden,
The Netherlands
9
International centre for Quantum-field Measurement Systems for Studies of the Universe and Particles (QUP), The High Energy Accelerator Research Organization (KEK),
1-1 Oho, Tsukuba,
Ibaraki
305-0801,
Japan
10
SRON Netherlands Institute for Space Research,
Utrecht,
The Netherlands
11
Thuringer Landessternwarte,
Sternwarte 5,
07778
Tautenburg,
Germany
12
INAF – Osservatorio di Astrofisica e Scienza dello Spazio (OAS),
via Gobetti 101,
40129
Bologna,
Italy
★ Corresponding author; This email address is being protected from spambots. You need JavaScript enabled to view it.
Received:
16
July
2024
Accepted:
20
September
2024
Abstract
Aims. The clusters Abell 2061 and Abell 2067 in the Corona Borealis supercluster have been studied at different radio frequencies and are both known to host diffuse radio emission. The aim of this work is to investigate the radio emission between them, whose presence is suggested by low-resolution observations.
Methods. We analysed deep LOw Frequency ARray (LOFAR) High Band Antenna (HBA) observations at 144 MHz to follow up on the possible inter-cluster filament suggested by previous 1.4 GHz observations. We investigated the radial profiles and the point-to-point surface-brightness correlation of the emission in Abell 2061 with radio and X-ray observations to describe the nature of the diffuse emission.
Results. We report the detection of diffuse radio emission on an 800 kpc scale, which is more extended than previously known, reaching beyond the radio halo in Abell 2061 towards Abell 2067 and over the separation outside the two clusters R500 radii. We confirm the presence of a radio halo in A2061, while we do not find evidence of diffuse emission in Abell 2067. The surface-brightness profile from the centre of A2061 shows an excess of emission with respect to the azimuthally averaged radio halo profile and X-ray background. We explored three different dynamical scenarios to explain the nature of the diffuse emission. Additionally, we analysed a trail of emission of ∼760 kpc between the radio halo and radio relic in Abell 2061.
Conclusions. This dynamically interacting, pre-merger system closely resembles the two other cluster pairs where radio bridges connecting the radio halos on Megaparsecs scales have been detected. The diffuse emission extends beyond each cluster R500 radius, but in this unique case the absence of the radio halo in Abell 2067 is likely the reason for the observed ‘gap’ between the two systems. However, the point-to-point correlation results are challenging to explain. The classification of the emission remains unclear, and detailed spectral analysis and further X-ray observations are required to understand the origin of the diffuse emission.
Key words: galaxies: clusters: general / large-scale structure of Universe
© The Authors 2024
 Open Access article, published by EDP Sciences, under the terms of the Creative Commons Attribution License (https://creativecommons.org/licenses/by/4.0), which permits unrestricted use, distribution, and reproduction in any medium, provided the original work is properly cited.
This article is published in open access under the Subscribe to Open model. This email address is being protected from spambots. You need JavaScript enabled to view it. to support open access publication.
1 Introduction
Diffuse radio synchrotron emission is observed in merging galaxy clusters, tracing the presence of magnetic field and relativistic particles on scales of hundred to thousands of kiloparsecs. Cluster merger events are among the most energetic in the Universe, and a fraction of this energy is channelled into the re-acceleration of particles that produces diffuse radio emission of various morphologies. Radio halos are typically observed to be unpolarised and at the centre of galaxy cluster, extending from hundreds of kpc to Mpc scales (van Weeren et al. 2019). Their morphologies can range from round to elongated, and they present smooth or clumpy emission (Bonafede et al. 2012; Venturi et al. 2013). The radio-halo luminosity is usually well correlated with X-ray luminosity and temperature of the host cluster (Cassano et al. 2010, 2023). Unlike halos, radio relics are found at the peripheries of merging clusters, usually extending up to Mpc scales with an elongated morphology. Relics are often observed to be highly polarised and to trace the axis of the accretion process, where the resulting shocks re-accelerate particles and amplify the magnetic fields. Recently, low-frequency radio observations revealed the presence of diffuse emission on ever larger scales, tracing the regions connecting interacting galaxy clusters (Govoni et al. 2019; Botteon et al. 2018, 2020; Hoeft et al. 2021; Pignataro et al. 2024a). Other types of extended filamentary emission is detected between radio halos and relics (Pasini et al. 2022; Bonafede et al. 2021) and between clusters and groups (Bonafede et al. 2021; Venturi et al. 2022). These observations suggest that magnetic fields and relativistic particles are a component of the large-scale structure and that the process of major merger can produce a favourable environment, where turbulence and shocks trigger particle re-acceleration on very large scales. Therefore, the ideal conditions for generating diffuse radio emission on very large scales are expected to be particularly favourable in superclusters of galaxies; these are the largest coherent structures in the Universe, where rich clusters in their cores may be dynamically active (Einasto et al. 2021). The Corona Borealis supercluster (CSC) is the most prominent and dense supercluster in the Northern Sky, at an average redshift of z ~ 0.07. It is composed of ten galaxy clusters, including Abell 2056, Abell 2061, Abell 2065, Abell 2067, and Abell 2089, which comprise a gravitationally bound supercluster core that is collapsing (Pearson et al. 2014). The dominant cluster of the CSC is Abell 2065 (Markevitch et al. 1999), and recent studies have found Abell 2061–Abell 2067 (hereafter, A2061 and A2067) to be a gravitationally bound pair in a pre-merger state (Marini et al. 2004; Batiste & Batuski 2013; Pearson et al. 2014). This system closely resembles the cluster pairs A399-A401 and A1758N- S, where radio bridges have been observed at low frequency (Govoni et al. 2019; Botteon et al. 2020; de Jong et al. 2022; Pignataro et al. 2024a).
The two cluster centres are separated by a projected distance of ~2.5 Mpc (Rines & Diaferio 2006), and A2061 is the main cluster of this pair. It has a  Mpc radius (Planck Collaboration XXII 2016) and an X-ray luminosity of
  erg s−1 (Ebeling et al. 1998). Its X-ray-disturbed morphology suggests it is undergoing mergers with the surrounding, smaller halos (Marini et al. 2004). In particular, it contains an X-ray extension (dubbed plume in Marini et al. 2004) visible with ROSAT-Position Sensitive Proportional Counters (PSPC) extending towards A2067 in the north-east (NE) direction. However, since the interaction between the two clusters appears to be in early stages (Marini et al. 2004), the plume is likely related to a third substructure that is currently interacting or has already interacted in the past with A2061. Marini et al. (2004) suggested the interaction of the two clusters could be an indication of the existence of an underlying filament, along which the group merged into A2061. A2067 is, in turn, a relatively low X-ray luminosity cluster (
 erg s−1) that also shows an elongated morphology in the ROSAT All Sky-Survey (RASS) image. The X-ray peak coordinates differ by ~8' from the ACO Abell et al. (1989) centre, and the measured X-ray radius
  is ~0.7 Mpc (Piffaretti et al. 2011). The quantities related to the two clusters are summarised in Table 1.
Radio observations of this system have been carried out at different frequencies to investigate evidence of diffuse emission. For A2061, Kempner & Sarazin (2001) and Rudnick & Lemmerman (2009) reported a possible relic, which was detected at 1.4 GHz with the NRAO VLA Sky Survey (NVSS, Condon et al. 1998) and 327 MHz with the Westerbork Northern Sky Survey (WENSS, Rengelink et al. 1997). The presence of the relic is then confirmed with WSRT observations at 1.38 and 1.7 GHz, which results in a α = −1.03 ± 0.09 spectral index (van Weeren et al. 2011). Additionally, Rudnick & Lemmerman (2009) reported a tentatively detected radio halo at 327 MHz at the centre of the cluster. The radio halo is also tentatively detected by GBT-NVSS observations at 1.4 GHz reported in Farnsworth et al. (2013), where they derive a preliminary spectral index for the halo of α = −1.8 ± 0.3 between 0.3 and 1.4 GHz. In the GBT-NVSS and WENSS images, the radio halo appears elongated, displaying an extension towards the NE, which is likely associated with the X-ray plume. Farnsworth et al. (2013) also reported the presence of a possible bridge of emission, joining the radio halo and the relic, and a possible inter-cluster filament between A2061 and A2067, seen at a limited statistical significance in images with 11′ angular resolution at 1.4 GHz. However, the very poor resolution of GBT does not allow us to draw a firm conclusion on this classification. A2067 is also observed with GBT-NVSS at 1.4 GHz, where they detect a marginally resolved emission ~12′ north of the X-ray peak. However, there appears to be a blending of unresolved emission, and they classified this emission as a possible relic (Farnsworth et al. 2013). Recently, A2061 was observed with the LOFAR Two-Metre Sky Survey (LoTSS, Shimwell et al. 2017, 2019, 2022) and was studied as part of the Planck (Planck Collaboration XXII 2016) cluster sample covered by the LoTSS-DR2 (Botteon et al. 2022). They were able to confirm the presence of the radio halo, the radio relic, and the trail between them at 144 MHz.
In this work, we present 16 hours new LOFAR High Band Antenna (HBA) observations at 144 MHz of the A2061–A2067 system, following the LoTSS observations that already suggested the presence of a bridge of emission to the region of the X-ray plume. Here, we report the discovery of further extended diffuse emission between the two clusters (see Fig. 1) that might be related to the filament connecting the two clusters (Einasto et al. 2021). This paper is organized as follows: in Sect. 2 we describe the radio and X-ray data reduction; in Sect. 3.1 we compare radio and X-ray radial profiles in the direction of the extended radio feature; in Sect. 3.2 we investigate the radio and X-ray correlation for A2061; finally, in Sect. 3.3 we discuss the possible dynamical scenarios to originate the diffuse emission and its classification. Throughout this work, we assumed a ΛCDM cosmology, with H0 = 70 km s−1 Mpc−1, Ωm = 0.3, and ΩΛ = 0.7. With these assumptions, at the average distance of the A2061-A2067 system (z ~ 0.076), 1′ = 85 kpc and the luminosity distance is DL = 345 Mpc.
Coordinates, redshift, radius, and mass of the two clusters analysed in this work.
2 Observations and data reduction
2.1 Radio data
The two clusters were observed as part of a pointing on the northern part of CSC; therefore, the system is ~35′ from the pointing centre. We observed the CSC with LOFAR HBA using the same setup as LoTSS, which is in the 120–168 MHz frequency range, divided into 244 sub-bands of 64 channels each. The total observing time for CSC North was 32 hours (proposal code: LC014_18, PI: Vazza); however, only 16 hours are not affected by severe ionospheric conditions and used for this analysis. This observation was carried out in co-observing mode with the LoTSS and the data reduction follows the LoTSS reduction scheme. We summarize the main steps below, and we refer the reader to Shimwell et al. (2022) and Tasse et al. (2021) for further details. The pipeline performs direction-independent and direction-dependent calibration and imaging of the full field of view on CSC North using PREFACTOR (van Weeren et al. 2016b; Mechev et al. 2018; de Gasperin et al. 2019), KILLMS (Tasse 2014; Smirnov & Tasse 2015), and DDFACET (Tasse et al. 2018). To allow flexible re-imaging limited to the target of interest, we then performed the so-called extraction procedure (van Weeren et al. 2021), where the direction-dependent solutions are used to subtract all sources outside a box with a ratio of approximately 0.8o around the target. As a final step, additional cycles of phase self-calibration in the extracted field are performed, followed by several rounds of amplitude calibration using a longer solution interval. After this last refinement, we used the final calibrated, extracted visibilities of the target to image at different resolutions with WSClean v3.1 (Offringa et al. 2014).
Throughout the paper, we report the measured flux densities Sν of radio sources with uncertainties estimated as
 (1)
(1)
where f = 0.1 is the absolute flux-scale uncertainty (Hardcastle et al. 2021; Shimwell et al. 2022), Nb the number of beams covering the source, and σrms the rms noise sensitivity of the map. The radio power Pν is calculated from the flux density Sν as (Condon 1988)
 (2)
(2)
where DL is the luminosity distance, and the k correction is adjusted for the redshift z of the source with spectral index α, defined by Sv ∝ ν−α.
We produced a final primary-beam-corrected image at the central frequency of 144 MHz, at a resolution of 8″ × 5″ (PA 90o) with an rms noise of σrms = 80 µJy beam−1, which is shown in Fig. 2 (left panel). From the high-resolution image, it is already possible to see the diffuse emission from the radio halo and relic in A2061 and a hint of emission connecting them. Since we are particularly interested in the diffuse emission in the field, we produced a high-resolution image excluding baselines shorter than ∽760λ (i.e. emission on scales more extended than ∽4.5′ ≃ 380 kpc) to recover only the compact sources and then subtracted their components from the visibilities. Finally, a 80″ resolution, source-subtracted image of the target field with an rms noise of σrms = 0.4 mJy beam−1 is shown in Fig. 2 (right panel). In the A2067 field, no diffuse emission is revealed other than residuals from extended sources, such as the tailed active galactic nuclei (AGN) visible in Fig. 2 (left panel). In the A2061 field, the low-resolution image shows the presence of the radio halo and relic in A2061, detected at high significance. Additionally, we detect the trail of emission connecting the radio halo and relic, and reveal filamentary diffuse emission extending over ~800 kpc from the radio halo in A2061 towards A2067, which we label as ‘NE extension’ in Figs. 1 and 2.
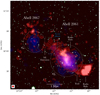 |
Fig. 1 Composite image of galaxy cluster system Abell 2061–Abell 2067 in the Corona Borealis supercluster. The radio emission from LOFAR observations at 144 MHz and 80″ resolution is shown in red. The diffuse emission sources presented in this work are highlighted in white. The X- ray ROSAT emission is shown in blue, overlaid on the optical Pan-STARRS1 image. |
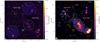 |
Fig. 2 Radio maps of A2061-A2067. Left panel: image of A2061-A2067 at a resolution of 8″ × 5″ (PA 90°). The imaging was done adopting a Briggs weighting scheme (Briggs 1995) with robust=−0.5, and the resulting rms noise is σrms = 80 µJy beam−1. The radio halo (white dashed circle) and the radio relic (magenta dashed circle) are already visible at high resolution and without compact source subtraction. The most interesting radio sources in the field are highlighted in the circles. Right panel: image of A2061-A2067 at a resolution of 80″ after subtraction of compact sources. The imaging was made by adopting a Briggs weighting scheme with robust=−0.5 and applying a Gaussian uv taper of 70″. We show the 2, 3, 5, 10 − σrms contour levels in white and the 20, 30 − σrms contours level in black (σrms = 0.4 mJy beam−1.) The −2σrms contours are shown by dashed red lines. Additionally to the radio halo and relic in A2061, we now detect diffuse emission in the NE extension (green dashed region) and trail (cyan dashed region). |
2.2 X-ray data
The galaxy cluster A2061 has been observed with XMM-Newton (Obs. id: 0721740101) and it also belongs to the Cluster HEritage project with XMM-Newton – Mass Assembly and Thermodynamics at the Endpoint of structure formation (CHEX-MATE, CHEX-MATE Collaboration 2021) project sample. For the aim of this study, it is useful to compare the properties of the thermal and non-thermal emission in A2061.
The X-ray data on A2061 were processed using the CHEX- MATE pipeline as detailed by Bartalucci et al. (2023) and Rossetti et al. (2024). Below, we summarize the main steps involved.
Observations were conducted with the European Photon Imaging Camera (EPIC, a set of three X-ray CCD cameras, Turner et al. 2001; Strüder et al. 2001) and the datasets were then reprocessed using the Extended-Science Analysis System (E-SAS, Snowden et al. 2008). Flare events were filtered out by excluding time intervals with count rates exceeding 3σ above the mean count rate. Point sources were also excluded from the analysis based on the methodology presented in Ghirardini et al. (2019) and Bartalucci et al. (2023). The scientific images of the cluster are generated from each camera’s photon-count images in the [0.7–1.2] keV band, which optimizes the signal- to-noise ratio for cluster thermal emission (Ettori et al. 2010). Exposure and background maps are also created. The X-ray background consists of a sky component (i.e. the local Galactic emission and the Cosmic X-ray background) and an instrumental component introduced by the interaction between high-energy particles and the detector. Following Ghirardini et al. (2019) and Bartalucci et al. (2023), the instrumental background component was then mitigated and the sky component described by a constant profile component. Finally, to maximise statistics, the images, exposure maps, and background maps from the three cameras were merged (Bartalucci et al. 2023) and used for the following analysis.
3 Results and discussion
In the next sections, we present and discuss our analysis of the radio and X-ray data primarily concerning the NE extension of diffuse emission discovered in A2061. We also discuss the several diffuse sources found in this cluster, the discovery of which has already been reported in dedicated papers (see Sect. 1). We present the properties of these sources and add complementary information that we obtained with our new data.
3.1 Radial profiles
3.1.1 Radio
The most interesting source of diffuse emission in A2061 is the filamentary emission that is connected to the radio halo and extends in the direction of A2067, creating a bridge of emission between the two R500 (Fig. 1). In order to investigate the nature of the emission from the radio halo and the extended feature, we computed a radial profile using the radio map from our 144 MHz observations. The surface-brightness profile of the radio halo in A2061 was already investigated in Botteon et al. (2022) as part of the Planck (PSZ2 catalogue, Planck Collaboration XXII 2016) cluster sample covered by the LoTSS-DR2. The radio profile was studied with the use of the Halo-Flux Density CAlculator (HALO-FDCA1 ; Boxelaar et al. 2021). This code fits the twodimensional brightness profile using Bayesian inference. The Markov chain Monte Carlo (MCMC) algorithm is performed to determine the best-fit parameters and associated uncertainties. We repeat the analysis on A2061 on our 80′′ radio map with additional masking of the residuals from poorly subtracted bright diffuse sources, which differs from the masking performed in Botteon et al. (2022). The extension emission is fitted as part of the radio halo. Typically, radio halos’ brightness profiles are fitted by an exponential law of the following form:
 (3)
(3)
where I0 is the central radio surface brightness (Murgia et al. 2009), G(r) is a function that describes the model morphology (i.e. circular, elliptical, or skewed), and r is the positional vector. The radio halo in A2061 was fitted with a rotated ellipse morphology that allows for a rotation ϕ with respect to the coordinate system centred in (x0, y0) (Boxelaar et al. 2021). Therefore, G(r) becomes
![Mathematical equation: $G({\bf{r}}) = {\left[ {{{\left( {{{{X_\phi }({\bf{r}})} \over {{r_x}}}} \right)}^2} + {{\left( {{{{Y_\phi }({\bf{r}})} \over {{r_y}}}} \right)}^2}} \right]^{0.5}},$](/articles/aa/full_html/2024/11/aa51529-24/aa51529-24-eq8.png) (4)
(4)
where Xϕ and Yϕ represent the coordinate transformation and rx and ry represent the two e-folding radii in the direction of the major and minor axes. This model has six free parameters: I0 , x0 , y0 , rx , ry , and ϕ. The best-fit parameters and their uncertainties are reported in Table 2. The residuals from the fitting procedure are shown in Appendix A. In Fig. 3, we show the radial profile of the halo brightness at 144 MHz. We have computed the mean of the radio surface brightness and its error within an elliptical annuli with a width of ∼2.3′ that covers the NE extension. The masked pixels are excluded when calculating the surface brightness. We compare the measured data with the analytical profile evaluated for the same annuli, which are computed with the model parameters. The best-fit parameters are Monte Carlo resampled 500 times inside their uncertainties, and the final analytical mean radio brightness and its standard deviation are shown in Fig. 3 (left panels). The data and the model profile show overall good agreement, with small deviations at small radii. The discrepancy between real and model data when fitting the radio halo with a single exponential profile were already noted in recent works (see e.g. Cuciti et al. 2021; Botteon et al. 2022).
For disturbed merging clusters, as is the case of A2061, Botteon et al. (2023) showed that these deviations are likely related to the presence of substructure in the brightness distribution of the real halo, especially in the central regions. We note that after ∼2.5rx, that is, over the NE extension, the data points show a systematic excess of emission with respect to the radio halo profile. This result puts the origin of the extended emission into question. The measured excess might indicate that the emission we observe in the NE extension has a different origin to the radio halo and could be classified as a radio bridge. We investigate these possibilities using X-ray data.
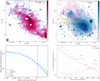 |
Fig. 3 Radio and X-ray surface-brightness profile of A2061. Top left panel: 80′′ radio map at 144 MHz with residual sources masked is shown via a pink colour scale. We show the 2, 3, 5, 10-σrms contour levels in purple and the 20, 30-σrms contour level in white. The mean radio brightness is computed inside the blue region. The width of the elliptical annuli along the major axis is ∼2 times the beam size (80′′). The 2.5rx area is delimited by the dashed green line. Bottom left panel: comparison between the average surface brightness measured in each blue bin (the magenta data points, with 1σ uncertainties) with the model profile from the best-fit analysis performed with HALO-FDCA (solid cyan line, with 2σ uncertainties). Beyond ∼2.5rx (dashed green line), the average surface brightness is persistently higher than the best-fit radio-halo model due to the NE extension. Top right panel: smoothed XMM-Newton X-ray map is shown in blue colour scale. The contour levels from the radio emission are overlaid in purple, and the X-ray point sources (green circles) are masked. The X-ray surface brightness is computed inside the magenta slices, centred on the radio halo and covering the NE extension. We compare this sector with the yellow slice, in a direction offset from the extension. The width of the circular sectors is one beam size (80′′). Bottom right panel: the two profiles extracted from the different sectors are shown in magenta and yellow points. In the NE direction, we note a bump in the profile associated with the X-ray plume that is followed by an excess at larger radii. On the contrary, there is no evidence of excess at the same distances from the centre in the yellow sector. The background level in each sector is shown with magenta and yellow dashed lines. |
Halo-FDCA best-fit parameters.
3.1.2 X-ray
We performed a similar study of the X-ray profile of A2061 with XMM-Newton data to check whether there is an excess emission corresponding to the radio excess. We extracted the X-ray profile following the radio emission, starting from the same centre as the radio halo and covering the X-ray plume. The XMM-Newton observation field of view extends beyond the X-ray plume, allowing a comparison between the radio emission and the X-ray in the NE extension. We also extracted the X-ray profile in a different sector that is slightly offset from the plume and reaches the same distance from the centre. The extracted X-ray band’s radial profile is shown in Fig. 3 (right panels). We note how the profile extracted in the NE extension shows an evident ‘bump’ at a distance of ∼11′ from the halo centre, which corresponds to the emission from of the X-ray plume. Interestingly, beyond the X- ray plume the profile shows an excess of emission with respect to the background level at larger radii. Compared with another sector, we find that the X-ray profile is monotonically decreasing in an offset direction from the NE extension, and, at the same radii, it is consistent with the background level. In the scenario where the X-ray plume is residual thermal gas left behind by an infalling group (Marini et al. 2004), the radial profile shows that the excess is likely not connected with this gas, since we see a clear drop of the emission brightness between the plume and the extension. This excess might instead indicate the presence of thermal filamentary gas; however, the limited field of view of the X-ray image does not allow us to investigate the properties of the emission at larger distances from the centre. An additional XMM-Newton pointing covering the separation between the two clusters will help draw a definitive conclusion on the nature of this trend. The infalling group scenario is further discussed in Sect. 3.3.
3.2 Point-to-point analysis
We are interested in studying the link between the diffuse radio emission and X-ray emission of the thermal plasma, which are found to be spatially aligned at the centres of galaxy clusters. Past works have shown that this link can be described by a correlation of the form  (e.g. Govoni et al. 2001; Rajpurohit et al. 2021a). The slope of this correlation between the X-ray and the radio surface brightness of diffuse emission in galaxy clusters provides important information on the acceleration mechanism at work (for a review, see Feretti et al. 2012; Brunetti & Jones 2014). Moreover, the spatial distribution of the correlation can reveal the presence of different environments and emission powered by different physical mechanism, as shown in Bonafede et al. (2022) for the radio halo in the Coma cluster, in Rajpurohit et al. (2023) for Abell 2256, and in Biava et al. (2021) for the mini-halo in RXC J1720+2638. Several studies have investigated disturbed galaxy clusters, where the correlation generally results to be sub-linear (see e.g. Hoang et al. 2019; Bonafede et al. 2022; Riseley et al. 2022, 2024), implying a stronger decline of the X- ray emission than the non-thermal surface brightness. In the case of A2061, we can extend the investigation of the correlation to the NE extension.
In order to investigate the correlation, we used the 80′′ resolution, compact-source-subtracted radio maps at 144 MHz, and the point-source-subtracted XMM-Newton image. We covered the entire XMM-Newton field of view of A2061 with a grid of square boxes of 80″, therefore covering the cluster and the NE extension. We only considered the boxes where the radio surface brightness is above the 2σrms level. For comparison, we also performed the analysis over the NE extension area only. The results for the IR/IX correlation are shown in Fig. 4.
In the case of the total system, the two components appear mildly correlated, with Spearman (rS) and Pearson (rP) coefficients of rS = 0.73 and rP = 0.71, respectively. Considering the NE extension region, where we only have 19 points, we do not find evidence of correlation, with rS = rP = −0.06. We can quantify the slope of the correlation in the entire system fitting a power-law relation in log-log space in the following form:
 (5)
(5)
To perform the fit, we use the Bayesian regression MCMC method implemented in Linmix (Kelly 2007) as recently done in, for example, Riseley et al. (2024, 2022); Rajpurohit et al. (2021a,b). The fitting procedure yields a best-fit slope of b = 0.51 ± 0.05, showing an overall sub-linear correlation. If we remove the points over the NE extension from the total system, we find very similar correlation and best fit, with a slope of b = 0.54 ± 0.05. The connection between thermal and nonthermal emission over the NE extension area remains unclear. It is possible that a better X-ray coverage of the inter-cluster region could reveal a mild correlation. We discuss these findings in relation to three different scenarios to explain the NE extension emission.
3.3 The radio halo and the NE extension
The LOFAR observations presented in this work are able to detect the giant radio halo, the radio relic, and the trail in A2061 (as recently confirmed in Botteon et al. 2022), with the additional detection of large-scale diffuse emission extending towards A2067. In Farnsworth et al. (2013), the diffuse emission in A2067 offset from the X-ray peak was observed and tentatively classified as a radio relic that is connected to the radio halo in A2061 with a filamentary feature. The elongation is also present in Botteon et al. (2022) images. Our new LOFAR observations confirm the presence of such emission, extending for ∼800 kpc between the radio halo in A2061 and A2067, of which an additional ∼350 kpc component in the NE direction is unveiled with respect to the previous LoTSS observations (Botteon et al. 2022). However, this emission does not fully connect the two galaxy clusters. The low resolution (570″ × 560″) and limited sensitivity of the GBT-NVSS observations most likely resulted in a blending of the tails of unresolved radio sources present in A2067 (that were not included in the NVSS subtraction process), which was interpreted as a radio relic. We were able to resolve the sources, and the residual tails of the AGN are also shown in our maps, but there is no evidence of other extended emission in this cluster. Even when re-convolving our images to the GBT resolution, the filamentary emission still did not connect the two galaxy clusters. There are few cases where features of diffuse emission of an uncertain nature are detected between pre-merging galaxy clusters that do not show the presence of radio halos (Gu et al. 2019; Kurahara et al. 2023).
In these cases, the emission either results from present radio sources revived by the merger activity (Gu et al. 2019) or a radio relic of peculiar morphology (Kurahara et al. 2023; Omiya et al. 2023). In both these cases, the lack of radio halos in both clusters aids classification, as there is no mixed diffuse emission. In the NE extension, the emission is connected to the radio halo in A2061, and with our analysis we confidently exclude the notion that the emission is related to a phoenix or the blending of AGN in the field.
Here, we discuss three possible scenarios to explain the NE extension emission (see Fig. 5).
Infalling group scenario: Initially, the extension towards the NE was interpreted as possibly being related to the X-ray plume. According to Marini et al. (2004), the plume can be attributed to a group of galaxies arriving from the NE and infalling in A2061. As a consequence of the impact, the galaxies of the group precede its intracluster medium and are observed as an overdensity in the bi-dimensional galaxy distribution (see Fig. 6, also Marini et al. 2004). In this case, the NE extension could be classified as a radio bridge.
Slingshot scenario: A slingshot X-ray tail can be formed as a (secondary) sub-halo moves away from the (primary) cluster centre towards the apocenter of its orbit (Poole et al. 2006; Markevitch & Vikhlinin 2007; Sheardown et al. 2019). In this scenario, a galaxy group might have already completed a first passage, and it is now approaching a second infall from the NE. Therefore, in this case the X-ray plume can be explained as the slingshot gas tail of the re-entering group, and the NE extension is an elongation of the radio halo caused by the passage of the group. There are only a few examples of observational features in galaxy clusters that can be explained by the slingshot effect; for example, in Abell 168 (Hallman & Markevitch 2004), in the Fornax Cluster (Sheardown et al. 2018), and in the Coma Cluster (Lyskova et al. 2019; Lal et al. 2022). In this scenario, simulations presented in Sheardown et al. (2019) predict the possible presence of a shock at large distances behind the secondary tail, and/or the presence of a cold front in the primary cluster, attributed to the sloshing in the core caused by the passage of the secondary (Akamatsu et al., in prep.).
Exiting group scenario: in this case, a sub-halo might be moving from the south west (SW), crossing the cluster and causing the elongated shape in the radio halo as it exits on the opposite side (see e.g. Donnert et al. 2013; Beduzzi et al. 2024). From simulation results, in this scenario the extended radio emission from the radio halo would be, at best, completely co-spatial with the X-ray plume.
Our observations, compared with X-ray maps, show that the radio emission is far more extended towards A2067, beyond the X-ray plume, as seen both by ROSAT (Fig. 1) and XMM-Newton (Fig. 3, right panels), disfavouring the exiting group scenario. The radio surface-brightness profiles presented in Sect. 3.1.1 show that the surface brightness measured outside 2.5 efolding radii in the NE direction significantly deviates from the analytical radio halo profile (Fig. 3, left panels). While some deviations between model and real data in disturbed radio halos are expected (Botteon et al. 2023), the excess appears to be systematic at large radii. Moreover, the X-ray radial profile in the same direction (Sect. 3.1.2) shows a similar trend beyond the X-ray plume location, where a significant excess over the background is detected (Fig. 3, right panels). Theoretically, in the early stages of a merger we can expect enhancements of the gas density between approaching clusters, which in turn could be detected as an X-ray excess (Machado et al. 2024).
Since this source extends along the merger axis, it may be related to the underlying filament connecting the two galaxy clusters. Numerical simulations indicate that even during the early phases of cluster interactions, weak shocks (Mach ∼2–3, e.g., Ha et al. 2018; Vazza et al. 2019) and transonic turbulence (Iapichino et al. 2011; Beduzzi et al. 2024) can be triggered in the inter-cluster medium following the compression and accretion of smaller sub-clusters. Therefore, the filament volume can undergo a significant level of Fermi II re-acceleration by solenoidal turbulence motions injected in the early stages of the merger process, provided that the medium hosts a pool of mildly relativistic electrons (γ ∽ 103), which is supported by recent simulations (Beduzzi et al. 2023). We have observational evidence of radio bridges between galaxy clusters in the early stages of merger (Botteon et al. 2018, 2020; Govoni et al. 2019; de Jong et al. 2022; Pignataro et al. 2024a,b), where the dynamics of the collapse drives transonic turbulence in the compressed inter-cluster gas (Brunetti & Vazza 2020; Nishiwaki et al. 2024). The weak shocks in the bridge can also compress turbulent, re-accelerated electrons and magnetic fields, leading to increased radio brightness in that region. The same acceleration processes could be at play in this case, with the additional amplification of turbulence brought by the merger of groups (Brunetti & Vazza 2020), as we would expect in the infalling group scenario.
The case in which one of the two clusters does not host a radio halo, opens up a question on the definition of radio bridge. In the two most spectacular cases of radio bridges (Govoni et al. 2019; Botteon et al. 2020), the bridge fully connects the two radio halos at the centre of the galaxy clusters. In this scenario, the lack of a radio halo in A2067 is likely the reason we observe an emission ‘gap’ between the two clusters. Nonetheless, these system properties, such as the projected separation and the average emissivity of the diffuse emission, closely resemble the other two discovered bridges, as summarised in Table 3. In this regard, the emerging population of low-surface-brightness bridges might represent a more ubiquitous phenomenon in merging clusters of galaxies, compared to the appearance of classical radio halos in their clusters. In fact, radio halos additionally require the presence of mergers within clusters (Brunetti & Lazarian 2007; Brunetti et al. 2009; van Weeren et al. 2019), on top of the large-scale accretion motions that instead may power the radio emission in bridges (Brunetti & Vazza 2020).
However, the radio/X-ray correlation investigated in Sect. 3.2 does not provide conclusive evidence. The similar scaling found including and excluding the NE extension emission seems to indicate a trend where the emission traces an extension of the radio halo, which could be the case in the slingshot scenario. In contrast, in the scenario of filamentary gas, we would expect a level of X-ray/radio correlation, as it has been found for the radio bridges in A399-A401 (de Jong et al. 2022) and A1758N- S (Botteon et al. 2020). In both cases, the X-ray observations allowed a full coverage of the bridge, and they are able to create a more extended grid in the bridge region. They both showed good correlation over the bridge and nearly flat slopes for the correlation (b ∽ 0.25, de Jong et al. 2022). In this case, the limited field of view of the XMM-Newton observation does not allow us to reach a firm conclusion on the presence and nature of thermal gas in the inter-cluster region. Additionally, when assuming a slingshot scenario for a system that has likely undergone a history of mergers with more than one sub-halo, as suggested by the disturbed morphology and the presence of multiple BCGs in A2061 (Fig. 6, Hill & Oegerle 1998), attributing all dynamical features in the primary core to only a secondary halo is not straightforward (Sheardown et al. 2019).
As a result of our current analysis, we are not able to firmly favour the infall group scenario or the slingshot scenario. Therefore, the classification of the NE extension remains open, as it could be described either as a radio bridge or as a natural extension of the radio halo. For the NE extension, outside A2061 R500 we measure an integrated flux density of  mJy. Confirming the classification would require a spectral analysis with multi-frequency radio detections and a complementary X-ray/radio point-to-point analysis with an X-ray pointing covering the entire inter-cluster separation, as well as simulations that can help distinguish between the two most likely dynamical scenarios.
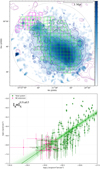 |
Fig. 4 Point-to-point IR /IX correlation for A2061. Top panel: colour scale is the XMM-Newton surface-brightness smoothed image, after subtraction of point sources. Radio contours at 144 MHz (80″ resolution) are shown in purple. The regions used to extract the surface brightness for the IR/IX correlation are 80″ wide boxes. The green boxes cover the entire object, while magenta boxes are only over the radio emission beyond the X-ray plume. Bottom panel: radio/X-ray surface-brightness correlation. The solid green line indicates the best-fit power-law relation for the green points. The slope of the green correlation is reported in the top right corner. The magenta points, relative to the NE extension, show no correlation. |
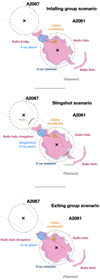 |
Fig. 5 Schematic representation of the three different dynamical scenarios investigated in this work to explain the NE extension emission. |
 |
Fig. 6 Optical image of A2061. Colourscale is Dark Energy Spectroscopic Instrument (DESI) Legacy Survey optical image of the galaxies in A2061. XMM-Newton contours are overlaid in white. In black we mark the location of the two BCGs, in red the location of a galaxy overdensity attributed to the infall of a group of galaxies (Marini et al. 2004), and in cyan the location of the X-ray plume. |
Discovered radio bridges properties.
3.4 The radio relic and trail
Finally, we discuss the other sources of diffuse emission in A2061, the radio relic and the trail. The presence of the radio relic was confirmed by WSRT observations at 1.38 and 1.7 GHz (van Weeren et al. 2011). In their work, they fitted the spectrum of the radio relic with a single power-law between 327 MHz and 1.38 and 1.7 GHz. However, the 327 MHz flux measurement is uncertain (Rudnick & Lemmerman 2009). To better constrain the spectral index, we measured the flux density of the radio relic at 144 MHz from our observations. We used an image at a resolution of 30″, which is similar to the resolution of the high- frequency images (32″ × 15″). At this resolution, we measure a largest linear size (LLS) of ~790 kpc for the relic inside the 5σrms level. The integrated flux density of the relic was computed in the same polygonal region encompassing the 3σ contour of the diffuse emission at 1.38 GHz used in van Weeren et al. (2011). We measure a flux density of S144 = 220 ± 22 mJy and find a spectral index α = −0.92 ± 0.05, which is consistent with the one derived by van Weeren et al. (2011).
Another interesting source of diffuse emission in this system is the ‘trail’ of emission connecting the radio halo to the radio relic. This feature is extended with an LLS of ~700 kpc. Similar features of connected diffuse emission were also detected in several systems, most recently in A1550 (Pasini et al. 2022), in A3667 (Carretti et al. 2013; de Gasperin et al. 2022), and others (see e.g. Kim et al. 1989; van Weeren et al. 2012; Rajpurohit et al. 2018; Bonafede et al. 2018; de Gasperin et al. 2020). The most striking example of diffuse emission connecting a radio halo and a radio relic is the Coma cluster bridge (Bonafede et al. 2021), with an LLS of 940 kpc. These trails of diffuse emission are probably related to post-merger-generated turbulence that re-accelerates particles previously accelerated by shocks (van Weeren et al. 2016a; Bonafede et al. 2021; Pasini et al. 2022). It is likely that the trail of emission in this system could have the same origin. For the trail between the radio halo and the relic in A2061, we measure an integrated flux density of  mJy inside the 2σrms contour level. All the radio quantities measured in this work for the sources in A2061 and the bridge are summarized in Table 4.
Summary of radio quantities measured for the diffuse sources in A2061.
4 Conclusions
Using deep LOFAR HBA observations, we detect diffuse extended emission at 144 MHz between the dynamically interacting galaxy clusters A2061 and A2067, inside the Corona Borealis Supercluster. A2061 is a highly dynamically disturbed system, showing several sources of diffuse emission. The radio halo and the radio relic were already classified with previous radio observations (Farnsworth et al. 2013; van Weeren et al. 2011; Botteon et al. 2022). With 16 new hours of observations at 144 MHz, we are able to detect a source of emission extending for ~800 kpc from the radio halo in A2061 towards A2067. We find no evidence of a radio halo in A2067. The results of our radio and X-ray analysis on the NE extension can be summarized as follows:
From the study of the radio-surface-brightness radial profile, we find that the NE extension emission deviates from the analytical model for the radio halo in A2061;
From the study of the X-ray-surface-brightness radial profile, we find an excess of emission over the background level, which is co-spatial with the radio emission in the extension. This excess is not measured in a different direction, at the same radii, where we measure a decline of the X-ray profile, as expected;
From the point-to-point radio-X correlation, we find mild correlation between thermal and non-thermal emission, measured over the total system. Only the NE extension does not show any clear correlation.
From these results, we investigated three different dynamical scenarios that can help classify the emission in the NE extension. In the exiting group and slingshot scenario, the diffuse emission can be classified as an elongation of the radio halo, while in the infalling group scenario, the emission can be classified as a radio bridge. Our analysis disfavours the exiting group scenario, while we cannot firmly confirm the infalling group or slingshot scenarios. The system closely resembles the two other systems were the presence of a radio bridge is confirmed (Govoni et al. 2019; Botteon et al. 2020), yet the absence of a radio halo in one of the two clusters makes this cluster pair unique for now. Further analysis – in particular the forthcoming works by Akamatsu et al. (in prep.), which will provide a robust X-ray analysis based on both Suzaku and new XMM-Newton observations – will help clarify the ongoing dynamical processes in A2061 and therefore facilitate our understanding of the nature of the diffuse emission between the two galaxy clusters.
Data availability
The reduced images are available at the CDS via anonymous ftp to cdsarc.cds.unistra.fr (130.79.128.5) or via https://cdsarc.cds.unistra.fr/viz-bin/cat/J/A+A/691/A99
Acknowledgements
AB acknowledges financial support from the ERC Starting Grant ‘DRANOEL’, number 714245. FV acknowledges the support by Fon- dazione Cariplo and Fondazione CDP, through grant no. Rif: 2022-2088 CUP J33C22004310003 for “BREAKTHRU” project. RJvW acknowledges support from the ERC Starting Grant ClusterWeb 804208. AB acknowledges financial support from the European Union – Next Generation EU.
Appendix A Halo-FDCA
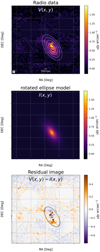 |
Fig. A.1 Result from the fitting procedure performed by Halo-FDCA on the radio halo in A2061. The residual from the extended radio emission in the NE extension is visible in the bottom panel. |
References
- Abell, G. O., Corwin, J., Harold G., & Olowin, R. P. 1989, ApJS, 70, 1 [NASA ADS] [CrossRef] [Google Scholar]
- Bartalucci, I., Molendi, S., Rasia, E., et al. 2023, A&A, 674, A179 [NASA ADS] [CrossRef] [EDP Sciences] [Google Scholar]
- Batiste, M., & Batuski, D. J. 2013, MNRAS, 436, 3331 [CrossRef] [Google Scholar]
- Beduzzi, L., Vazza, F., Brunetti, G., et al. 2023, A&A, 678, L8 [NASA ADS] [CrossRef] [EDP Sciences] [Google Scholar]
- Beduzzi, L., Vazza, F., Cuciti, V., et al. 2024, A&A, 690, A67 [NASA ADS] [CrossRef] [EDP Sciences] [Google Scholar]
- Biava, N., de Gasperin, F., Bonafede, A., et al. 2021, MNRAS, 508, 3995 [NASA ADS] [CrossRef] [Google Scholar]
- Bonafede, A., Brüggen, M., van Weeren, R., et al. 2012, MNRAS, 426, 40 [Google Scholar]
- Bonafede, A., Brüggen, M., Rafferty, D., et al. 2018, MNRAS, 478, 2927 [Google Scholar]
- Bonafede, A., Brunetti, G., Vazza, F., et al. 2021, ApJ, 907, 32 [Google Scholar]
- Bonafede, A., Brunetti, G., Rudnick, L., et al. 2022, ApJ, 933, 218 [NASA ADS] [CrossRef] [Google Scholar]
- Botteon, A., Shimwell, T. W., Bonafede, A., et al. 2018, MNRAS, 478, 885 [Google Scholar]
- Botteon, A., van Weeren, R. J., Brunetti, G., et al. 2020, MNRAS, 499, L11 [Google Scholar]
- Botteon, A., Shimwell, T. W., Cassano, R., et al. 2022, A&A, 660, A78 [NASA ADS] [CrossRef] [EDP Sciences] [Google Scholar]
- Botteon, A., Markevitch, M., van Weeren, R. J., Brunetti, G., & Shimwell, T. W. 2023, A&A, 674, A53 [NASA ADS] [CrossRef] [EDP Sciences] [Google Scholar]
- Boxelaar, J. M., van Weeren, R. J., & Botteon, A. 2021, Astron. Comput., 35, 100464 [NASA ADS] [CrossRef] [Google Scholar]
- Briggs, D., S. 1995, PhD thesis, New Mexico Institute of Mining Technology, Socorro, New Mexico, USA [Google Scholar]
- Brunetti, G., & Jones, T. W. 2014, Int. J. Mod. Phys. D, 23, 1430007 [Google Scholar]
- Brunetti, G., & Lazarian, A. 2007, MNRAS, 378, 245 [Google Scholar]
- Brunetti, G., & Vazza, F. 2020, Phys. Rev. Lett., 124, 051101 [Google Scholar]
- Brunetti, G., Cassano, R., Dolag, K., & Setti, G. 2009, A&A, 507, 661 [NASA ADS] [CrossRef] [EDP Sciences] [Google Scholar]
- Carretti, E., Brown, S., Staveley-Smith, L., et al. 2013, MNRAS, 430, 1414 [NASA ADS] [CrossRef] [Google Scholar]
- Cassano, R., Ettori, S., Giacintucci, S., et al. 2010, ApJ, 721, L82 [Google Scholar]
- Cassano, R., Cuciti, V., Brunetti, G., et al. 2023, A&A, 672, A43 [NASA ADS] [CrossRef] [EDP Sciences] [Google Scholar]
- CHEX-MATE Collaboration (Arnaud, M., et al.) 2021, A&A, 650, A104 [NASA ADS] [CrossRef] [EDP Sciences] [Google Scholar]
- Condon, J. J. 1988, in Galactic and Extragalactic Radio Astronomy, eds. K. I. Kellermann, & G. L. Verschuur, 641 [CrossRef] [Google Scholar]
- Condon, J. J., Cotton, W. D., Greisen, E. W., et al. 1998, AJ, 115, 1693 [Google Scholar]
- Cuciti, V., Cassano, R., Brunetti, G., et al. 2021, A&A, 647, A51 [EDP Sciences] [Google Scholar]
- de Gasperin, F., Dijkema, T. J., Drabent, A., et al. 2019, A&A, 622, A5 [NASA ADS] [CrossRef] [EDP Sciences] [Google Scholar]
- de Gasperin, F., Brunetti, G., Brüggen, M., et al. 2020, A&A, 642, A85 [NASA ADS] [CrossRef] [EDP Sciences] [Google Scholar]
- de Gasperin, F., Rudnick, L., Finoguenov, A., et al. 2022, A&A, 659, A146 [NASA ADS] [CrossRef] [EDP Sciences] [Google Scholar]
- de Jong, J. M. G. H. J., van Weeren, R. J., Botteon, A., et al. 2022, A&A, 668, A107 [NASA ADS] [CrossRef] [EDP Sciences] [Google Scholar]
- Donnert, J., Dolag, K., Brunetti, G., & Cassano, R. 2013, MNRAS, 429, 3564 [Google Scholar]
- Ebeling, H., Edge, A. C., Bohringer, H., et al. 1998, MNRAS, 301, 881 [Google Scholar]
- Einasto, M., Kipper, R., Tenjes, P., et al. 2021, A&A, 649, A51 [NASA ADS] [CrossRef] [EDP Sciences] [Google Scholar]
- Ettori, S., Gastaldello, F., Leccardi, A., et al. 2010, A&A, 524, A68 [NASA ADS] [CrossRef] [EDP Sciences] [Google Scholar]
- Farnsworth, D., Rudnick, L., Brown, S., & Brunetti, G. 2013, ApJ, 779, 189 [Google Scholar]
- Feretti, L., Giovannini, G., Govoni, F., & Murgia, M. 2012, A&A Rev., 20, 54 [Google Scholar]
- Ghirardini, V., Eckert, D., Ettori, S., et al. 2019, A&A, 621, A41 [NASA ADS] [CrossRef] [EDP Sciences] [Google Scholar]
- Govoni, F., Enßlin, T. A., Feretti, L., & Giovannini, G. 2001, A&A, 369, 441 [NASA ADS] [CrossRef] [EDP Sciences] [Google Scholar]
- Govoni, F., Orrù, E., Bonafede, A., et al. 2019, Science, 364, 981 [Google Scholar]
- Gu, L., Akamatsu, H., Shimwell, T. W., et al. 2019, Nat. Astron., 3, 838 [NASA ADS] [CrossRef] [Google Scholar]
- Ha, J.-H., Ryu, D., & Kang, H. 2018, ApJ, 857, 26 [NASA ADS] [CrossRef] [Google Scholar]
- Hallman, E. J., & Markevitch, M. 2004, ApJ, 610, L81 [Google Scholar]
- Hardcastle, M. J., Shimwell, T. W., Tasse, C., et al. 2021, A&A, 648, A10 [EDP Sciences] [Google Scholar]
- Hill, J. M., & Oegerle, W. R. 1998, AJ, 116, 1529 [NASA ADS] [CrossRef] [Google Scholar]
- Hoang, D. N., Shimwell, T. W., van Weeren, R. J., et al. 2019, A&A, 622, A20 [NASA ADS] [CrossRef] [EDP Sciences] [Google Scholar]
- Hoeft, M., Dumba, C., Drabent, A., et al. 2021, A&A, 654, A68 [NASA ADS] [CrossRef] [EDP Sciences] [Google Scholar]
- Iapichino, L., Schmidt, W., Niemeyer, J. C., & Merklein, J. 2011, MNRAS, 414, 2297 [CrossRef] [Google Scholar]
- Kelly, B. C. 2007, ApJ, 665, 1489 [Google Scholar]
- Kempner, J. C., & Sarazin, C. L. 2001, ApJ, 548, 639 [Google Scholar]
- Kim, K. T., Kronberg, P. P., Giovannini, G., & Venturi, T. 1989, Nature, 341, 720 [Google Scholar]
- Kurahara, K., Akahori, T., Kale, R., et al. 2023, PASJ, 75, S138 [NASA ADS] [CrossRef] [Google Scholar]
- Lal, D. V., Lyskova, N., Zhang, C., et al. 2022, ApJ, 934, 170 [NASA ADS] [CrossRef] [Google Scholar]
- Lyskova, N., Churazov, E., Zhang, C., et al. 2019, MNRAS, 485, 2922 [Google Scholar]
- Machado, R. E. G., Volert, R. C., Albuquerque, R. P., Monteiro-Oliveira, R., & Neto, G. B. L. 2024, Simulating the arrival of the southern substructure in the galaxy cluster Abell 1758 [Google Scholar]
- Marini, F., Bardelli, S., Zucca, E., et al. 2004, MNRAS, 353, 1219 [Google Scholar]
- Markevitch, M., & Vikhlinin, A. 2007, Phys. Rep., 443, 1 [Google Scholar]
- Markevitch, M., Sarazin, C. L., & Vikhlinin, A. 1999, ApJ, 521, 526 [Google Scholar]
- Mechev, A. P., Plaat, A., Oonk, J. B. R., Intema, H. T., & Röttgering, H. J. A. 2018, Astron. Comput., 24, 117 [Google Scholar]
- Murgia, M., Govoni, F., Markevitch, M., et al. 2009, A&A, 499, 679 [NASA ADS] [CrossRef] [EDP Sciences] [Google Scholar]
- Nishiwaki, K., Brunetti, G., Vazza, F., & Gheller, C. 2024, ApJ, 961, 15 [NASA ADS] [CrossRef] [Google Scholar]
- Offringa, A. R., McKinley, B., Hurley-Walker, et al. 2014, MNRAS, 444, 606 [NASA ADS] [CrossRef] [Google Scholar]
- Omiya, Y., Nakazawa, K., Matsushita, K., et al. 2023, PASJ, 75, 37 [NASA ADS] [CrossRef] [Google Scholar]
- Pasini, T., Edler, H. W., Brüggen, M., et al. 2022, A&A, 663, A105 [NASA ADS] [CrossRef] [EDP Sciences] [Google Scholar]
- Pearson, D. W., Batiste, M., & Batuski, D. J. 2014, MNRAS, 441, 1601 [Google Scholar]
- Piffaretti, R., Arnaud, M., Pratt, G. W., Pointecouteau, E., & Melin, J. B. 2011, A&A, 534, A109 [NASA ADS] [CrossRef] [EDP Sciences] [Google Scholar]
- Pignataro, G. V., Bonafede, A., Bernardi, G., et al. 2024a, A&A, 685, L10 [NASA ADS] [CrossRef] [EDP Sciences] [Google Scholar]
- Pignataro, G. V., Bonafede, A., Bernardi, G., et al. 2024b, A&A, 682, A105 [NASA ADS] [CrossRef] [EDP Sciences] [Google Scholar]
- Planck Collaboration XXII. 2016, A&A, 594, A22 [NASA ADS] [CrossRef] [EDP Sciences] [Google Scholar]
- Poole, G. B., Fardal, M. A., Babul, A., et al. 2006, MNRAS, 373, 881 [Google Scholar]
- Rajpurohit, K., Hoeft, M., van Weeren, R. J., et al. 2018, ApJ, 852, 65 [Google Scholar]
- Rajpurohit, K., Brunetti, G., Bonafede, A., et al. 2021a, A&A, 646, A135 [NASA ADS] [CrossRef] [EDP Sciences] [Google Scholar]
- Rajpurohit, K., Vazza, F., van Weeren, R. J., et al. 2021b, A&A, 654, A41 [NASA ADS] [CrossRef] [EDP Sciences] [Google Scholar]
- Rajpurohit, K., Osinga, E., Brienza, M., et al. 2023, A&A, 669, A1 [NASA ADS] [CrossRef] [EDP Sciences] [Google Scholar]
- Rengelink, R. B., Tang, Y., de Bruyn, A. G., et al. 1997, A&AS, 124, 259 [NASA ADS] [CrossRef] [EDP Sciences] [Google Scholar]
- Rines, K., & Diaferio, A. 2006, AJ, 132, 1275 [Google Scholar]
- Riseley, C. J., Bonnassieux, E., Vernstrom, T., et al. 2022, MNRAS, 515, 1871 [NASA ADS] [CrossRef] [Google Scholar]
- Riseley, C. J., Bonafede, A., Bruno, L., et al. 2024, A&A, 686, A44 [NASA ADS] [CrossRef] [EDP Sciences] [Google Scholar]
- Rossetti, M., Eckert, D., Gastaldello, F., et al. 2024, A&A, 686, A68 [NASA ADS] [CrossRef] [EDP Sciences] [Google Scholar]
- Rudnick, L., & Lemmerman, J. A. 2009, ApJ, 697, 1341 [NASA ADS] [CrossRef] [Google Scholar]
- Sheardown, A., Roediger, E., Su, Y., et al. 2018, ApJ, 865, 118 [Google Scholar]
- Sheardown, A., Fish, T. M., Roediger, E., et al. 2019, ApJ, 874, 112 [Google Scholar]
- Shimwell, T. W., Röttgering, H. J. A., Best, P. N., et al. 2017, A&A, 598, A104 [NASA ADS] [CrossRef] [EDP Sciences] [Google Scholar]
- Shimwell, T. W., Tasse, C., Hardcastle, M. J., et al. 2019, A&A, 622, A1 [NASA ADS] [CrossRef] [EDP Sciences] [Google Scholar]
- Shimwell, T. W., Hardcastle, M. J., Tasse, C., et al. 2022, A&A, 659, A1 [NASA ADS] [CrossRef] [EDP Sciences] [Google Scholar]
- Smirnov, O. M., & Tasse, C. 2015, MNRAS, 449, 2668 [Google Scholar]
- Snowden, S. L., Mushotzky, R. F., Kuntz, K. D., & Davis, D. S. 2008, A&A, 478, 615 [NASA ADS] [CrossRef] [EDP Sciences] [Google Scholar]
- Strüder, L., Briel, U., Dennerl, K., et al. 2001, A&A, 365, L18 [Google Scholar]
- Tasse, C. 2014, A&A, 566, A127 [NASA ADS] [CrossRef] [EDP Sciences] [Google Scholar]
- Tasse, C., Hugo, B., Mirmont, M., et al. 2018, A&A, 611, A87 [NASA ADS] [CrossRef] [EDP Sciences] [Google Scholar]
- Tasse, C., Shimwell, T., Hardcastle, M. J., et al. 2021, A&A, 648, A1 [EDP Sciences] [Google Scholar]
- Turner, M. J. L., Abbey, A., Arnaud, M., et al. 2001, A&A, 365, L27 [CrossRef] [EDP Sciences] [Google Scholar]
- van Weeren, R. J., Brüggen, M., Röttgering, H. J. A., et al. 2011, A&A, 533, A35 [NASA ADS] [CrossRef] [EDP Sciences] [Google Scholar]
- van Weeren, R. J., Röttgering, H. J. A., Intema, H. T., et al. 2012, A&A, 546, A124 [NASA ADS] [CrossRef] [EDP Sciences] [Google Scholar]
- van Weeren, R. J., Brunetti, G., Brüggen, M., et al. 2016a, ApJ, 818, 204 [Google Scholar]
- van Weeren, R. J., Williams, W. L., Hardcastle, M. J., et al. 2016b, ApJS, 223, 2 [Google Scholar]
- van Weeren, R. J., de Gasperin, F., Akamatsu, H., et al. 2019, Space Sci. Rev., 215, 16 [Google Scholar]
- van Weeren, R. J., Shimwell, T. W., Botteon, A., et al. 2021, A&A, 651, A115 [NASA ADS] [CrossRef] [EDP Sciences] [Google Scholar]
- Vazza, F., Ettori, S., Roncarelli, M., et al. 2019, A&A, 627, A5 [NASA ADS] [CrossRef] [EDP Sciences] [Google Scholar]
- Venturi, T., Giacintucci, S., Dallacasa, D., et al. 2013, A&A, 551, A24 [NASA ADS] [CrossRef] [EDP Sciences] [Google Scholar]
- Venturi, T., Giacintucci, S., Merluzzi, P., et al. 2022, A&A, 660, A81 [NASA ADS] [CrossRef] [EDP Sciences] [Google Scholar]
All Tables
Coordinates, redshift, radius, and mass of the two clusters analysed in this work.
All Figures
|
Fig. 1 Composite image of galaxy cluster system Abell 2061–Abell 2067 in the Corona Borealis supercluster. The radio emission from LOFAR observations at 144 MHz and 80″ resolution is shown in red. The diffuse emission sources presented in this work are highlighted in white. The X- ray ROSAT emission is shown in blue, overlaid on the optical Pan-STARRS1 image. |
| In the text | |
|
Fig. 2 Radio maps of A2061-A2067. Left panel: image of A2061-A2067 at a resolution of 8″ × 5″ (PA 90°). The imaging was done adopting a Briggs weighting scheme (Briggs 1995) with robust=−0.5, and the resulting rms noise is σrms = 80 µJy beam−1. The radio halo (white dashed circle) and the radio relic (magenta dashed circle) are already visible at high resolution and without compact source subtraction. The most interesting radio sources in the field are highlighted in the circles. Right panel: image of A2061-A2067 at a resolution of 80″ after subtraction of compact sources. The imaging was made by adopting a Briggs weighting scheme with robust=−0.5 and applying a Gaussian uv taper of 70″. We show the 2, 3, 5, 10 − σrms contour levels in white and the 20, 30 − σrms contours level in black (σrms = 0.4 mJy beam−1.) The −2σrms contours are shown by dashed red lines. Additionally to the radio halo and relic in A2061, we now detect diffuse emission in the NE extension (green dashed region) and trail (cyan dashed region). |
| In the text | |
|
Fig. 3 Radio and X-ray surface-brightness profile of A2061. Top left panel: 80′′ radio map at 144 MHz with residual sources masked is shown via a pink colour scale. We show the 2, 3, 5, 10-σrms contour levels in purple and the 20, 30-σrms contour level in white. The mean radio brightness is computed inside the blue region. The width of the elliptical annuli along the major axis is ∼2 times the beam size (80′′). The 2.5rx area is delimited by the dashed green line. Bottom left panel: comparison between the average surface brightness measured in each blue bin (the magenta data points, with 1σ uncertainties) with the model profile from the best-fit analysis performed with HALO-FDCA (solid cyan line, with 2σ uncertainties). Beyond ∼2.5rx (dashed green line), the average surface brightness is persistently higher than the best-fit radio-halo model due to the NE extension. Top right panel: smoothed XMM-Newton X-ray map is shown in blue colour scale. The contour levels from the radio emission are overlaid in purple, and the X-ray point sources (green circles) are masked. The X-ray surface brightness is computed inside the magenta slices, centred on the radio halo and covering the NE extension. We compare this sector with the yellow slice, in a direction offset from the extension. The width of the circular sectors is one beam size (80′′). Bottom right panel: the two profiles extracted from the different sectors are shown in magenta and yellow points. In the NE direction, we note a bump in the profile associated with the X-ray plume that is followed by an excess at larger radii. On the contrary, there is no evidence of excess at the same distances from the centre in the yellow sector. The background level in each sector is shown with magenta and yellow dashed lines. |
| In the text | |
|
Fig. 4 Point-to-point IR /IX correlation for A2061. Top panel: colour scale is the XMM-Newton surface-brightness smoothed image, after subtraction of point sources. Radio contours at 144 MHz (80″ resolution) are shown in purple. The regions used to extract the surface brightness for the IR/IX correlation are 80″ wide boxes. The green boxes cover the entire object, while magenta boxes are only over the radio emission beyond the X-ray plume. Bottom panel: radio/X-ray surface-brightness correlation. The solid green line indicates the best-fit power-law relation for the green points. The slope of the green correlation is reported in the top right corner. The magenta points, relative to the NE extension, show no correlation. |
| In the text | |
|
Fig. 5 Schematic representation of the three different dynamical scenarios investigated in this work to explain the NE extension emission. |
| In the text | |
|
Fig. 6 Optical image of A2061. Colourscale is Dark Energy Spectroscopic Instrument (DESI) Legacy Survey optical image of the galaxies in A2061. XMM-Newton contours are overlaid in white. In black we mark the location of the two BCGs, in red the location of a galaxy overdensity attributed to the infall of a group of galaxies (Marini et al. 2004), and in cyan the location of the X-ray plume. |
| In the text | |
|
Fig. A.1 Result from the fitting procedure performed by Halo-FDCA on the radio halo in A2061. The residual from the extended radio emission in the NE extension is visible in the bottom panel. |
| In the text | |
Current usage metrics show cumulative count of Article Views (full-text article views including HTML views, PDF and ePub downloads, according to the available data) and Abstracts Views on Vision4Press platform.
Data correspond to usage on the plateform after 2015. The current usage metrics is available 48-96 hours after online publication and is updated daily on week days.
Initial download of the metrics may take a while.