Fig. 4
Download original image
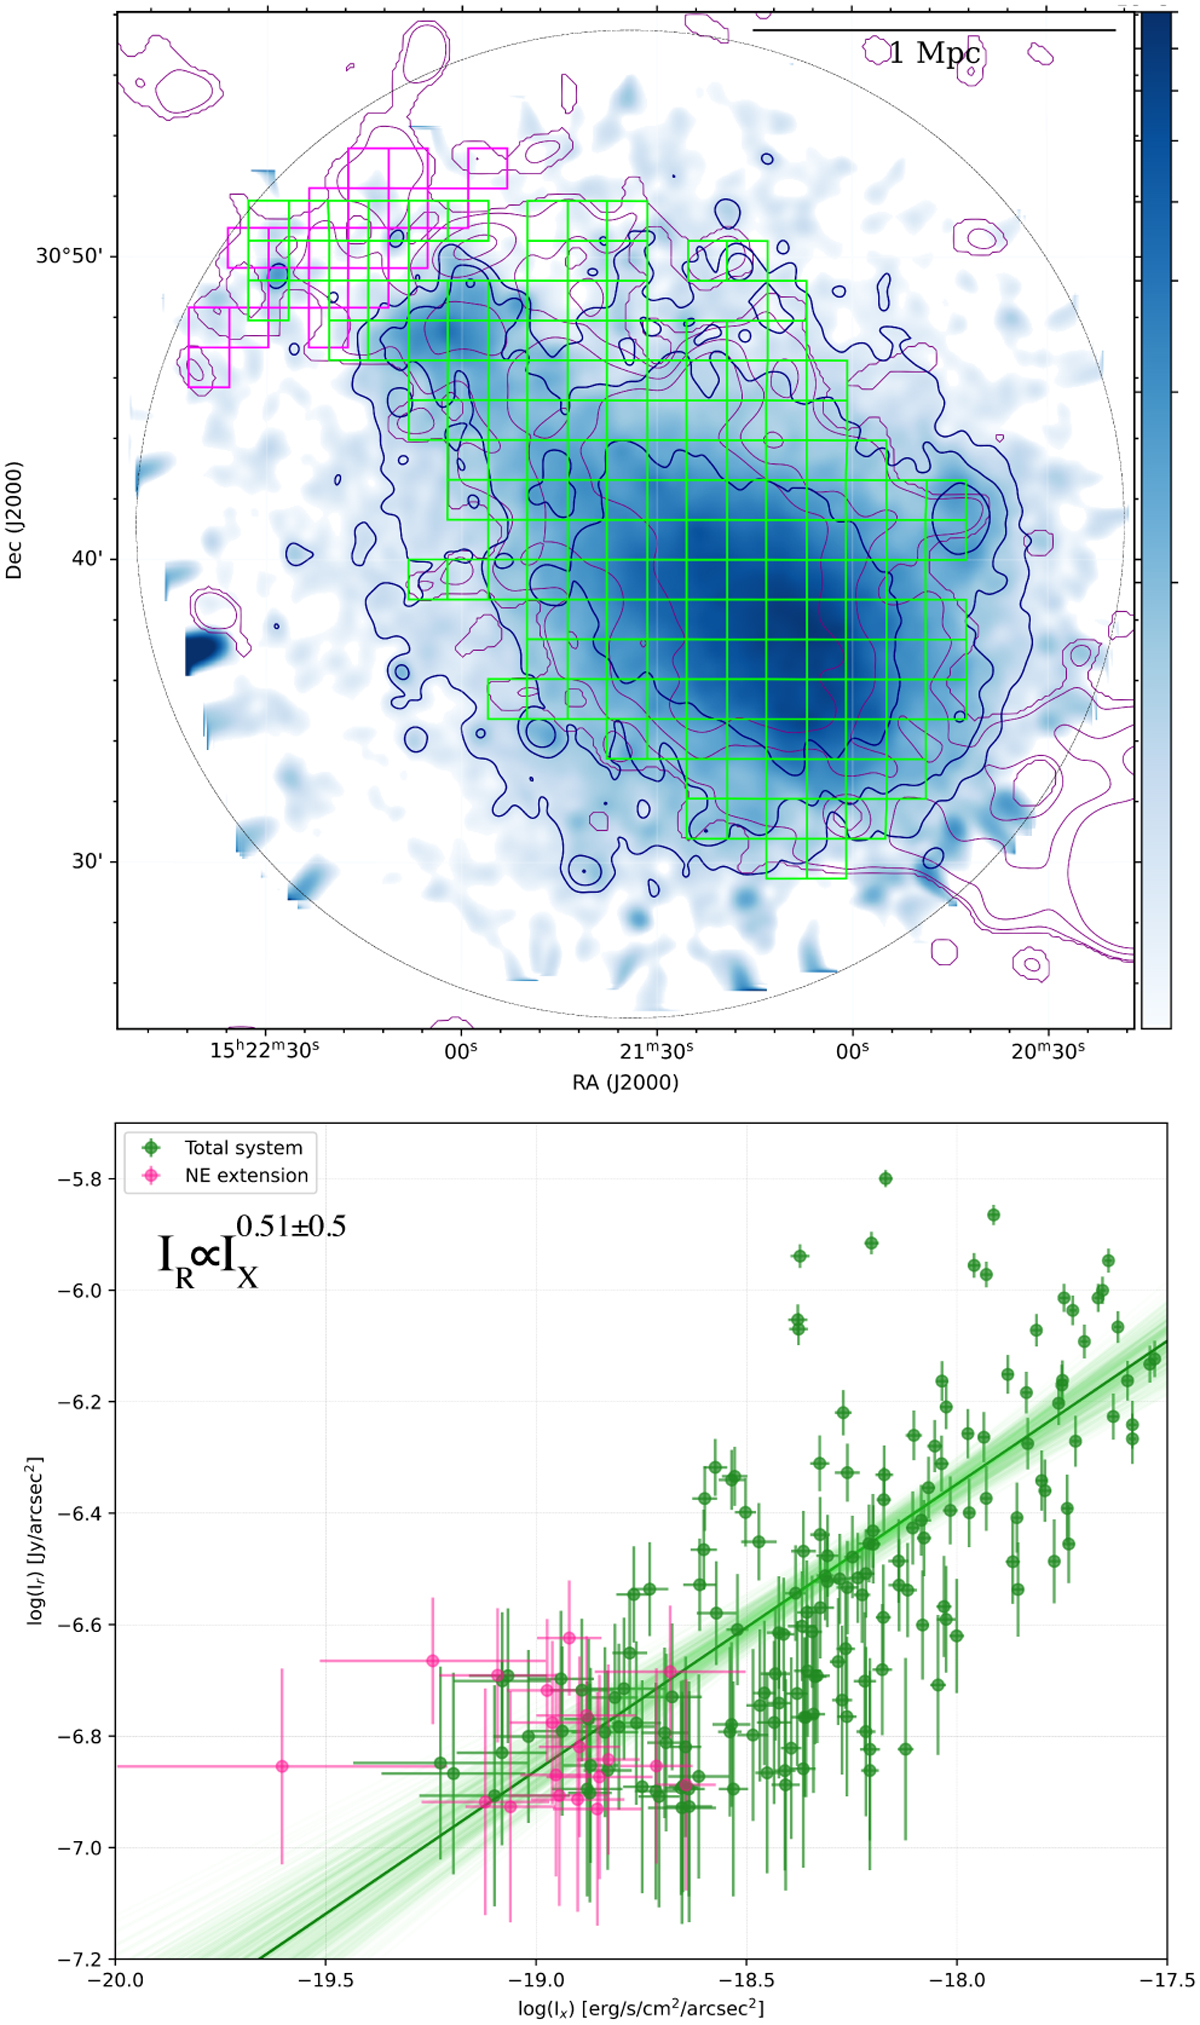
Point-to-point IR /IX correlation for A2061. Top panel: colour scale is the XMM-Newton surface-brightness smoothed image, after subtraction of point sources. Radio contours at 144 MHz (80″ resolution) are shown in purple. The regions used to extract the surface brightness for the IR/IX correlation are 80″ wide boxes. The green boxes cover the entire object, while magenta boxes are only over the radio emission beyond the X-ray plume. Bottom panel: radio/X-ray surface-brightness correlation. The solid green line indicates the best-fit power-law relation for the green points. The slope of the green correlation is reported in the top right corner. The magenta points, relative to the NE extension, show no correlation.
Current usage metrics show cumulative count of Article Views (full-text article views including HTML views, PDF and ePub downloads, according to the available data) and Abstracts Views on Vision4Press platform.
Data correspond to usage on the plateform after 2015. The current usage metrics is available 48-96 hours after online publication and is updated daily on week days.
Initial download of the metrics may take a while.