Fig. 3
Download original image
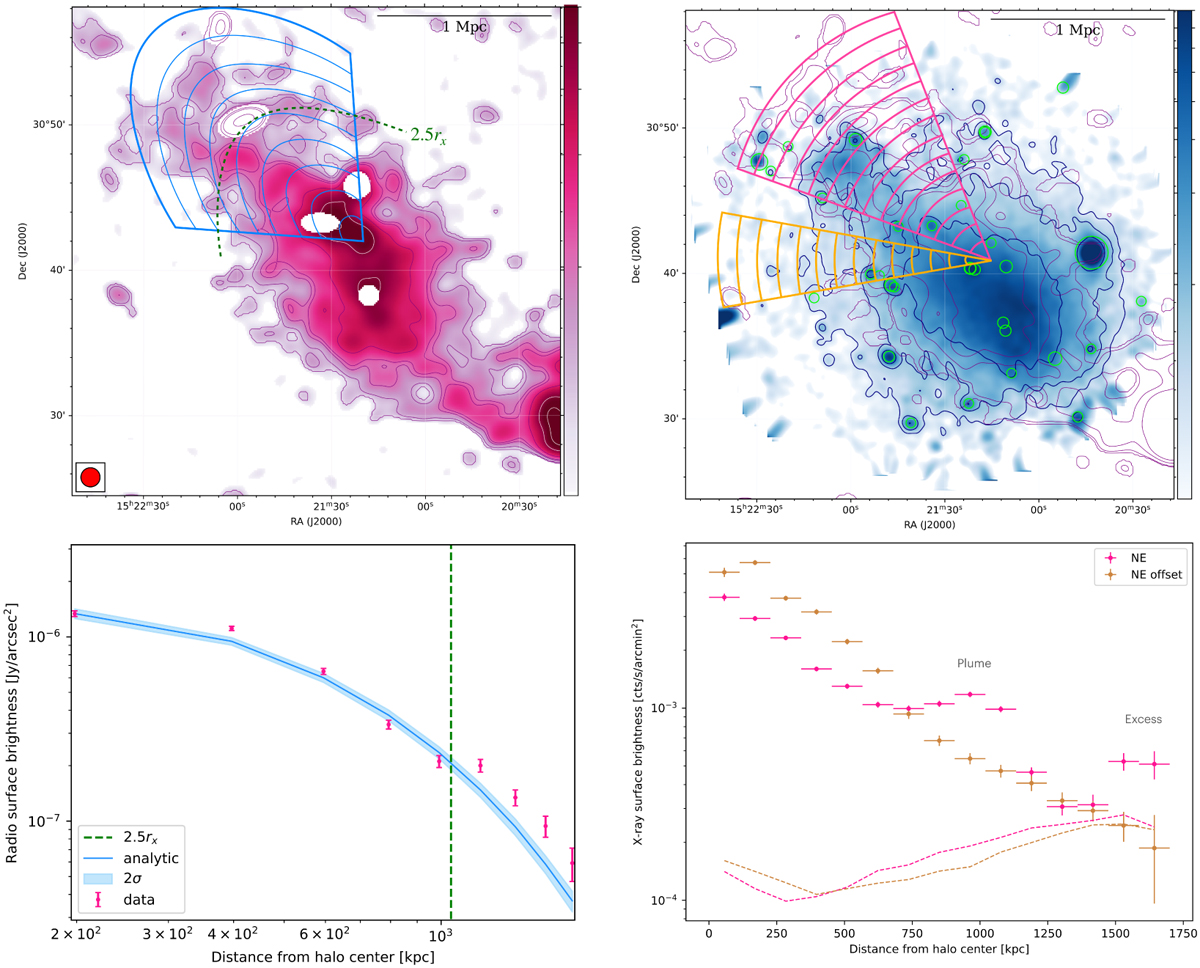
Radio and X-ray surface-brightness profile of A2061. Top left panel: 80′′ radio map at 144 MHz with residual sources masked is shown via a pink colour scale. We show the 2, 3, 5, 10-σrms contour levels in purple and the 20, 30-σrms contour level in white. The mean radio brightness is computed inside the blue region. The width of the elliptical annuli along the major axis is ∼2 times the beam size (80′′). The 2.5rx area is delimited by the dashed green line. Bottom left panel: comparison between the average surface brightness measured in each blue bin (the magenta data points, with 1σ uncertainties) with the model profile from the best-fit analysis performed with HALO-FDCA (solid cyan line, with 2σ uncertainties). Beyond ∼2.5rx (dashed green line), the average surface brightness is persistently higher than the best-fit radio-halo model due to the NE extension. Top right panel: smoothed XMM-Newton X-ray map is shown in blue colour scale. The contour levels from the radio emission are overlaid in purple, and the X-ray point sources (green circles) are masked. The X-ray surface brightness is computed inside the magenta slices, centred on the radio halo and covering the NE extension. We compare this sector with the yellow slice, in a direction offset from the extension. The width of the circular sectors is one beam size (80′′). Bottom right panel: the two profiles extracted from the different sectors are shown in magenta and yellow points. In the NE direction, we note a bump in the profile associated with the X-ray plume that is followed by an excess at larger radii. On the contrary, there is no evidence of excess at the same distances from the centre in the yellow sector. The background level in each sector is shown with magenta and yellow dashed lines.
Current usage metrics show cumulative count of Article Views (full-text article views including HTML views, PDF and ePub downloads, according to the available data) and Abstracts Views on Vision4Press platform.
Data correspond to usage on the plateform after 2015. The current usage metrics is available 48-96 hours after online publication and is updated daily on week days.
Initial download of the metrics may take a while.