Fig. 6.
Download original image
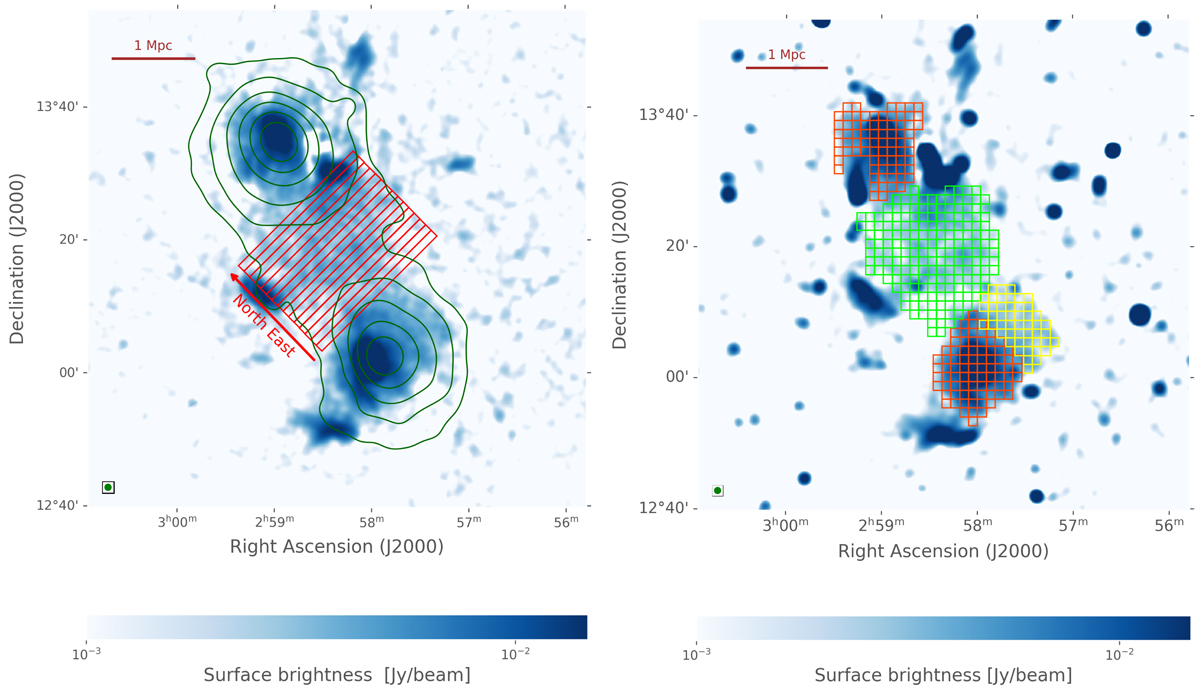
Radio maps of A399-401 where most compact sources are removed. Left panel: radio image in blue: uv-subtract image described in the text. The square-root color scale extends from 1σ to 25σ. Green contour lines are from X-ray data from XMM-Newton, which are smoothed with a Gaussian kernel. The red slices (1100″ × 75″) point northeast. Right panel: radio image in blue: R02 filtered image described in the text. The square-root color scale of the images extends from 1σ to 25σ. It has a grid overlay on the two clusters and on the radio bridge on top of the radio image with the R02 filter. The orange grids cover the halos, the green grid covers the radio bridge, and the yellow grid covers the northwest radio halo extension from A399. The cell size in the grid is 80″ × 80″. The scale for 1 Mpc at z = 0.072 is given in both images in the upper left corner.
Current usage metrics show cumulative count of Article Views (full-text article views including HTML views, PDF and ePub downloads, according to the available data) and Abstracts Views on Vision4Press platform.
Data correspond to usage on the plateform after 2015. The current usage metrics is available 48-96 hours after online publication and is updated daily on week days.
Initial download of the metrics may take a while.