| Issue |
A&A
Volume 666, October 2022
|
|
|---|---|---|
| Article Number | A119 | |
| Number of page(s) | 17 | |
| Section | Astronomical instrumentation | |
| DOI | https://doi.org/10.1051/0004-6361/202243092 | |
| Published online | 18 October 2022 | |
The H.E.S.S. transients follow-up system
1
Institut für Physik und Astronomie, Universität Potsdam,
Karl-Liebknecht-Strasse 24/25,
14476
Potsdam, Germany
e-mail: This email address is being protected from spambots. You need JavaScript enabled to view it.
2
Deutsches Elektronen-Synchrotron DESY,
Platanenallee 6
15738,
Germany
3
GRAPPA, Anton Pannekoek Institute for Astronomy, University of Amsterdam,
Science Park 904,
1098 XH
Amsterdam, The Netherlands
4
IRFU, CEA, Université Paris-Saclay,
91191
Gif-sur-Yvette, France
5
Max-Planck-Institut für Kernphysik,
P.O. Box 103980,
D 69029
Heidelberg, Germany
e-mail: This email address is being protected from spambots. You need JavaScript enabled to view it.
;This email address is being protected from spambots. You need JavaScript enabled to view it.
Received:
12
January
2022
Accepted:
27
July
2022
Abstract
Observations of astrophysical transients have brought many novel discoveries and provided new insights into the physical processes at work under extreme conditions in the Universe. Multi-wavelength and multi-messenger observations of variable objects require dedicated procedures and follow-up systems capable of digesting and reacting to external alerts to execute coordinated follow-up campaigns. The main functions of such follow-up systems are the processing, filtering, and ranking of the incoming alerts, the fully automated rapid execution of the observations according to an observation strategy tailored to the instrument, and real-time data analysis with feedback to the operators and other instruments. The High Energy Stereoscopic System (H.E.S.S.) has been searching for transient phenomena since its inauguration in 2003. In this paper, we describe the transients follow-up system of H.E.S.S. which became operational in 2016. The system allows H.E.S.S. to conduct a more versatile, optimised, and largely autonomous transient follow-up programme, combining all major functionalities in one systematic approach. We describe the design, central functionalities, and interfaces of the follow-up system in general and its three main components in detail: the Target of Opportunity (ToO) alert system, the data acquisition and central control system, and the real-time analysis. We highlight architectural decisions and features that enable fully automatic ToO follow-up and indicate key performance metrics of the subsystems. We discuss the system's capabilities and highlight the need for a fine-tuned interplay of the different subsystems in order to react quickly and reliably. Lessons learnt from the development, integration, and operation of the follow-up system are reviewed in light of new and large science infrastructures and associated challenges in this exciting new era of inter-operable astronomy.
Key words: methods: observational / gamma rays: general
Now at Centre Antoine Lacassagne, Nice, France.
© C. Hoischen et al. 2022
 Open Access article, published by EDP Sciences, under the terms of the Creative Commons Attribution License (https://creativecommons.org/licenses/by/4.0), which permits unrestricted use, distribution, and reproduction in any medium, provided the original work is properly cited.
This article is published in open access under the Subscribe-to-Open model. This email address is being protected from spambots. You need JavaScript enabled to view it. to support open access publication.
1 Introduction
Dynamical astrophysical processes manifest themselves in time-variable emission of electromagnetic radiation, gravitational waves, and/or particles such as neutrinos or cosmic rays. The detection and characterisation of variable or transient astrophys-ical sources via the different messengers hence allows us to study the underlying physics in often extreme environments. Transient objects have been studied across the electromagnetic spectrum over timescales ranging from microseconds to tens of years and comprise a multitude of different phenomena such as fast radio bursts (FRBs, 10−6 s), gamma-ray bursts (GRBs, (1−100) s), flaring active galactic nuclei (AGN, minutes to months), or super-novae (days to months). Recently, the detection of high-energy astrophysical neutrinos and gravitational waves in coincidence with electromagnetic counterparts has opened the window into multi-messenger time-domain astronomy.
The major challenge in time-domain astronomy lies in the unpredictable nature of variable and transient sources. They either require monitoring campaigns targeting known objects, or instruments with a large Field of View (FoV) that are able to cover major parts of the sky to serendipitously observe explosive events, for example. Such telescopes are operated on Earth or on satellites in space across the electromagnetic spectrum from radio, optical, to X-ray wavelengths and up to the gamma-ray regime. Also cosmic-ray, gravitational-wave, and neutrino telescopes simultaneously observe major parts of the sky.
The ability to detect astrophysical transients of varying duration is directly linked to the accessible FoV of instruments, their sensitivity in the respective wavelength band, and the time to react to triggers and speed to re-point to a new sky position for pointed instruments. Depending on the science focus of instruments in the different wavelength ranges, the designs of telescopes vary. They can be broadly grouped into two categories: Pointed instruments with FoVs of at most a few tens of square degrees typically cover less than 1% of the accessible sky. Survey instruments, on the other hand, are designed to cover major parts of the sky, typically between 10% (e.g. Swift-BAT) to ~50% (e.g. Fermi-GBM) or truly all-sky (e.g. GECAM, Ligo/Virgo, or IceCube). The detection of astrophysical transients with pointed instruments is either realised by serendipitous discoveries or by targeting the transients detected by survey instruments in a follow-up observation. Imaging Atmospheric Cherenkov Telescopes (IACTs) are pointed instruments with FoVs of <20 square degrees and are sensitive in the tens of GeV to TeV gamma-ray energy range. Their limited FoV results in an improved sensitivity compared to survey instruments, and it would be ideal to follow up on their external triggers.
Fast transients with a duration of seconds to minutes, such as GRBs, require a swift communication of their detection and main characteristics to the astrophysical community. Survey instruments analyse the observations in real time, detect a transient in the FoV, classify it, and send this information to relay stations across the globe from where information is distributed further via international networks. Follow-up instruments then receive and process this information and decide if they can and want to react, based on the science case taking the observing conditions into account, and then initiate follow-up observations.
The classification and distribution of transient alerts is mostly realised by the instruments that search for them. For decades, the distribution of alerts in the community has been accomplished through human-generated astronomer’s telegrams (Rutledge 1998) or via the Gamma-ray Coordinates Network (GCN; Barthelmy 2008) and streams of machine-readable notices to which observatories can subscribe. With an increased interest in the time-domain community, more and more functionality, such as advanced brokering, additional processing, as well as the generation of new alerts from combinations of data streams, is sought after. A growing number of systems aim to realise these features, of which the High Energy Stereoscopic System (H.E.S.S.) currently uses (i) AMON (Smith et al. 2013), which combines sub-threshold data streams to generate new alerts that are sent to the GCN; (ii) AMPEL (Nordin et al. 2019), which provides an open source framework to combine, filter, and process data across the electromagnetic spectrum and astrophysical messengers to classify different kinds of transients from which H.E.S.S. is receiving Nova candidates; (iii) Astro-COLIBRI (Reichherzer et al. 2021), which allows for visual monitoring of transient alert localisations and timelines which many H.E.S.S. Target-of-Opportunity (ToO) principal investigators (PIs) use to monitor recent alerts; and (iv) FLaapLUC (Lenain 2018), which continuously runs likelihood Fermi-LAT data analyses of potentially variable sources in order to trigger follow-up observations manually.
The follow-up of transient alerts by pointed instruments requires dedicated and integrated transients follow-up systems that connect external alerts to the instrument. They are optimised for a fast and flexible handling of external transient alerts, including the following: alert reception and processing, execution of follow-up observations, real-time analysis (RTA) of incoming data, and communication of results and follow-up alerts to the operators, PIs, and the scientific community.
In this work, we present the transients’ follow-up system of the H.E.S.S. experiment, an IACT system situated in Namibia, probing the very-high-energy (VHE, 30GeV to 100 TeV) gamma-ray sky. The overall concept, design, and main building blocks of the system are presented in Sect. 2. The ToO alert system, the Data AcQuisition (DAQ) and central control ToO system, and RTA are presented in Sects. 3−5, respectively. The interplay of the different components and application to science cases are discussed in Sect. 6. A summary and outlook are given in Sect. 7.
2 The Transients follow-up System in H.E.S.S.
2.1 The High Energy Stereoscopic System
H.E.S.S. is an array of five IACTs located in the Khomas Highland in Namibia and operating during clear nights with moon fraction below 40%, resulting in a duty cycle of (10−15)%. The telescopes are equipped with photomultiplier-tube-based pixe-lated cameras that record Cherenkov light emitted by extensive air showers, which are initiated when VHE gamma rays, electrons, and charged nuclei interact in the atmosphere. H.E.S.S. consists of two different telescope types: 4 telescopes (CT1−4) have a FoV of 5° diameter and a mirror area of 107m2. CT1-4 are arranged in a square with side-lengths of 120 m. A larger telescope, CT5, with a mirror area of 614 m2 and a camera FoV of 3.4° diameter, is located in the centre of the array. While CT1-4 detect gamma rays with energies of ≳ 100 GeV, CT5 measures gamma rays with energies of ≳30 GeV. This low energy threshold is key when studying transients, in particular those that are of extragalactic origin. High-energy and VHE photons with energies beyond ~ 100 GeV increasingly suffer from photon-photon absorption in the extragalactic background light on their way from the source to Earth. For instance, at 100 GeV photon energies, the gamma-ray horizon is limited to sources at redshifts of ≲1. The energy threshold of IACTs increases for example with increasing zenith angle of observations, limiting the reach in volume to astrophysical transients further. On the other hand, the response of the CT5 telescope and the DAQ have been optimised for a very fast re-positioning to capture shortlived transients that are expected to dim rapidly in gamma rays (Hofverberg et al. 2013; Balzer et al. 2015). Situated in the Southern Hemisphere, H.E.S.S. is the only instrument that can provide follow-up observations in the VHE gamma-ray band for southern-sky transients. For transients on hour timescales, H.E.S.S. has a >20 times better energy flux sensitivity in its core energy range above 300 GeV than the space-based Fermi-LAT has at 1 GeV energies1 (Abdalla et al. 2021a).
H.E.S.S. is conducting follow-up observations of transients since its inauguration in 2003 (see e.g. Aharonian et al. 2009). Dedicated working groups in the collaboration are supporting multi-wavelength efforts and decide on follow-up strategies. This work focuses on the technical developments and features of the automated transients follow-up system that executes the various programmes and strategies.
2.2 Functionalities of a transients follow-up system
The transients follow-up system connects H.E.S.S. with ground-and space-based telescopes and transients data networks such as GCN. Based on the type and properties of newly detected astrophysical transients, the system is designed to dynamically schedule and execute automatic follow-up observations that are tailored to pre-defined science cases. As such, the system has to be able to digest diverse and limited external alert information, and to consider the visibility of objects as well as the ranking of follow-up observations against ongoing or scheduled observations. It is crucial that all parts of the system are smoothly connected, from the reception of alerts, to the reaction of the telescopes, and optimised RTA of the H.E.S.S. data on site. The key functionalities necessary for a successful alert follow-up with H.E.S.S. or other IACTs are described in the following.
2.2.1 Receive alerts via different input channels
Satellites and ground-based telescopes disseminate transients alert information on various timescales via different channels and with varying information content. A flexible follow-up system is therefore required that receives this information and handles the different alert types and their content - a task best addressed by utilising international standards where possible.
2.2.2 Process and rank alerts following a matching with proposal-based science cases
A matching of alert types and triggers from different instruments to science cases and their sub-categories is required to rank alerts and decide if a transient should be observed. The decision is based on the alert information and must take into account the duty cycle of the ground-based instrument and the visibility of the target to propose either starting observations immediately (‘prompt mode’) or changing the observation schedule for the following nights (‘afterglow mode’). In addition, the decision and proposed follow-up strategy may be based on information derived from more complex processing of the original alert information, for example to produce a ‘tiled’ pointing for the observations of transients with a localisation region larger than the H.E.S.S.FoV.
2.2.3 Execute observations according to the needs of the science case
Transients develop on a wide range of time scales, and so does the time required to gather and disseminate reliable information. While some transients are detected and communicated to partners within seconds (e.g. GRBs), other triggers are only issued after minutes to hours due to more time-consuming analyses, human vetting, or other technical reasons. Likewise, H.E.S.S. needs to react promptly or in afterglow mode, depending on the timing of the expected gamma-ray signal of the transient and of the accompanying alert. In case of a prompt follow-up, the fully automatic transition to and execution of the new observations need to be managed.
2.2.4 Provide feedback to experts, scientific community and the system itself
Preliminary science results from the follow-up observations are produced in real time to decide whether to extend or discontinue the observations. Timely preliminary science results of the follow-up are essential for the dissemination of potential new alerts, containing these results, to external facilities.
All these functionalities are covered in the transients follow-up system of H.E.S.S. They are discussed in the following.
2.3 Overview of the H.E.S.S. transients follow-up system
The general functionalities and interfaces between the different parts of the system are summarised in Fig. 1. The majority of tasks are executed fully automatically and handled internally. Human interaction with the system mainly happens through the configuration of subsystems, the monitoring of the system response, generation of reports, as well as vetting of delayed observations by operators.
The ToO alert system acts as a gateway and receives external transient alerts. Upon alert reception, it evaluates the alert properties and matches them with science cases that are part of the H.E.S.S. transients science programme with a number of pre-approved triggers. This task can include more complex calculations and/or the construction of an observation strategy for the follow-up of the transient. The configuration and monitoring of the ToO alert system is handled by the ToO alert system expert. Information about transient alerts that match science cases are provided to respective PIs. If a transients candidate passes all requirements for follow-up observations, it is forwarded to the DAQ for scheduling.
The DAQ ToO system handles the scheduling of accepted follow-up candidates with H.E.S.S. and interacts with the monthly long-term schedule and the observation programme planned for the current night. It receives the details of filtered and ranked ToO candidates from the ToO alert system, stops ongoing observations, initiates the (rapid) slewing of telescopes to the new position and starts the data acquisition in the region of interest. Data is recorded via the DAQ and processed in the RTA.
The RTA performs an online analysis of the live data stream that is received from the cameras, applies online calibration methods, reconstructs the particle shower properties, and selects and displays gamma-ray-like candidate events. The results, including live sky images, are displayed to the operators and stored on a web-page and in an archive for further investigations.
3 The ToO alert system
The ToO alert system (blue section in Fig. 1) listens for new alerts on various data streams from external networks simultaneously and matches them with pre-defined H.E.S.S. science cases. The configurations for each science case define the processing steps and trigger criteria to filter follow-up candidates and to derive the observation strategy and alert prioritisation. More complex alert processing steps are realised in a dedicated pipeline built from modular scripts. The scheduling parameters derived during the processing are then reported to science and operation experts and, in case of automatic follow-up, passed on to the DAQ for immediate follow-up observations. A detailed view of the processing logic that is executed whenever an alert is received is given in Fig. 2. The implementation of the ToO alert system is explained in more detail in Appendix A.
3.1 Receiving and processing alerts
Each transients science programme is realised through a set of configurations. Each configuration applies to a single type of alert and addresses a specific science case (e.g. prompt GRB follow-up). These science case configurations define detailed aspects for the follow-up such as whether a fully automated reaction is allowed, and a time range with respect to the transient event during which this configuration should be used. Moreover, they include scheduling aspects like the maximum time to observe the target, detailed trigger criteria, or a relative ranking of each science configuration. Visibility windows are calculated for all science cases taking into account the zenith angle, sky-darkness constraints, or source properties such as reported fluxes, event counts and localisation uncertainties. This allows the system to be flexibly configured for each science case, but may require multiple updates of the schedule if updated information of a single alert is received. Furthermore, dedicated processing algorithms that for instance match the transient’s location with catalogues or perform more complex calculations are referenced by name with corresponding parameters in the configuration file. A particularly complex case is the algorithm for creating an optimised pointing pattern for the follow-up of Gravitational Wave (GW) events using the correlation of the galaxy distribution in the local Universe with the GW event localisation information, as described in Ashkar et al. (2021) and outlined in Sect. 6. This approach is also used to generate an optimised pointing pattern for large localisation uncertainties from Fermi-GBM alerts. The configuration files specify which processing tasks are executed by the pipeline. This allows one to introduce new processing functions rapidly, without changes to the overall pipeline code and behaviour. Multiple science case configurations may apply to a single alert type.
Configurations are grouped into categories with a common science goal. For instance, the category GRB prompt includes configurations for Swift-BAT, Fermi-GBM, as well as Fermi-LAT alerts. This grouping allows one to match the recipients of scheduling information to the different experts, PIs and/or entire mailing lists. The grouping mechanism is also useful to define test configurations in order to test new processing functions or monitor the system without actively triggering observations. The human-readable scheduling information is appended to a report with dedicated instructions and information based on the assigned group that is sent to the PIs by e-mail. If all processing steps and trigger conditions are fulfilled and the observation strategy has been defined, the follow-up candidate together with the scheduling information is forwarded.
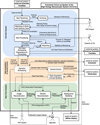 |
Fig. 1 Functional view of the transients follow-up system of H.E.S.S. The main subsystems are the ToO alert system, DAQ, and RTA. The three subsystems are encoded by the blue, orange, and green coloured areas, respectively. The main functions of each subsystem are depicted as well as the interfaces to external systems and experts and operators. |
3.2 Forwarding follow-up candidates
The forwarding of follow-up candidates is split into two modes: the prompt-mode forwarding that initiates a fully automatic start of the observations, and the afterglow mode where experts and operators are informed about the upcoming observation opportunity. Usage of the prompt mode requires that a flag is set in the science case configuration.
The prompt mode requires that the observation window starts within a few minutes and continues for at least 5 min. A fast evaluation of the short-term visibility is carried out to minimise the time to initiate a follow-up. The entire observation window is evaluated only if the visibility criteria are met. In prompt mode, the essential scheduling information is collected and sent to the DAQ. Once the DAQ has received the information, the operators are notified via a pop-up window and an e-mail is sent to a predefined list of recipients.
The afterglow mode alerts the operators with a pop-up window, but no further information is transmitted to the DAQ. The operators, experts and other recipients receive an e-mail with all information about the alert and its scheduling constraints and instructions. Since the ToO Alert System has determined that all criteria for a follow-up are fulfilled, the operators are expected to schedule the observations with the provided information. The e-mail contains a terminal command that can be used by the operators to insert the target into the observation schedule prior to the beginning of the night. In parallel, they can liaise with experts and PIs to discuss whether observations should indeed be pursued, and if so, fine-tune the timing of the ToO observations. The afterglow mode is used for alerts that can be followed up with delays of up to two days.
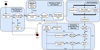 |
Fig. 2 Functional view of the ToO alert system as it reacts to an incoming alert. The main function groups, ‘Alert Receiving and Archiving’, ‘Matching of Alerts and Science Programs’, ‘Alert Processing’ and ‘Scheduling Preparations and Reporting’ are indicated by the four large boxes. The detailed functionality is described in Sect. 3. The mapping of these functions to the implementation is shown in Fig. A.1. |
3.3 Performance
The most important performance metric for the ToO alert system is the time required to fully process an alert. This strongly depends on the complexity of processing functions and algorithms that are being executed. Therefore, we consider two cases:
The follow-up of GRB alerts is among the high-priority use cases of the system, where the visibility window is calculated and a few alert parameters are being used to evaluate, if a follow-up should occur. In such a case, the processing takes around 1-2 s up to the handover to the DAQ. A visualisation of the visibility window is typically created within 4 s, and sent together with the e-mail. In general, the experts and operators receive the e-mail with all the material in less than a minute in such cases.
The most complex of the implemented cases is the gravitational wave alert, which uses a galaxy targeting algorithm and takes significantly longer. Deriving the best first position to start observations usually takes around 30 s, including reading the galaxy catalogue and downloading and analysing the localisation map. Deriving a full tiling pattern can take up to 60 s, depending on how long and how much of the uncertainty region can be observed.
However, these processing times are not the only contribution to the overall delay of the response. There are important, non-negligible delays that are beyond the control of H.E.S.S., such as the delay between the astrophysical event and the reception of the alert. For GRBs, this delay is typically in the range of 30 s and is determined by the on-board detection and download link of the data (Hoischen 2018). In the LIGO/Virgo observation runs O1−O3, the earliest gravitational wave alerts were sent with delays of the order of a few minutes after detection, with potentially larger delays depending on integration time or dependencies on other higher-order analysis results (see e.g. Ashkar et al. 2021, and references therein).
Another key metric is the filtering performance of the system. The ToO alert system receives about 50 000 alerts per month2. Only about 50 alerts are matched with science case configurations, which is a reduction by a factor of 1000.
The availability of the ToO alert system is another critical factor, as no alerts can be received during downtime. A watchdog for the ‘Alert Receiver’ ensures a maximum up-time. Downtime of the order of 20 s occurs every two months when the system is maintained and updated. Rare problems with the internet connection to the H.E.S.S site on the Khomas Highland are another source for downtime.
3.4 Toolkit for validation, development, and alerting
Beyond the core functionality of processing received alerts, a number of useful tasks can be performed with the ToO alert system. Tools are available to generate test alerts that are sent to the Alert Receiver to validate the entire chain of processing alerts up to the start of observations in so-called fire drills (see Sect. 6). Independent of other parts of the H.E.S.S. transients follow-up system, the ToO alert system software can be used in a standalone mode. Large numbers of alerts3 can be processed offline in order to fine-tune and test new science programmes, processing functions and algorithms, to simulate the system response and to support rapid development of new features.
In addition, the ToO alert system supports a fast feedback loop on whether alerts are followed by H.E.S.S. to increase multi-wavelength coverage. It generates new alerts when a ToO follow-up is inserted into the observation schedule (see also next section), comprising information about the underlying external alert and the H.E.S.S. follow-up, such as the applied science case and priority. These alerts are then sent4 to ATOM (Hauser et al. 2004), the robotic optical telescope on the H.E.S.S. site, to trigger simultaneous optical ToO observations (see Fig. 1).
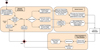 |
Fig. 3 Functional view of the DAQ system as it reacts to a prompt follow-up candidate. The central functions are ‘Dynamic Scheduling’, ‘Central Control’ and ‘Data Acquisition and Event Building’. Further details can be found in Sect. 4. The implementation of these functions as components is described in Appendix B and shown in Fig. B.1. |
4 The DAQ ToO system
The DAQ system (Balzer et al. 2014) steers all hardware and software components taking part in the observations and provides a framework for their monitoring and control, configuration, logging and error handling. The DAQ system is distributed over about 200 processes with dedicated software representations (with ‘Managers’, ‘Controllers’, and ‘Readers’) of the controlled hardware and software components, a central control component organising the execution of the scheduled observation runs, and a collection of databases for the configuration of the DAQ system and the H.E.S.S. array elements. It also provides the central user interfaces in the control room through which operators interact with the H.E.S.S. array. The DAQ system runs on a computing cluster with off-the-shelf components (Zhu et al. 2022) that provide the necessary computing and storage resources. In this section, we give an overview on those components and functions of the DAQ system that have been enhanced with new features for the ToO follow-up.
An overview of the main functions and components of the DAQ system relevant for the ToO follow-up are given in Figs. 3 and B.1, respectively. As the DAQ system is responsible for the operation and integration of all other H.E.S.S. systems, it interfaces with the ToO alert system and the RTA, as well the nightly ‘Scheduler’ and the telescopes, as part of the transients follow-up. The three main functions related to the ToO follow-up are discussed below in relation to their ToO capabilities for prompt alerts, while the implementation of the DAQ ToO system is described in more detail in Appendix B.
4.1 Dynamic scheduling
The DAQ system is responsible for the dynamic scheduling (see Fig. 3) of ToO observations during the night, in response to a follow-up candidate alert received from the ToO alert system. When the automated reaction of the system is active, different reaction schemes are invoked depending on the type of the incoming follow-up candidate and the status of the ongoing observations. If the incoming follow-up candidate can be observed immediately (prompt mode) and has a higher priority than the ongoing observations, a fully automatic execution of the ToO observations is initiated. The type of the prompt alert leads either to the insertion of observations for the new ToO target into the schedule for the night, or to an update of the target position or duration of already ongoing observations without interrupting their execution:
If the new ToO target is located outside a 1.5° radius around the current pointing direction, that is to say close to the edge or outside the field of view of the currently ongoing observations, a new schedule including the ToO observations is prepared, the ongoing observations are stopped, and the ToO observations are started,
if the new ToO target is located within the 1.5° radius, thus well within the current field of view, the duration of the ongoing observations is prolonged without restarting the observations,
if the incoming alert is a position update of a previously received alert that is currently being observed, the telescopes are repointed to the new ToO target position without restarting the observations, only the data acquisition is paused for the duration of the repointing.
In all other cases, the follow-up to the alert is delayed and involves the operators to schedule the observations (afterglow mode). Once the prompt follow-up is initiated, the DAQ system informs all relevant stakeholders, including the operators via pop-ups, the PIs and experts via e-mail, and the ToO alert system for fast feedback to external facilities.
4.2 Central control
The DAQ system’s central control organises the execution ofthe observations and steers the telescopes and participating array components through the observation life cycle. This life cycle typically consists of the stop of the ongoing observations, the distribution of the (new or updated) observation parameters to the available telescopes, the configuration and start of the new observations, and the data taking for its duration (see Fig. 3). For prompt ToO observations, a special ToO observation mode is used that has been optimised for a faster stop-start cycle ofthe observations, thereby increasing the robustness to potential failures of individual hardware and/or software components during the cycle. In addition, the typical life cycle may omit the restarting of the observations altogether depending on the type of alert (see also previous section).
CT5 is not only the H.E.S.S. telescope with the fastest slewing speed, but can also use reverse pointing for ToO observations, so that it can reach almost any position in the sky in less than 1 min (Hofverberg et al. 2013). Furthermore, some aspects of the stop and start procedures of the telescope have been parallelised to speed up the stop-start cycle. The Cherenkov camera, which during non-ToO observations waits until the telescope has reached stable tracking of the target, already starts taking data during ToO observations as soon as the target position enters the field of view of the camera. As a result, CT5 reaches the target and the start of observations significantly faster than the slower CT1−4 telescopes. The DAQ system therefore already starts collecting data for ToO observations when CT5 sends its first data and allows the CT1−4 telescopes to join later during the ongoing observations. The ToO observation mode is also more robust against possible failures of telescopes or other components. In normal observations, data acquisition is interrupted if one of the telescopes fails, allowing the operators to fix the problem and continue with the regular observation schedule. However, for time-sensitive ToO observations, all non-critical components, including the CT1−4 telescopes, are marked as optional, and failures do not abort observations. Once the underlying issues are resolved, any optional component can be added to the observations later.
4.3 Data acquisition and event building
Once the observation starts, the DAQ system continuously processes the telescope-wise event raw data sent from the Cherenkov cameras, performing basic data integrity and quality checks, and builds them into sub-array events in a standard H.E.S.S. data format. The raw telescope data is received and processed by ‘Event Builder’ processes. Each Event Builder process receives a chunk of data from all cameras participating in the sub-array (e.g. CT5-mono, CT1-4 stereo, CT1-5 hybrid), where it is buffered and processed. The receiving Event Builder process is switched every few seconds to distribute the event processing load across multiple Event Builders in the computing cluster, and to support incoming data rates greater than the event processing rate of a single Event Builder. This standard data acquisition scheme did not need to be tailored to the ToO follow-up observations and is capable of handling large amounts of data expected from even the brightest bursts observed in ToO mode (up to ~kHz gamma-ray rates). This data is stored on disk of the on-site data storage for later offline processing. In addition, the events are forwarded in-memory to the RTA where the data is further calibrated and analysed (see Sect. 5).
4.4 DAQ performance
During the nearly two decades of operation of the H.E.S.S. experiment, the DAQ system underwent several major upgrades, both to add new features and to improve its performance and stability. The most recent feature upgrade was the addition of the ToO capabilities described in this work, coupled with an improvement in the response time to alerts, one of the key factors in the follow-up of prompt alerts. As a distributed control system, the DAQ introduces some overhead for inter-process communication and exchange of status information during the steering of the processes participating in the observations. This software overhead now averages to less than 2 s (Balzer et al. 2015) which is insignificant compared to the total response time to a ToO alert. The overall response time during the observation execution is dominated by the stop-start-cycle of the observations and especially by the slewing of the telescopes to the ToO target position. With the fast slewing speed of CT5 and its capability to perform ToO observations with reverse pointing (Hofverberg et al. 2013), the average total response time of the H.E.S.S. array in a fully automatic reaction to prompt ToO alerts is on average less than 1 min for almost any position in the sky.
Another important performance indicator is the failure rate of the prompt follow-up system caused by technical problems of the DAQ system itself, or during the interaction of the DAQ system with other components during the dynamic scheduling and subsequent stop-start life cycle of the observations. While the total loss of observation time attributed to problems with the DAQ system (e.g. due to IACT hardware problems or software errors) is less than 1% (Balzer et al. 2014), the unique nature of transient phenomena makes availability particularly crucial. Most failures in responding to prompt ToO follow-ups have been caused by feature upgrades of the ToO system and resulting changes in the software interface between, and/or behaviour of, the components involved. Rigorous testing of all components and their interaction during fire drills, both after upgrades and at regular intervals, has proven to be very effective at minimising these failures and detecting potential problems at an early stage (see also Sect. 6).
The load on the computing cluster during data acquisition is governed by the processing of the telescope raw data, the subsequent event building and the real-time analysis (see also Sect. 5). In the current setup, the data acquisition is distributed in 25 processes over 5 computing nodes (with an Intel Xeon Silver 4114, 2 × 10 cores with 2.2 GHz, and 96 GB RAM architecture; Zhu et al. 2022) and supports a total event data rate of 2.5−3.0 kHz on average in normal data taking with 5 telescopes with less than 10 and 35% utilisation of the available CPU and memory, respectively. Processing sudden bursts of data from extremely bright transient events, for example, would therefore be possible with the current DAQ system.
5 Real-time analysis
Any transients follow-up system that aims at providing feedback to array operators, other facilities, or the scientific community in general requires real-time analysis of the data being taken. The RTA in H.E.S.S. was developed for Phase I of H.E.S.S. operations, and is described in more detail in Funk (2005) and Balzer et al. (2014). In this section, we focus on the RTA as developed for H.E.S.S. as a hybrid system of telescopes and present key performance parameters. The RTA implementation is described in more detail in Appendix C.
Figure 4 shows the functional view of the RTA in H.E.S.S. It provides the following functionality:
Data access and RTA configuration: the raw events and telescope camera images are built by the Event Builder and fed into the RTA framework. The RTA is configurable, which allows for a dynamic adjustment of RTA properties such as the ‘thinning’ of events to match computing resources. Calibration and analysis settings that set up the RTA to process incoming data with specific settings to, for example, match different sky-brightness conditions like moonless or moderate moonlight nights can also be adjusted.
Data calibration and data quality: the raw camera data is calibrated in real time, including basic identification of camera hardware problems on the pixel level, data quality monitoring and basic error handling. Cherenkov camera shower images are cleaned of night-sky-background noise for further image analysis.
Event reconstruction, classification and background modelling: event properties, such as direction and energy of primary particles are reconstructed in real time based on the RTA-calibrated camera shower images. Fast and powerful event classification and selection of gamma-ray like events is performed based on boosted-decision trees (BDTs Ohm et al. 2009) and neural networks (Murach et al. 2015). Training of the classifiers is performed offline based on Monte-Carlo gamma rays and real background events, and covers the full phase space of observations (sub-arrays, zenith and offset angles, optical efficiencies).
Merging of results and background modelling: The background estimation and signal extraction in the field-of-view and the region of interest is performed per computing node, and for configurable background estimation methods. The current implementation uses the ring background technique (Berge et al. 2007), which produces sky maps such as gamma-ray excess and significance maps. Node-wise results are then sent to a merging process, which accumulates maps and statistics.
Feedback and notification: low-level data analysis results, such as intensity displays of telescope shower images or high-level sky maps, are shown on ‘Online Displays’ in the control room on site. During the ongoing observations, the operators are alerted via sounds and pop-up windows in case the significance at the target position exceeds configurable thresholds that are stored in the ‘DAQ / Scheduling’ database. Archival RTA results are also accumulated to the current observation providing the operators with alerts for longer observations of the same region of the sky (e.g. intra-night, over multiple nights).
Monitoring and archiving: RTA results for the individual observation run and the accumulated archival data set are stored in the ‘RTA Result Archive’ within a few minutes after an observation has concluded in form of statistics and maps in a database and on disk, respectively. They are used through a web-interface in the ‘Offline Display’ for provision to the operators, PIs of ToO programmes and collaboration members. The Offline Display provides the RTA statistics like gamma-ray excess and significance per observed target on intra-night, nightly and monthly basis. Sky maps are stored for offline handling and search for emission in the field-of-view (e.g. following updates of MWL coordinates for transient events) with more advanced methods.
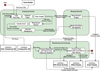 |
Fig. 4 Functional view of the RTA system. The central functionality is described by the boxes: ‘Analysing Events’, ‘Merging Results’ and ‘Monitoring and Archiving’. The details are described in Sect. 5 and Appendix C. |
5.1 RTA performance
The RTA implementation described here has been running on the H.E.S.S. site in Namibia since mid-2016. During this time, the H.E.S.S. array underwent two major upgrades of the Cherenkov cameras. The original HESS-I cameras were replaced with NECTar-based readout chip design cameras in 2015 and 2016 (Ashton et al. 2020). In September 2019, the camera on the CT5 telescope was upgraded to the digital CTA-prototype FlashCam camera (Pühlhofer et al. 2019). In particular for the latter camera replacement, the RTA was prepared in advance of the upgrade, allowing it to detect the Crab Nebula in the first night of full operation5.
Figure 5 shows the memory and CPU usage of the Analyser and Event Builder processes, averaged over all computing nodes, during one H.E.S.S. observing shift. The bottom panels show the standard deviation of the load over the computing nodes, and demonstrate a stable and smooth operation across cluster machines with event rates reaching 3 kHz. We note that this metric already covers an observing month during which the CTA prototype FlashCam camera was operational in the array (Pühlhofer et al. 2019).
A benchmark of the Analyser process results in the following metrics in terms of CPU needs: the data loading (~ 15 %), pixel calibration (~ 40 %) and shower image cleaning (~ 15 %) require the largest resources with a total of ~ 65 %. The shower reconstruction (~ 5 %) and background suppression (~ 10 %), on the other hand, only require ~ 15 % of the total CPU needs. Also the background modelling contributes at a lower level of ~ 20 %.
The sensitivity of the RTA has been studied by comparing the achieved RTA performance with the full off-site analysis performance, using Crab Nebula observations conducted under different observing conditions, and with different sub-arrays with data acquired between 2017 and 2019 using the previously installed CT5 camera (Bolmont et al. 2014). Figure 6 shows the significance per square root of observation time for Crab observations at various zenith and offset angles. The RTA can detect a Crab-Nebula-like gamma-ray source in less than a minute of observation time. Within a typical 30 min observation run, sources with a strength of ~ 5 % of the Crab Nebula can be detected. As the energy threshold increases with increasing offset to the centre of the camera, the total significance per square root hour decreases by a factor of ~ 4 from on-axis observations to the edge of the FoV of the CT5 camera at ~ 1.5 degrees in a CT5 mono analysis. The sensitivity of the RTA is in general comparable to the off-site analysis within 25 %. The sensitivity achieved as a function of zenith angle confirms this behaviour, and demonstrates that the RTA response is stable using default calibration coefficients and the running-pedestal estimation (cf. Funk 2005). A real-time evaluation of calibration coefficients was not deemed necessary, given the overall excellent RTA sensitivity achieved. The agreement between RTA and off-site analysis also suggests that both analyses achieve comparable energy thresholds. In the core energy range, between 80 GeV and 10 TeV, we do not expect a significant difference with the results that will be obtained using the newly installed FlashCam camera. First studies conducted with limited data sets confirm this assumption.
We studied the RTA background systematics in deep observations at the sensitivity limit of H.E.S.S. Figure 7 shows significance maps, including and excluding the source regions, as well as their corresponding ID distributions across the FoV for a 50-h data set taken on the blazar PKS 2155−304 with the full CTl−5 array. While some structures at significance levels of ~4σ are visible, the overall background is under control and no region in the sky shows significant emission beyond 5σ. The RTA has to rely on observations of empty FoVs to construct the background model whereas in the off-site analysis the background model is constructed from a full observation run. This explains the somewhat increased systematics in the background estimation as apparent in the significance distributions.
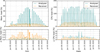 |
Fig. 5 DAQ computing cluster performance during data taking. Top panel: average memory (left) and CPU load (right) per night of the physical computing nodes. Bottom panel: standard deviation of the memory (left) and CPU (right) load of the computing nodes. We note that 100% CPU load corresponds to one of the 20 available cores per CPU. The ‘Analyser’ process does the bulk data processing, while the ‘Receiver’ process is responsible for data reception in the Event Builder. |
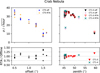 |
Fig. 6 Sensitivity expressed in terms of signal recorded per |

5.2 Future RTA improvements
Further improvements to the RTA can be envisaged in several domains. The installation of more computing resources could allow us to improve the overall sensitivity of the RTA by exploiting state-of-the-art pixel-wise likelihood analysis techniques. However, the expected sensitivity improvement of ≲25% is rather moderate, requiring a careful consideration whether the additional investment in on-site computing hardware resources is justified for the science cases at hand. The background systematics for deep observations could be further reduced by using more realistic calibration coefficients and/or by matching the background models to the calibration procedure on site (at the moment, the off-site calibration and classification is assumed for the on-site background model). Furthermore, more advanced data quality checks and even corrections could be implemented to further improve the detection and treatment of hardware defects in the RTA. Employing pixel-wise likelihood techniques or pixel-based deep-learning methods (Shilon et al. 2019; Steppa & Holch 2019; Parsons & Ohm 2020) in the RTA will require a careful assessment of the impact of turned-off or broken pixels, as well as differences between calibration coefficients used in the RTA and those assumed in the deep-learning method, for example.
Currently, sky maps of significance and gamma-ray excess, as well as distributions of excess events as a function of squared distance to the source of interest, are displayed to the on-site observers. It would also be straightforward to implement preliminary gamma-ray source flux estimates and implement features to derive longer-term gamma-ray light curves that can be correlated with long-term light curves of sources of interest in other wavelength bands. Furthermore, at the moment, sky maps shown to the observers are updated every 30 s to 1 min, while RTA results stored in the archive only capture the integrated maps over the duration of an observing run. Storing additionally the gamma-ray candidate event list would allow one to re-process the RTA results offline and to implement additional features such as the search for shorter-term transients with tools such as the ones used in the H.E.S.S. Extragalactic Survey (HEGS6, Brun et al. 2020). Another future extension could be envisaged adopting a FoV-wide search for serendipitously detected transients or a combination of RTA results across larger sky areas to search for gamma-ray emission from transients with poor localisation as discussed in the next section.
Based on pre-defined trigger criteria and for certain transients science cases, the H.E.S.S. on-site operators are instructed to monitor the RTA output while data is being taken and to manually prolong observations. A link of the RTA to the ToO alert system is envisaged and currently explored in H.E.S.S. An automatic prolongation of ongoing observations could be realised via an interface between the ToO alert system and the RTA. For instance, the RTA could send observation results shortly before the end of an observation run to the ToO alert system in the form of an (VO) alert. The ToO alert system will evaluate this alert and determine if the results warrant continued observations for the currently ongoing science case.
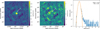 |
Fig. 7 Significance map, including the source region (left), and excluding the source region (middle) for 50 h of PKS 2155−304 observations conducted with the full CTl−5 array (pre-FlashCam upgrade). Right plot: 1D distribution of the significance (blue) and excluded significance (orange) maps. The mean and rms of a fit of a one-dimensional Gaussian function to the excluded significance distribution are also shown. |
6 The H.E.S.S. transients follow-up system in real-world applications
The real strength of the transients follow-up system originates from the interplay of the three subsystems described in the previous sections. The interplay can best be illustrated by looking at real-world use cases, which are commonly exploited by H.E.S.S. and other IACTs, and which highlight the core features of the system. While the entirety of the transients follow-up system functionalities are predefined, each science case uses a different subset of functionalities to allow for an optimal reaction of the telescope system. Follow-up observations of GRBs and GW events are two prominent examples for transients follow-up programmes. Due to the short-lived nature of GRBs and GW events, a fast response of the full transients follow-up system is essential. Moreover, since the localisation accuracy of GW events is typically similar to or even larger than the H.E.S.S. FoV, an optimised pointing strategy of the H.E.S.S. telescopes needs to be employed. In the following, we discuss the system response to a prompt GRB alert, and to a GW trigger. Applications to other science cases make use of either most or at least some of the components and steps described here.
6.1 GRB follow-up observations
The main use-case of the transients follow-up system is the prompt reaction to a short-lived transient, such as a GRB. In practise, this is how the system would respond to a GRB trigger issued by the X-ray satellite experiment Swifi-BAT (Barthelmy et al. 2005):
The Swift-BAT detects a GRB, relays the trigger to a ground station, from where a public alert is issued. This process typically takes a few tens of seconds.
The ToO alert system receives the alert and initiates the alert processing.
The ToO alert system tests all science cases that are applicable to a Swifi-BAT GRB alert. For simplicity, we here assume that two cases apply: if the GRB is immediately observable for H.E.S.S., a prompt follow-up is triggered, if the GRB is observable later and within a pre-defined time frame, an afterglow follow-up is considered.
The trigger criteria (e.g. source brightness and distance, maximum observation delay, zenith angle, sky brightness) are evaluated by the ToO alert system.
The observation window is calculated. We assume that under the pre-defined conditions, the GRB position is visible immediately and for at least 5 min from the H.E.S.S. site.
All relevant alert parameters are sent to the DAQ for scheduling. The operators are informed about the GRB alert by sounds and pop-up windows. Supplementary GRB alert information is distributed by e-mail to Pis and experts.
The target is inserted into the current schedule for immediate observations. The current observations are stopped and removed from the schedule. Based on the ToO target parameters, the telescopes and RTA are configured.
The fastest slewing path for CT5 is determined and used for CT5. The observations and data recording starts as soon as the target enters the CT5 FoV. CT1−4 join the observation once they slewed to the GRB position.
Air shower events are recorded by the DAQ, camera images are calibrated by the RTA and reconstructed to derive main shower event properties.
Gamma-ray like events are selected and filled into a sky image that is constantly updated and shown to the operators. The RTA checks if significant gamma-ray emission is detected from the GRB position and alerts the operators if certain significance thresholds are exceeded.
The operators are monitoring the RTA results and contact the GRB expert on call to discuss further optimisations of the follow-up observations.
The RTA results are written into a database for offline usage.
Often, the location of a GRB is not visible right away (afterglow follow-up). In these cases, the sequence of events differs at point 5:
- 5
The observation window is calculated. The position is visible starting in 2 h, for example.
- 6
The operators are alerted by sound and pop-up windows. Supplementary information is distributed by e-mail to PIs and experts.
- 7
The GRB expert on call reviews the follow-up opportunity, checks regularly for additional MWL information, and decides whether or not to carry out the observations as recommended by the ToO alert system. If an alert retraction is received before the start of observations, the expert cancels the follow-up.
- 8
As the start of the observation window approaches, operators schedule and initiate follow-up observations by running the script provided by the ToO alert system.
From here on, the sequence continues as in the case of a reaction to prompt alerts from point 9. Over the course of the following day, additional MWL information and RTA results are assessed by the GRB expert on call and a decision for or against a continuation of the follow-up campaign is made.
6.2 Handling of alert updates
The localisation uncertainty of Swift-BAT-detected GRBs is typically much smaller than the FoV of H.E.S.S. Updated information for such alerts hence rarely changes the decision and implementation of H.E.S.S. observations on the timescale of the early GRB afterglow emission and the subsequent follow-up. However, alert information of instruments with poorer localisation capabilities are usually issued in a more complex way, which requires the handling of several corner cases.
Fermi-GBM GRB alerts, for example, are typically issued in a sequence of alerts. The sequence can contain several ground position alert updates with changing reconstructed GRB positions. A final position estimate notice will not be generated for every GRB detected by the GBM. The localisation uncertainty of GBM-detected GRBs is often as large as, or even larger than, the H.E.S.S. FoV. The target coordinates may be updated a few times in quick succession, in some cases even outside the FoV that H.E.S.S. is currently observing. A potential counterpart can therefore emerge anywhere in the FoV. As described in the individual subsystem sections, the H.E.S.S. follow-up system is well equipped to address these cases of receiving sequences of alerts with updated coordinates. Naturally, it is possible, that the same event is detected by the Swift-BAT, which typically provides a smaller localisation uncertainty. These complications are mitigated through a higher prioritisation of Swift GRB alerts.
6.3 Gravitational wave follow-up observations
The follow-up of GW triggers with H.E.S.S. is realised in a similar way as the GRB follow-up in that prompt and afterglow observations are typically initiated. However, another level of complexity needs to be handled by the system, namely the provisioning and handling of 2D and/or 3D uncertainty maps by LIGO/Virgo, for instance. As the localisation region is often of O(l00deg2) large, an optimised pattern of ordered telescope pointing positions needs to be defined. The modular and flexible design of the H.E.S.S. transients follow-up system allows for the easy integration of tailored and optimised algorithms to find the optimum pointing pattern. In the case of GW alerts, the transients follow-up system correlates the 3D localisation information with publicly available galaxy catalogues to maximise the chances to follow-up on potential counterparts. The detailed design, implementation and performance of this algorithm is described in Ashkar et al. (2021). This algorithm has proven its capabilities in the follow-up of GW170817, for which the first observation region covered the later-confirmed binary neutron star merger position in the galaxy NGC 4993 (Abbott et al. 2017; Abdalla et al. 2017). During the GW observations, a counterpart in the RTA can emerge anywhere in the FoV of each of the scheduled observation regions. An automatic search of the entire RTA FoV and subsequent schedule adjustments based on the location of significant detection are not yet implemented (see also Sect. 5), so manual intervention by the operators is required to continue observations in this area.
GW alerts can also be sent out in sequences with updates to the localisation. Each alert in the sequence can change the optimised pointing pattern that should be followed. As GW alerts are followed up by a large number of instruments and observatories, the MWL information distributed in the community is manifold and can contain a much better localised counterpart candidate. As this information is, however, often not disseminated in machine-readable format, it makes an automatic handling of updated MWL information in the H.E.S.S. transients follow-up system challenging. At least for the moment, it requires experts to manage this information and instruct the H.E.S.S. telescope operators accordingly.
For all alerts that H.E.S.S. receives and that are later retracted by the issuing instrument, operators are informed and H.E.S.S. observations are stopped. A future extension of the GW follow-up algorithm could include updates of the pointing positions based on already observed FoVs and updates to the localisation.
6.4 Validation and maintenance
With new science cases being regularly added to the portfolio, the variety of targets and their different follow-up strategies, the transients follow-up system has to be continuously validated and tested. This is particularly true for the interplay of the three subsystems. For this purpose, end-to-end system tests (so-called ‘fire drills’) are executed on a regular basis. In a fire drill, an alert with randomised coordinates is generated and sent to the ToO alert system. The tests are configured such that these self-generated alerts trigger observations for 5 min, allowing one to validate all stages of the follow-up: receiving an alert, matching the science case, validating the observability, handover of the alert parameters to the DAQ, changing the observation schedule, repointing of the telescopes and starting of the observations, and receiving high-level results through the RTA.
Such tests are executed at least once per observing period under changing conditions to verify the systems integrity in (a combination of) various states:
At the end of a regular observing run, during run transitions or calibration runs,
with telescopes in a single or in multiple sub-arrays,
during astronomical darkness or during moderate moonlight,
with only a subset of the telescopes performing observations.
In addition to the tests in the production system, an off-site test setup is available and running on a scaled-down version of the on-site infrastructure (Zhu et al. 2022). This includes computing and storage nodes, switches, as well as the firewall. Key components like the RTA, VO system and DAQ ToO system with reduced functionality provide a development environment to ingest test alerts for testing new ToO system features, or re-running the RTA on existing data and testing new RTA features. It allows developers to validate changes and the interface integrity before new versions are deployed on site.
The overall maintenance effort for the system is small, with a varying level of maintenance being allocated to the three subsystems. In particular the ToO Alert System needs regular updates due to the implementation of new science cases, changes to existing configurations or, going beyond maintenance, new processing features being developed to allow for more complex triggering schemes. In addition, the interface to the different instruments and alert stream channels may need to be adapted to changes in the metadata and data model of the incoming alerts. The interfaces between the ToO alert system, the DAQ and the H.E.S.S. Scheduler have been identified as critical, as any change in one of the subsystems can cause undesirable side effects in the other subsystems and lead to a failure of the follow-up. The installation of new H.E.S.S. hardware, in particular new Cherenkov cameras, requires the implementation and testing of the correct instrument reaction to the desired behaviour. The RTA also has to be adapted whenever the operation modes of H.E.S.S. change, and/or new components are installed. For instance, the introduction of observations under moderate moonlight with lower camera gain settings required an update of the instrument response functions.
7 Conclusions and outlook
The H.E.S.S. transients follow-up system, which is a versatile and flexible system for the observations of transient objects with H.E.S.S. following multi-wavelength and multi-messenger triggers, is composed of the ToO alert system, as well as ToO-specific functions of DAQ and RTA that were added as an extension to the existing H.E.S.S. system. The design of the transients’ follow-up system was driven by the variety of the transient events, their duration (from seconds to hours and days), and the desired reaction of H.E.S.S. to these alerts. The division into different subsystems with clear interfaces was guided by their core functionalities allowing for flexible extension of features. For instance, adding a new prompt science case does not usually require any changes to DAQ, RTA, or any of the interfaces. Considering and implementing corner cases (see Sect. 4) from the beginning was key to limiting development work during operation. The full system has been in stable operation since 2017 and is an important cornerstone for the science observations of H.E.S.S. transients.
7.1 Recent science results
The interplay of the different components guarantees an optimal behaviour of the H.E.S.S. transients’ follow-up system: the fastest possible reaction through automation, correct handling of the corner cases, and the RTA can guide the decision on whether to continue observations. The system has allowed H.E.S.S. to further develop long-standing ToO programmes such as the search for GRBs (see e.g. Aharonian et al. 2009) and to actively participate in many large multi-instrument follow-up campaigns, as well as to probe new terrain with many exciting results, including:
GW 170817 (gravitational wave), rapid follow-up of the first binary neutron-star merger, with the later identified event in the FoV of the first pointing position (H.E.S.S. Collaboration 2017b; Abbott et al. 2017; Abdalla et al. 2017);
IC 170922A (high-energy neutrino), rapid follow-up and monitoring after a neutrino alert, spatially and temporally coincident with the flare of TXS 0506+056 (H.E.S.S. Collaboration 2017a; IceCube Collaboration and others 2018);
GRB 190829A (gamma-ray burst), rapid follow-up of the GRB with detection in the RTA in two consecutive nights (H.E.S.S. Collaboration 2021a; Abdalla et al. 2021a);
SGR 1935+2154 (soft gamma-ray repeater), follow-up triggered through correlation of a Swift-BAT alert with a catalogue of SGR candidates (Abdalla et al. 2021b);
RS Ophiuchi (galactic nova), follow-up with an RTA detection that guided the monitoring campaign (H.E.S.S. Collaboration 2021b,c, 2022); and
PKS 0346-27 (high-redshift AGN), follow-up of the flaring AGN PKS 0346-27 at a redshift of ~1 in a monitoring campaign using feedback from RTA (H.E.S.S. Collaboration 2021d).
7.2 Future developments in the field
Many of the transients’ science cases implemented in the H.E.S.S. observation programme are automatically monitored and processed by the ToO alert system. In some cases, however, H.E.S.S. still relies on PIs to monitor services such as astronomer’s telegrams or GCN circulars that provide observational results in non-machine-readable format, and then manually request ToO follow-up observations to be included in the observation schedule. More homogeneous and automated handling, and thus a faster response to alerts, could be achieved if more alerts were submitted in machine-readable format. For example, services such as the Transients Name Server (TNS)7 provide machine-readable access to a variety of reports and measurements of transient events. Speeding up the announcement of public alerts may help other facilities decide earlier whether they also want to follow up on a particular event. Improved and regular reporting by facilities on the start of the follow-up observations could also enable for more frequent multi-wavelength and multi-instrument coverage. This, of course, depends on the different observatories and instruments as well as their policies, and this relies on strong international standards, as promoted through international astronomical organisations, such as the International Astronomical Union (IAU8) and International Virtual Observatory Alliance (IVOA9), for the communication of the results and the sharing of the observation schedules10.
Complex calculations or follow-up algorithms such as the convolution of uncertainties in GW localisation with galaxy catalogues or the correlation of (sub-threshold) alerts are often realised individually in every experiment. However, international networks in which representatives of different instruments and infrastructures can contribute could reduce some of the effort, increase synergies, and provide centralised and optimised algorithms. Some infrastructures are already exploring such options by developing or supporting community brokers that take the full stream of variable objects and enrich or classify transients for public alerts (e.g. Smith et al. 2013). Another aspect that needs improvement concerns the sharing of follow-up decisions and observation schedules. Rapidly sharing each instrument’s decision on whether to follow up on certain alerts would allow for near real-time coordination of the follow-up strategies for multiple instruments. Ideally, the additional publication and broader sharing of schedules would help to increase the multi-wavelength coverage for follow-up observations whilst optimising the available and limited observation time of the instruments. For instance, H.E.S.S. can use ATOM for simultaneous optical observations of interesting objects. The scientific prospects for brokering follow-up requests between instruments are clear, but so are the challenges for the technical implementation, coordination, and policies.
7.3 Multi-wavelength outlook
The landscape of instruments and infrastructures that monitor the sky for variable objects will change dramatically in the coming years. New survey instruments will become operational for essentially every wavelength range, such as the Square Kilometer Array (SKA; Carilli & Rawlings 2004) in the radio band, the Rubin Observatory (Ivezić et al. 2019) in the optical wavelength range, or the Space Variable Objects Monitor (SVOM; Atteia et al. 2022) probing the X-ray sky. With the improved sensitivity of all of these instruments, transients’ follow-up programmes are confronted with an avalanche of alerts on newly discovered transient objects. Some estimates range as high as one million transient detections per night. With such alert rates, the pre-processing, classification, and filtering of alerts will be an essential task in the network between survey and follow-up instruments. Community or service brokers will be mandatory to provide sub-streams of alerts for events classified as belonging to specific astrophysical object classes. Such sub-streams will play a vital role in reducing the rate of new alerts to a manageable level, and also for instruments probing the VHE gamma-ray sky.
The next-generation Cherenkov Telescope Array (CTA) Observatory will probe the energy range from tens of GeV to ~ 100 TeV (Cherenkov Telescope Array Consortium et al. 2019) and it is currently in the construction phase. The large number of telescopes will allow for observations in multiple sub-arrays simultaneously - a key factor in either speeding up the scanning of large uncertainty regions or following multiple alerts at the same time. Transients-handling functionality is foreseen both at the level of an individual array location (Oya et al. 2019) and at the observatory level to enable coordinated responses from the two planned sites, as well as pre-processing in complex follow-up cases. CTA will be operated as an open observatory, which will result in many new use cases for the CTA transients’ follow-up system throughout the years of operation - just as the H.E.S.S. transients’ follow-up system is still continuously being extended in terms of functionality and science-case implementation.
Acknowledgements
We would like to thank all members of the H.E.S.S. collaboration for their technical support, helpful discussions, and the quick adoption of the H.E.S.S. transients follow-up system which triggered growing demands and further development of new features. The frequent use and enthusiasm for new possibilities allowed for the continuous expansion of the systems features and made it the success that it is. We would also like to thank the referee, Daniela Dorner, for her very constructive feedback, which significantly improved the manuscript.
Appendix A ToO alert system implementation
The receiving and initial filtering of the alert is done in the Alert Receiver, while a ‘Processing Pipeline’ implements the remaining tasks. Figure A.1 shows the technical implementation of the ToO alert system.
Appendix A.1: Alert Receiver
The Alert Receiver is implemented as an instance of the open-source Comet (Swinbank 2014) software, which provides all needed functionality to broker VoEvent2.0 (Petroff et al. 2017; Allan et al. 2017), the current IVOA standard for time-domain alerts. We utilise the voevent-parse python package (Staley 2014) to access the alert contents throughout the ToO alert system. A custom plugin to Comet archives the alerts it receives and starts the Processing Pipeline as a new process. This way, the Alert Receiver stays available for new alerts and multiple alerts can processed in parallel. Comet provides a number of useful functions that are used in the implementation of the Alert Receiver, such as filtering duplicate alerts and checking against a list of trusted IPs that are allowed to send alerts. Received alerts are written into the alert archive and handed to the Processing Pipeline for further analysis. The receiver archives all incoming alerts independent of the configured science cases, since the matching to the science cases happens only in the Processing Pipeline where unsupported alerts are dropped.
The Alert Receiver is configured with subscriptions to multiple data streams, among them the GCN, 4PiSky (Staley & Fender 2016) and the TAToO (Ageron et al. 2012) system of the Mediterranean neutrino telescope Antares. Furthermore, a number of IPs are explicitly allowed for direct submission of alerts, such as the IPs from the IceCube computing clusters at the University of Wisconsin-Madison, which are running the IceCube real-time alert system (Aartsen et al. 2017), and IPs from ATOM, the robotic optical telescope located at the H.E.S.S. site.
Appendix A.2: Processing Pipeline
The Processing Pipeline comprises a collection of science case configurations and modular processing scripts, and performs three main tasks: the matching of incoming alerts to science cases, the actual processing and evaluation of trigger conditions, and, finally, the preparation of the observation strategy and forwarding of the scheduling information of the follow-up candidate to the DAQ system, the operators and experts.
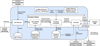 |
Fig. A.1 Implementation view of the ToO Alert system. The ‘Receiving’, ‘Archiving’, and ToO Alert Scheduling Preparation functions map directly to components in the implementation. The Processing Pipeline implements the Matching of Alerts and Science Programs matching, the Alert Processing and the Scheduling Preparation. The Assessment of the Visibility function, for instance, maps to the Processor & Evaluator module in the pipeline. |
Appendix B DAQ ToO system implementation
Figure B.1 shows the main components of the DAQ ToO system, the ‘VO Controller’ and the ‘Run Manager’ that were added or updated, respectively, to enable the fully automatic ToO follow-up.
Appendix B.1: Dynamic Scheduling
The VO Controller (see Fig. B.1) connects the DAQ system to the ToO alert system. It receives and processes follow-up candidate alerts from the ToO alert system, checks their type and priority, queues them for later execution if needed and otherwise passes them to the Run Manager for immediate execution. This mechanism allows queued alerts to be executed at a later stage in order of their priority. Currently, this only affects non-prompt alerts, since prompt alerts have the highest priority according to the H.E.S.S. policy and can interrupt ongoing observations. In the rare case where multiple updates of the follow-up candidate for the same underlying object are received, the VO Controller grants a built-in grace period of a few tens of seconds for buffering and filtering before forwarding the final alert to the Run Manager. This allows the already initiated stop-start cycle to be properly completed before the updates are carried out in one go rather than in several steps. In addition, the reaction to prompt follow-up alerts can be switched on and off via the VO Controller, which is connected to a corresponding switch in the operator’s user interface. The Run Manager steers the observations in the various telescope sub-arrays. It reads and holds the list of the scheduled and ongoing observations and is responsible for updating and distributing the observation parameters to each sub-array. For each incoming alert, the Run Manager produces new or updated observation parameters depending on the type of the alert and distributes them together with the alert information to the Sub-Array Managers that will further execute the observations. When it receives a prompt alert for a new ToO target from the VO Controller, the Run Manager calls the Scheduler via a dedicated ‘ToO Scheduling Script’ to create a new schedule for the night using the alert parameters and the available telescopes tracked via the ‘Resource Handler’. The updated schedule is stored in a scheduling database where it is available to the Run Manager during execution. The Run Manager notifies the operators using sound and pop-up windows with extended information on the alert and scheduling parameters in case of prompt or afterglow follow-up candidates. The ToO Scheduling Script called by the Run Manager is the same script that the operators can use to manually initiate delayed ToO observations following an afterglow alert based on the scheduling information given in the pop-up window. The Run Manager also sends the relevant information to the RTA so that it can prepare a ToO-optimised analysis pipeline (see also Sec. 5) and informs the PIs and experts via e-mail, and, according to H.E.S.S. policies, external facilities (e.g. ATOM) via VOEvent messages using the Comet infrastructure of the ToO alert system about the imminent follow-up observations.
Appendix B.2: Central Control
Before the observations start, the Run Manager checks the available telescopes and compares them with the telescopes specified in the distributed run parameters for the observations. If the request cannot be met, the observations are not started. Since (prompt) ToO observations have the highest priority and to achieve highest coverage, the current dedicated ToO observation mode requires that at least one telescope is available. After the start of the run, it is then up to the operators to decide whether ToO observations should continue, even if conditions are unfavourable (e.g. if only one of the CT1-4 telescopes is available). The dedicated ToO observation mode is part of the run parameters further distributed from the Run Manager to the Sub-Array Managers (see Fig. B.1). These are responsible for executing the observations in the respective group of telescopes and interact with the Controllers of the telescopes, and their components (e.g. drive, Cherenkov camera) to perform the stop-start cycle and track their status during the observation execution. While the interactions between the telescope’s drive and Cherenkov camera described above are handled directly by the respective Controllers, it is the Sub-Array Managers that keep track of which components are part of the observations, what their status is and whether they are required or optional. The parameters of the ToO observation mode and the dependency of the components are easily configurable via databases, from which they are read by the Sub-Array Manager or the supporting ‘Dependency Handler’process.
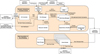 |
Fig. B.1 Implementation view of the DAQ ToO system. The Dynamic Scheduling and Central Control functions are implemented in a common component. The Run Manager is the central component that takes input from the VO Controller, interacts with the Scheduler and initiates the ‘Sub-Array Managers’. The Data Acquisition and Event Building function is implemented in a component that manages the many Event Builders. |
Appendix C RTA implementation
The RTA pipeline was designed to use as many processing components of the (long-established and versatile) H.E.S.S. software as possible and to only adapt methods where strictly necessary. This concerns all levels of the data analysis pipeline, from pixel calibration to event reconstruction and generation of high-level analysis products such as sky maps. The RTA implementation follows a modular approach to be able to a) distribute processing steps across computing nodes, and b) exchange each computing step with a dedicated real-time algorithm to improve speed.
Figure C.1 shows the implementation of the RTA in the on-site computing cluster, where it runs alongside the Event Builder (see Sec. 4). The RTA is operating on the distributed system of computing nodes that also perform the event building (see Sec. 4). The stream of raw camera data, which is provided by one Event Builder for 4 seconds before switching to the next Event Builder on another computing node, enters the corresponding Analyser process. This process is configurable by the ‘Configuration DB’ and the DAQ / Scheduling DB, which support the operation of the RTA in different sub-arrays and analysis setups. For instance, for all observations that are marked as type ‘ToO observations’, a CT5 mono analysis is set up, which allows for the lowest possible energy threshold, while sacrificing some performance of the array at higher energies. For regular observations, a hybrid analysis is initiated, which provides improved sensitivity in the core energy range of H.E.S.S. around 1 TeV. Similar to the regular H.E.S.S. off-site analysis, a modular chain of software tasks is set up, in which each Analyser process performs the event-wise pixel calibration, cleaning of shower images from NSB noise, the reconstruction of the air shower, and event classification. Gamma-ray candidate events that pass the signal-background separation are filled into sky maps.
The Analyser process implements the ‘Analysing events’ stage in the RTA functionality diagram in Fig. 4. Objects storing the cleaned shower images and node-wise sky maps and statistics at the target position are sent from the Analyser, running on multiple computing nodes, to a single ‘Accumulator’ process that merges all the information from one sub-array.
This process is also configurable via the DAQ / Scheduling DB and the Configuration DB, which, for instance, set the pace for sending camera images for events to the Online Display that the operators monitor during data taking. The merged sky maps and statistics are sent to two separate processes: the ‘RunAnal-ysis’ and the ‘TotalAnalysis’ process. Both processes perform the background estimation in the field-of-view by applying the ring background technique to the merged sky maps as provided by the Accumulator process. While the RunAnalysis process merges intra-observation information, the TotalAnalysis process also loads archival data from the ‘RTA Results Archive’ and the same field-of-view at the beginning of the observation and hence accumulates RTA results from more than one observation. The maximum look-back time is configurable and is by default set to twenty observations per target. Observations are typically conducted in 28 min chunks on a single position. With the help of the Configuration DB, the pace at which the RunAnalysis and TotalAnalysis processes calculate significance maps and derive plots of the squared angular distribution of event arrival directions with respect to the target position can be set. While the significance at the target position is accumulated continuously, the RunAnalysis and TotalAnalysis processes check if the significance at the target position exceeds configurable thresholds, in which case it alerts the operators with sounds and pop-up windows in the Online Display. At the end of the observation, and when the transition to a new observation is started, an ‘Analysis-Finisher’ process is launched that produces final sky maps and statistics for the current observation, and accumulates archival data as described before. The ‘RTA Result Archive’ is filled with the observation result and the accumulated result for this field-of-view for further inspection. The AnalysisFinisher process runs independently of the ongoing observation and therefore does not delay the initialisation and start of a new observation.
The on-site computing resources described in Sec. 4 allow for fast event building and calibration as well as shower reconstruction and classification. The RTA uses a dedicated real-time algorithm for the pixel intensity calculation, based on a running pedestal subtraction (Funk 2005), and assumes fixed calibration coefficients (flatfielding, ADC-to-pe ratio, High-Low-ratio) for the pixel-to-pixel response. Although state-of-the-art pixel-wise likelihood analysis techniques such as ‘ImPACT’ or the ‘model analysis’ are not yet used on-site, other machine-learning techniques are used in the reconstruction and classification (Ohm et al. 2009; Murach et al. 2015).
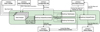 |
Fig. C.1 Implementation view of the RTA. The main functions of the RTA are implemented in a single Pipeline that manages many ‘Node Analysers’ in order to receive input from the many Event Builders in the DAQ and Central Control system. |
References
- Aartsen, M., Ackermann, M., Adams, J., et al. 2017, Astropart. Phys., 92, 30 [NASA ADS] [CrossRef] [Google Scholar]
- Abbott, B. P., Abbott, R., Abbott, T., et al. 2017, Phys. Rev. Lett., 119, 161101 [CrossRef] [Google Scholar]
- Abdalla, H., Abramowski, A., Aharonian, F., et al. 2017, ApJ, 850, L22 [NASA ADS] [CrossRef] [Google Scholar]
- Abdalla, H., Aharonian, F., Benkhali, F. A., et al. 2021a, Science, 372, 1081 [NASA ADS] [CrossRef] [Google Scholar]
- Abdalla, H., Aharonian, F., Benkhali, F. A., et al. 2021b, ApJ, 919, 106 [NASA ADS] [CrossRef] [Google Scholar]
- Ageron, M., Aguilar, J., Al Samarai, I., et al. 2012, Astropart. Phys., 35, 530 [NASA ADS] [CrossRef] [Google Scholar]
- Aharonian, F., Akhperjanian, A., De Almeida, U. B., et al. 2009, A&A, 495, 505 [NASA ADS] [CrossRef] [EDP Sciences] [Google Scholar]
- Allan, A., Denny, R. B., & Swinbank, J. D. 2017, VOEvent Transport Protocol Version 2.0, IVOA Recommendation [Google Scholar]
- Ashkar, H., Brun, F., Füßling, M., et al. 2021, J. Cosmol. Astropart. Phys., 2021, 045 [CrossRef] [Google Scholar]
- Ashton, T., Backes, M., Balzer, A., et al. 2020, Astropart. Phys., 118, 102425 [NASA ADS] [CrossRef] [Google Scholar]
- Atteia, J. L., Cordier, B., & Wei, J. 2022, Int. J. Mod. Phys. D, 31, 2230008 [NASA ADS] [CrossRef] [Google Scholar]
- Balzer, A., Füßling, M., Gajdus, M., et al. 2014, Astropart. Phys., 54, 67 [NASA ADS] [CrossRef] [Google Scholar]
- Balzer, A., Füßling, M., Hofverberg, P., & Parsons, R. D. 2015, J. Phys. Conf. Ser., 664, 082002 [NASA ADS] [CrossRef] [Google Scholar]
- Barthelmy, S. 2008, Astron. Nachr. Astron. Notes, 329, 340 [NASA ADS] [CrossRef] [Google Scholar]
- Barthelmy, S. D., Barbier, L. M., Cummings, J. R., et al. 2005, Space Sci. Rev., 120, 143 [Google Scholar]
- Berge, D., Funk, S., & Hinton, J. 2007, A&A, 466, 1219 [CrossRef] [EDP Sciences] [Google Scholar]
- Bolmont, J., Corona, P., Gauron, P., et al. 2014, Nucl. Instrum. Methods Phys. Res. A, 761, 46 [CrossRef] [Google Scholar]
- Brun, F., Piel, Q., de Naurois, M., & Bernhard, S. 2020, Astropart. Phys., 118, 102429 [NASA ADS] [CrossRef] [Google Scholar]
- Carilli, C. L., & Rawlings, S. 2004, New Astron. Rev, 48, 979 [CrossRef] [Google Scholar]
- Cherenkov Telescope Array Consortium, Acharya, B. S., Agudo, I., et al. 2019, Science with the Cherenkov Telescope Array (Singapore: World Scientific Publishing Co. Pte. Ltd.) [Google Scholar]
- Funk, S. 2005, Master’s thesis, Humboldt University Berlin, Germany [Google Scholar]
- Hauser, M., Möllenhoff, C., Pühlhofer, G., et al. 2004, Astron. Nachr. Astron. Notes, 325, 659 [NASA ADS] [CrossRef] [Google Scholar]
- H.E.S.S. Collaboration. 2017a, ATel, 10787 [Google Scholar]
- H.E.S.S. Collaboration. 2017b, GCN Circ., 21674 [Google Scholar]
- H.E.S.S. Collaboration. 2021a, ATel, 13052 [Google Scholar]
- H.E.S.S. Collaboration. 2021b, ATel, 14844 [Google Scholar]
- H.E.S.S. Collaboration. 2021c, ATel, 14857 [Google Scholar]
- H.E.S.S. Collaboration. 2021d, ATel, 15020 [Google Scholar]
- H.E.S.S. Collaboration. 2022, Science, 376, 77 [NASA ADS] [CrossRef] [Google Scholar]
- Hofverberg, P., Kankanyan, R., Panter, M., et al. 2013, Int. Cosmic Ray Conf., 33, 3092 [NASA ADS] [Google Scholar]
- Hoischen, C. 2018, Ph.D. Thesis, Universität Potsdam, Germany [Google Scholar]
- IceCube Collaboration and others. 2018, Science, 361, eaat1378 [NASA ADS] [CrossRef] [Google Scholar]
- Ivezić, Ž., Kahn, S. M., Tyson, J. A., et al. 2019, ApJ, 873, 111 [Google Scholar]
- Lenain, J.-P. 2018, Astron. Comput., 22, 9 [NASA ADS] [CrossRef] [Google Scholar]
- Murach, T., Gajdus, M., & Parsons, R. D. 2015, ArXiv e-prints [arXiv:1509.00794] [Google Scholar]
- Nordin, J., Brinnel, V., van Santen, J., et al. 2019, A&A, 631, A147 [NASA ADS] [CrossRef] [EDP Sciences] [Google Scholar]
- Ohm, S., van Eldik, C., & Egberts, K. 2009, Astropart. Phys., 31, 383 [NASA ADS] [CrossRef] [Google Scholar]
- Oya, I., Antolini, E., Füßling, M., et al. 2019, in ICALEPCS 2019-17, The Array Control and Data Acquisition System of the Cherenkov Telescope Array [Google Scholar]
- Parsons, R. D., & Ohm, S. 2020, EPJ C, 80, 363 [NASA ADS] [Google Scholar]
- Petroff, E., Houben, L., Bannister, K., et al. 2017, ArXiv e-prints [arXiv:1710.08155] [Google Scholar]
- Pühlhofer, G., Barcelo, M., Bauer, C., et al. 2019, SPIE, 11119, 554 [Google Scholar]
- Reichherzer, P., Schüssler, F., Lefranc, V., et al. 2021, ApJS, 256, 5 [NASA ADS] [CrossRef] [Google Scholar]
- Rutledge, R. E. 1998, PASP, 110, 754 [NASA ADS] [CrossRef] [Google Scholar]
- Salgado, J., Ibarra, A., Ehle, M., et al. 2021, Observation Locator Table Access Protocol Version 1.0, IVOA Recommendation [Google Scholar]
- Shilon, I., Kraus, M., Büchele, M., et al. 2019, Astropart. Phys., 105, 44 [NASA ADS] [CrossRef] [Google Scholar]
- Smith, M. W. E., Fox, D. B., Cowen, D. F., et al. 2013, Astropart. Phys., 45, 56 [NASA ADS] [CrossRef] [Google Scholar]
- Staley, T. D., 2014. Voevent-parse: Parse, manipulate, and generate VOEvent XML packets, Astrophysics Source Code Library [record ascl:1411.003] [Google Scholar]
- Staley, T. D., & Fender, R. 2016, ArXiv e-prints [arXiv:1606.03735] [Google Scholar]
- Steppa, C., & Holch, T. L. 2019, SoftwareX, 9, 193 [NASA ADS] [CrossRef] [Google Scholar]
- Swinbank, J. 2014, Astron. Comput., 7, 12 [CrossRef] [Google Scholar]
- Zhu, S. J., Murach, T., Ohm, S., et al. 2022, in 37th International Cosmic Ray Conference, The upgraded Data Acquisition System of the H.E.S.S. telescope array (Berlin), 759 [Google Scholar]
The rate of alerts received is very non-uniform and strongly depends on the alert strategy of the brokers that the H.E.S.S. system is subscribed to.
Public databases of VOEvents, such as voeventdb.remote (Staley & Fender 2016), are extremely helpful in such tasks.
Comet provides such a functionality implementing all VOEvent standards.
Official H.E.S.S. web-page: https://www.mpi-hd.mpg.de/hfm/HESS/
See the services build using the IVOA VOEvent (Petroff et al. 2017; Allan et al. 2017) and ObsLocTAP standards (Salgado et al. 2021), for example.
All Figures
|
Fig. 1 Functional view of the transients follow-up system of H.E.S.S. The main subsystems are the ToO alert system, DAQ, and RTA. The three subsystems are encoded by the blue, orange, and green coloured areas, respectively. The main functions of each subsystem are depicted as well as the interfaces to external systems and experts and operators. |
| In the text | |
|
Fig. 2 Functional view of the ToO alert system as it reacts to an incoming alert. The main function groups, ‘Alert Receiving and Archiving’, ‘Matching of Alerts and Science Programs’, ‘Alert Processing’ and ‘Scheduling Preparations and Reporting’ are indicated by the four large boxes. The detailed functionality is described in Sect. 3. The mapping of these functions to the implementation is shown in Fig. A.1. |
| In the text | |
|
Fig. 3 Functional view of the DAQ system as it reacts to a prompt follow-up candidate. The central functions are ‘Dynamic Scheduling’, ‘Central Control’ and ‘Data Acquisition and Event Building’. Further details can be found in Sect. 4. The implementation of these functions as components is described in Appendix B and shown in Fig. B.1. |
| In the text | |
|
Fig. 4 Functional view of the RTA system. The central functionality is described by the boxes: ‘Analysing Events’, ‘Merging Results’ and ‘Monitoring and Archiving’. The details are described in Sect. 5 and Appendix C. |
| In the text | |
|
Fig. 5 DAQ computing cluster performance during data taking. Top panel: average memory (left) and CPU load (right) per night of the physical computing nodes. Bottom panel: standard deviation of the memory (left) and CPU (right) load of the computing nodes. We note that 100% CPU load corresponds to one of the 20 available cores per CPU. The ‘Analyser’ process does the bulk data processing, while the ‘Receiver’ process is responsible for data reception in the Event Builder. |
| In the text | |
|
Fig. 6 Sensitivity expressed in terms of signal recorded per |
| In the text | |
|
Fig. 7 Significance map, including the source region (left), and excluding the source region (middle) for 50 h of PKS 2155−304 observations conducted with the full CTl−5 array (pre-FlashCam upgrade). Right plot: 1D distribution of the significance (blue) and excluded significance (orange) maps. The mean and rms of a fit of a one-dimensional Gaussian function to the excluded significance distribution are also shown. |
| In the text | |
|
Fig. A.1 Implementation view of the ToO Alert system. The ‘Receiving’, ‘Archiving’, and ToO Alert Scheduling Preparation functions map directly to components in the implementation. The Processing Pipeline implements the Matching of Alerts and Science Programs matching, the Alert Processing and the Scheduling Preparation. The Assessment of the Visibility function, for instance, maps to the Processor & Evaluator module in the pipeline. |
| In the text | |
|
Fig. B.1 Implementation view of the DAQ ToO system. The Dynamic Scheduling and Central Control functions are implemented in a common component. The Run Manager is the central component that takes input from the VO Controller, interacts with the Scheduler and initiates the ‘Sub-Array Managers’. The Data Acquisition and Event Building function is implemented in a component that manages the many Event Builders. |
| In the text | |
|
Fig. C.1 Implementation view of the RTA. The main functions of the RTA are implemented in a single Pipeline that manages many ‘Node Analysers’ in order to receive input from the many Event Builders in the DAQ and Central Control system. |
| In the text | |
Current usage metrics show cumulative count of Article Views (full-text article views including HTML views, PDF and ePub downloads, according to the available data) and Abstracts Views on Vision4Press platform.
Data correspond to usage on the plateform after 2015. The current usage metrics is available 48-96 hours after online publication and is updated daily on week days.
Initial download of the metrics may take a while.