Fig. 6
Download original image
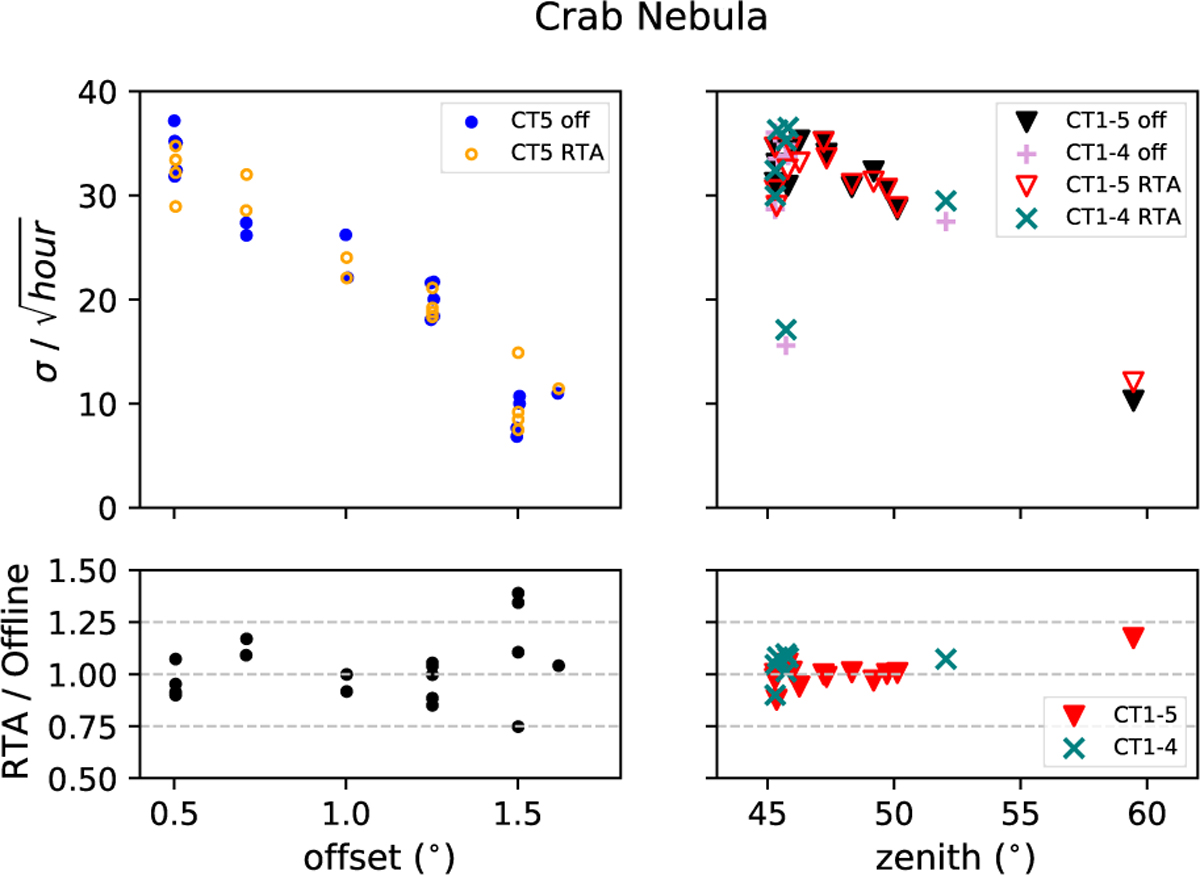
Sensitivity expressed in terms of signal recorded per ![]() of the RTA compared to the off-site analysis using the same signal-background separation technique for Crab Nebula observations conducted under various offset (left) and zenith angles (right). Bottom panel: ratio between performance of the RTA and the off-site analysis. We note that bad-weather data is included, for which lower significances are reached.
of the RTA compared to the off-site analysis using the same signal-background separation technique for Crab Nebula observations conducted under various offset (left) and zenith angles (right). Bottom panel: ratio between performance of the RTA and the off-site analysis. We note that bad-weather data is included, for which lower significances are reached.
Current usage metrics show cumulative count of Article Views (full-text article views including HTML views, PDF and ePub downloads, according to the available data) and Abstracts Views on Vision4Press platform.
Data correspond to usage on the plateform after 2015. The current usage metrics is available 48-96 hours after online publication and is updated daily on week days.
Initial download of the metrics may take a while.