Fig. 5
Download original image
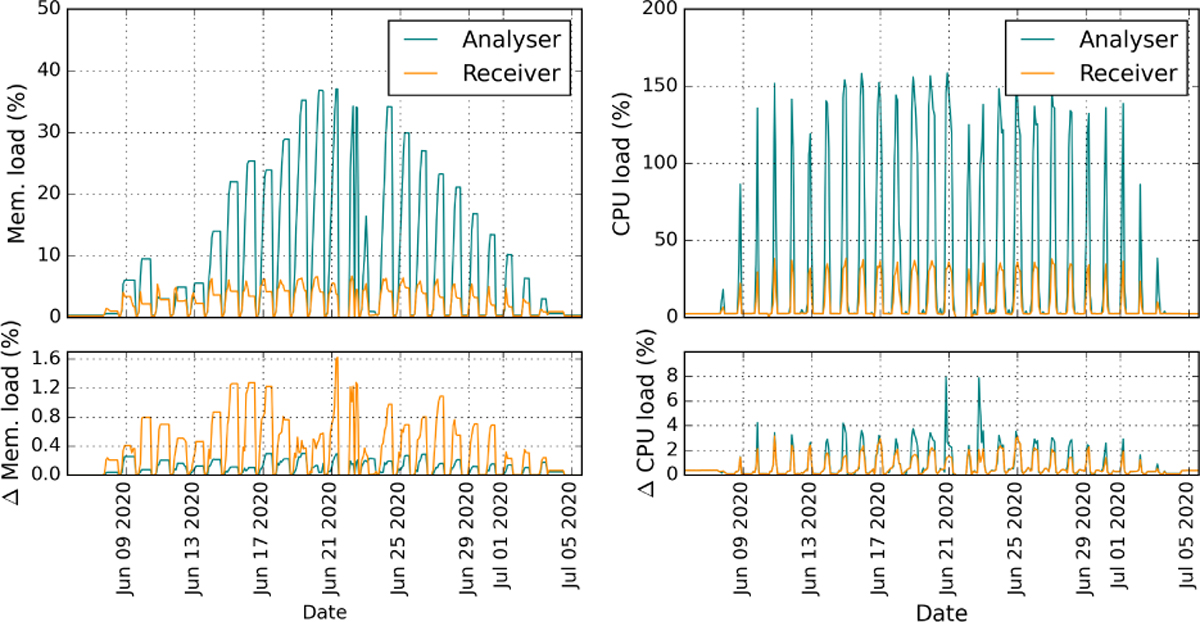
DAQ computing cluster performance during data taking. Top panel: average memory (left) and CPU load (right) per night of the physical computing nodes. Bottom panel: standard deviation of the memory (left) and CPU (right) load of the computing nodes. We note that 100% CPU load corresponds to one of the 20 available cores per CPU. The ‘Analyser’ process does the bulk data processing, while the ‘Receiver’ process is responsible for data reception in the Event Builder.
Current usage metrics show cumulative count of Article Views (full-text article views including HTML views, PDF and ePub downloads, according to the available data) and Abstracts Views on Vision4Press platform.
Data correspond to usage on the plateform after 2015. The current usage metrics is available 48-96 hours after online publication and is updated daily on week days.
Initial download of the metrics may take a while.