Fig. 7
Download original image
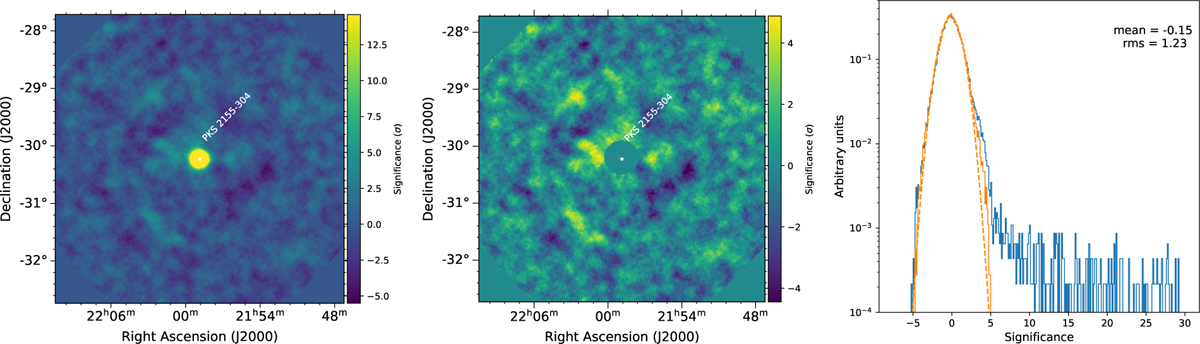
Significance map, including the source region (left), and excluding the source region (middle) for 50 h of PKS 2155−304 observations conducted with the full CTl−5 array (pre-FlashCam upgrade). Right plot: 1D distribution of the significance (blue) and excluded significance (orange) maps. The mean and rms of a fit of a one-dimensional Gaussian function to the excluded significance distribution are also shown.
Current usage metrics show cumulative count of Article Views (full-text article views including HTML views, PDF and ePub downloads, according to the available data) and Abstracts Views on Vision4Press platform.
Data correspond to usage on the plateform after 2015. The current usage metrics is available 48-96 hours after online publication and is updated daily on week days.
Initial download of the metrics may take a while.