Open Access
Fig. C.1
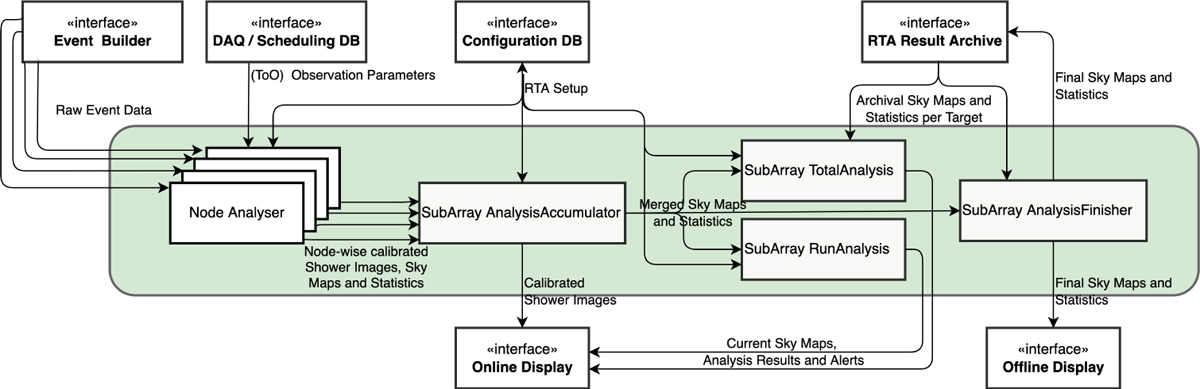
Download original image
Implementation view of the RTA. The main functions of the RTA are implemented in a single Pipeline that manages many ‘Node Analysers’ in order to receive input from the many Event Builders in the DAQ and Central Control system.
Current usage metrics show cumulative count of Article Views (full-text article views including HTML views, PDF and ePub downloads, according to the available data) and Abstracts Views on Vision4Press platform.
Data correspond to usage on the plateform after 2015. The current usage metrics is available 48-96 hours after online publication and is updated daily on week days.
Initial download of the metrics may take a while.