Fig. 6.
Download original image
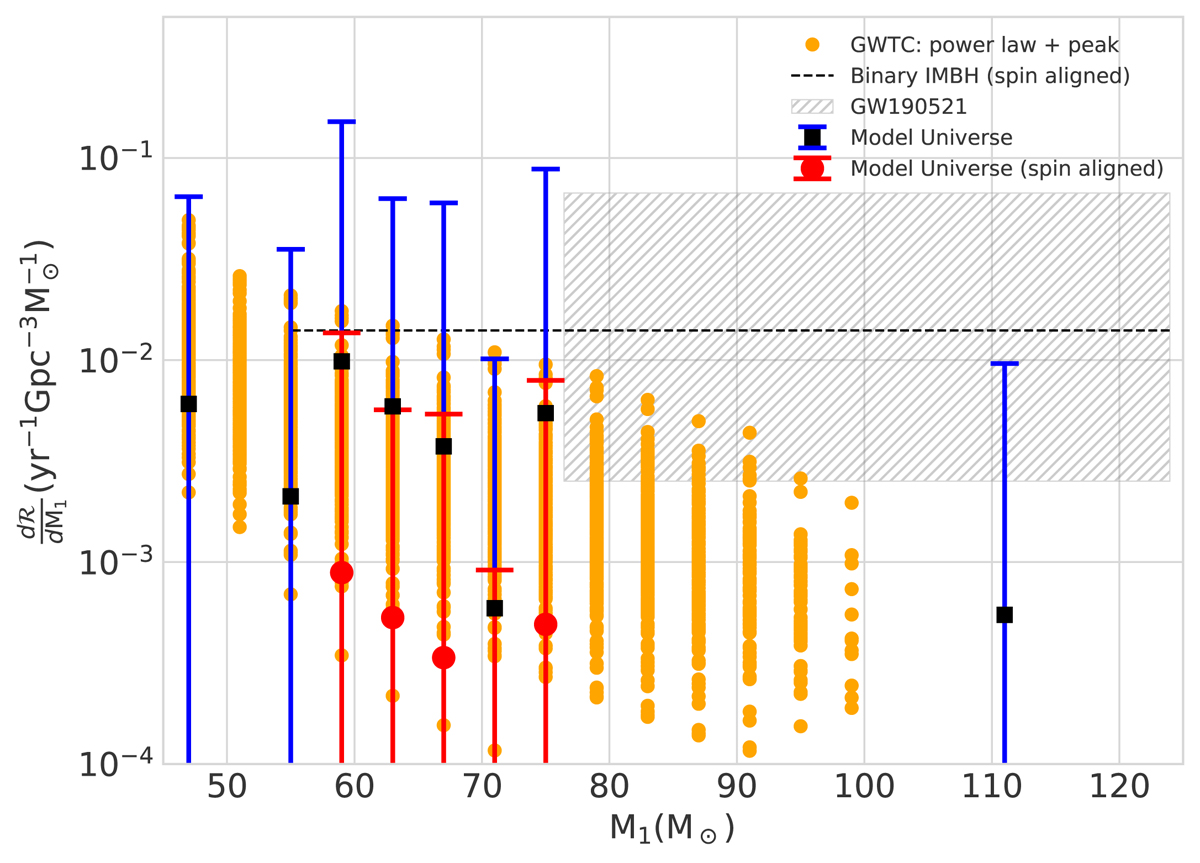
Present-day, differential intrinsic BBH merger rate density (black-filled squares with blue error bars), from the Model Universe (Sect. 3.1) composed of the computed model clusters of Table A.1, as a function of merger primary mass, M1, within the PSN mass gap (here considered to be 45 Msamp ≤ M1 ≤ 120 Msamp). At each M1 bin, the average rate over the model sets (Sect. 3.1) is indicated with the black-filled square and the corresponding vertical, blue error bar indicates the maximum and minimum rates for the bin. The orange dots are random draws (300 per bin) of the posteriors of BBH differential intrinsic merger rate density, over the same range of M1, as obtained by LVK (The LIGO Scientific Collaboration 2021b, their power law + peak model). The hashed region spans over the 90% credible intervals of the intrinsic merger rate density of GW190521-like events and GW190521’s primary mass, as estimated by LVK (Abbott et al. 2020, 2022). The horizontal, black-dashed line indicates the LVK-estimated upper limit of the merger rate density of equal mass, aligned spin (χeff > 0.8) BBHs of total mass 200 Msamp (Abbott et al. 2022). The line spans from the lower primary mass limit of GW190403 to the upper primary mass limit of GW190521. The red-filled circles and the corresponding vertical, red error bars represent the average and the limits of the aligned spin fractions of the Model Universe differential BBH merger rate density over 55 Msamp ≲ M1 ≲ 75.0 Msamp, respectively. The LVK-estimated total rates were divided by the bin width (4 Msamp), so as to represent them in the dℛ/dM1 − M1 plane. The lower limit of the Model Universe rate is zero in each bin. Due to the logarithmic scale along the vertical axis, rate values below 10−4 yr−1 Gpc−3 ![]() are not shown in this figure.
are not shown in this figure.
Current usage metrics show cumulative count of Article Views (full-text article views including HTML views, PDF and ePub downloads, according to the available data) and Abstracts Views on Vision4Press platform.
Data correspond to usage on the plateform after 2015. The current usage metrics is available 48-96 hours after online publication and is updated daily on week days.
Initial download of the metrics may take a while.