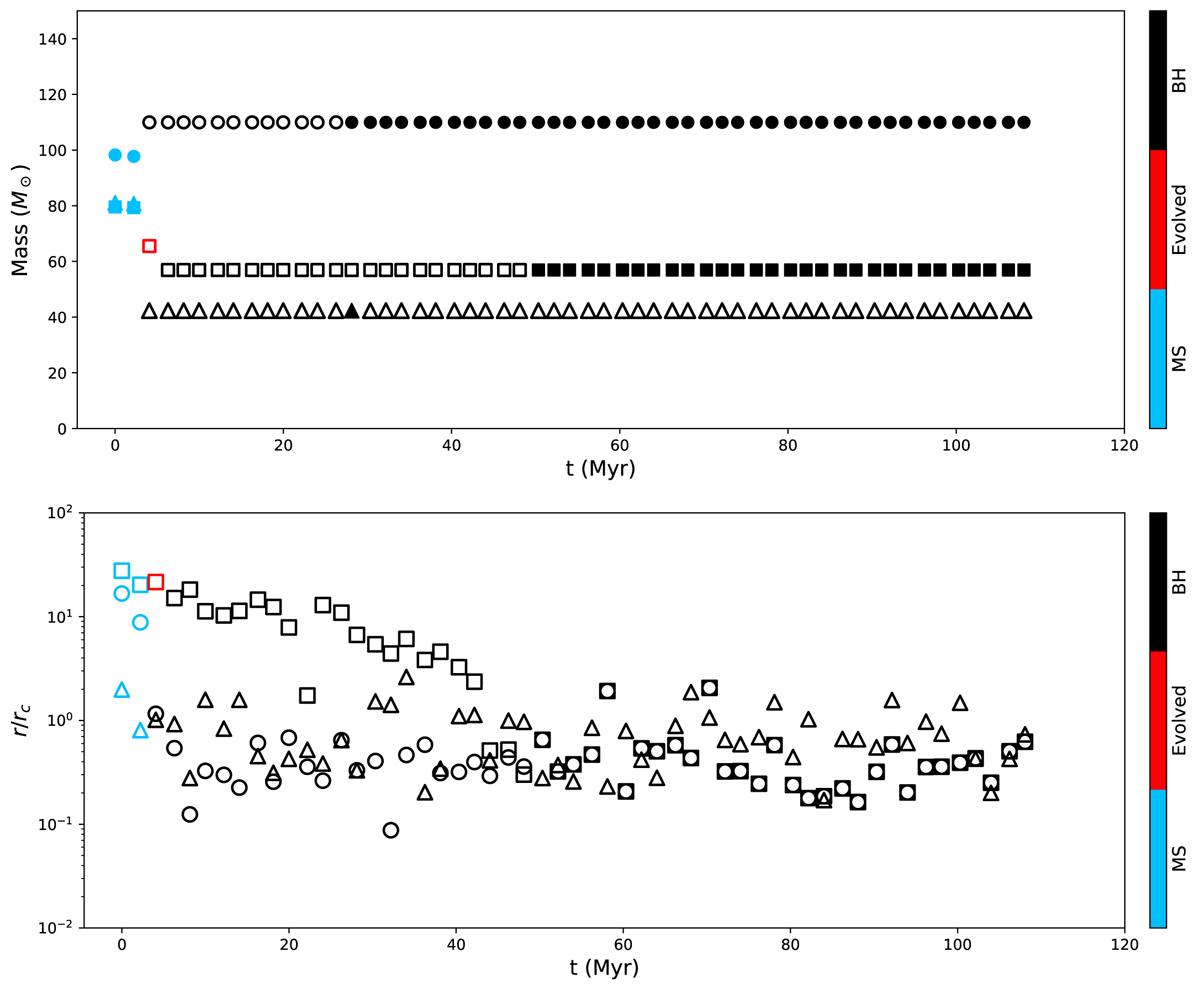
Fig. 5.
Download original image
Timeline of the GW190521-like merger event that occurred inside one of the computed cluster models with W0 = 9, Z = 0.0002. In both panels the evolutions for the three cluster members, which are most relevant for the event, are shown from the start of the computation until the merger. Top panel: mass evolution of these objects: the trace of the merger primary and secondary mass is indicated by a circle and a square, respectively, and that of the third ‘perturber’ is represented by a triangle. The symbols are colour-coded according to the stellar-evolutionary stage (main sequence, MS, or beyond main sequence, evolved, or BH). If an object is a member of a binary, then its symbol is filled; if it is not, then its symbol is open. Bottom panel: traces the radial position of these objects in units of the cluster’s instantaneous core radius rc, which rc was determined from the cluster’s stellar distribution by applying the Casertano & Hut (1985) method. The time evolution of rc, 10% Lagrangian radius, and half-mass radius of all model clusters (Table A.1) are shown in Fig. A.1. The same symbol shapes and colour coding as in the top panel are used in the bottom panel: for better visibility of overlapping symbols, the symbol filling was not applied in the bottom panel. Both the primary and the secondary BHs are born from single stars, thereby having vanishing natal spins (Sect. 2). Both the progenitor single stars are merged primordial binaries: the BH can be more massive than the plotted ZAMS progenitor depending on the mass of the latter’s companion, the age of the primordial binary’s merger, and the mass loss during the merger (Sect. 2). Although they have formed well separated within the cluster, the primary and secondary BHs segregate to the cluster centre and pair up dynamically from ≈50 Myr. The third BH becomes bound to this BBH dynamically only a few million years before the merger (lower panel). The BBH merger happens due to this triple interaction (Samsing & Ramirez-Ruiz 2017; Banerjee 2018b, 2021a).
Current usage metrics show cumulative count of Article Views (full-text article views including HTML views, PDF and ePub downloads, according to the available data) and Abstracts Views on Vision4Press platform.
Data correspond to usage on the plateform after 2015. The current usage metrics is available 48-96 hours after online publication and is updated daily on week days.
Initial download of the metrics may take a while.