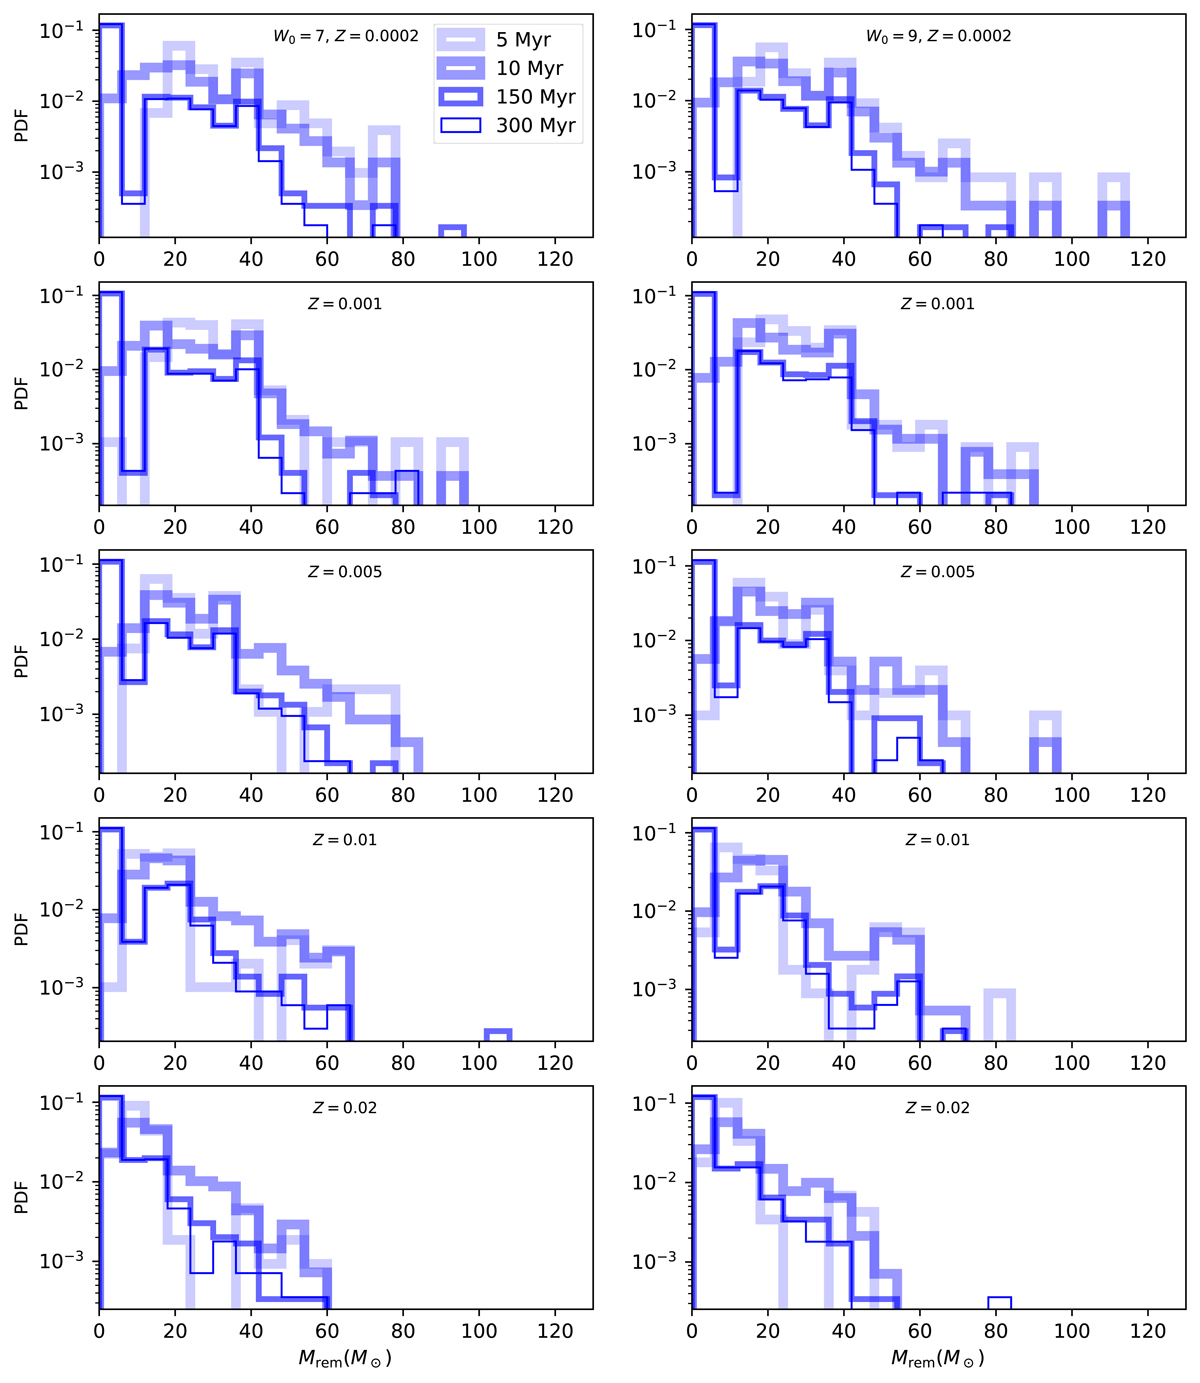
Fig. 2.
Download original image
Mass distributions of stellar remnants remaining in the computed model clusters (Table A.1) at 5 Myr, 10 Myr, 150 Myr, and 300 Myr cluster-evolutionary times (legend). The distributions, at a given time, from all (four) models for a particular W0 and Z are combined in one histogram. The panels in the left (right) column correspond to the models with W0 = 7 (W0 = 9) with Z as indicated in each panel’s title.
Current usage metrics show cumulative count of Article Views (full-text article views including HTML views, PDF and ePub downloads, according to the available data) and Abstracts Views on Vision4Press platform.
Data correspond to usage on the plateform after 2015. The current usage metrics is available 48-96 hours after online publication and is updated daily on week days.
Initial download of the metrics may take a while.