| Issue |
A&A
Volume 663, July 2022
|
|
|---|---|---|
| Article Number | A87 | |
| Number of page(s) | 14 | |
| Section | Extragalactic astronomy | |
| DOI | https://doi.org/10.1051/0004-6361/202243231 | |
| Published online | 14 July 2022 | |
Comprehensive X-ray view of the active nucleus in NGC 4258
1
SISSA – International School for Advanced Studies, Via Bonomea 265, 34151 Trieste, Italy
2
INAF – Osservatorio di Astrofisica e Scienza dello Spazio di Bologna, Via Gobetti 93/3, 40129 Bologna, Italy
e-mail: This email address is being protected from spambots. You need JavaScript enabled to view it.
3
Department of Physics and Astronomy, University of Padova, Via Francesco Marzolo 8, 35121 Padova, Italy
4
INAF – Osservatorio Astronomico di Brera, Via Bianchi 46, 23807 Merate, Italy
5
IFPU – Institute for Fundamental Physics of the Universe, Via Beirut 2, 34151 Trieste, Italy
6
INFN – National Institute for Nuclear Physics, Via Valerio 2, 34127 Trieste, Italy
7
Astronomical Institute, Academy of Sciences, Boční II 1401, 14100 Prague, Czech Republic
8
Department of Physics & Astronomy, University of Southampton, Southampton SO17 1BJ, UK
Received:
31
January
2022
Accepted:
13
May
2022
Abstract
Context. The presence of water masers orbiting around the active galactic nucleus (AGN) in NGC 4258, one of the most studied extragalactic objects, has been crucial in developing a detailed picture of its nuclear environment. Nonetheless, its accretion rate and bolometric luminosity are still matter of debate, as there are indications that NGC 4258 may host a genuine radiatively inefficient accretion flow (RIAF).
Aims. In this context, we present a detailed broadband X-ray spectrum of NGC 4258, with the goal of precisely measuring the coronal luminosity and accretion flow properties of the AGN, in addition to tracking any possible variation across two decades of observations.
Methods. We collected archival XMM-Newton, Chandra, Swift/BAT, and NuSTAR spectroscopic observations spanning 15 years and fit them with a suite of state-of-the-art models, including a warped disk model that is suspected to provide the well known obscuration observed in the X-rays. We complemented this information with archival results from the literature.
Results. A clear spectral variability is observed among the different epochs. The obscuring column density shows possibly periodic fluctuations on a timescale of 10 years, while the intrinsic luminosity displays a long-term decrease by a factor of three across a time span of 15 years (from L2−10 keV ∼ 1041 erg s−1 in the early 2000s to L2−10 keV ∼ 3 × 1040 erg s−1 in 2016). The average absorption-corrected X-ray luminosity L2−10 keV, combined with archival determinations of the bolometric luminosity, implies a bolometric correction kbol ∼ 20; this result is intriguingly typical for Seyferts powered by accretion through geometrically thin, radiatively efficient disks. Moreover, the X-ray photon index Γ is consistent with the typical value of the broader AGN population. However, the accretion rate in Eddington units is very low, well within the expected RIAF regime.
Conclusions. Our results suggest that NGC 4258 is a genuinely low-luminosity Seyfert II, with no strong indications in its X-ray emission for a hot, RIAF-like accretion flow.
Key words: accretion, accretion disks / methods: observational / techniques: spectroscopic / galaxies: active / galaxies: Seyfert / X-rays: galaxies
© A. Masini et al. 2022
 Open Access article, published by EDP Sciences, under the terms of the Creative Commons Attribution License (https://creativecommons.org/licenses/by/4.0), which permits unrestricted use, distribution, and reproduction in any medium, provided the original work is properly cited.
This article is published in open access under the Subscribe-to-Open model. This email address is being protected from spambots. You need JavaScript enabled to view it. to support open access publication.
1. Introduction
The nearby spiral galaxy NGC 4258 hosts one of the closest active galactic nuclei (AGN), at a distance of 7.58 ± 0.11 Mpc (Reid et al. 2019). However, its historical importance goes beyond its mere distance. Since the discovery of nuclear megamaser emission at 22 GHz from water vapour molecules (Claussen et al. 1984), NGC 4258 soon became the cleanest evidence for the existence of extragalactic supermassive black holes (SMBHs). The mapping and temporal monitoring of the masers through very long baseline interferometry (VLBI) revealed a sub-pc molecular, dusty disk in Keplerian rotation around a central mass of M = 4 × 10⁷ M⊙ (Nakai et al. 1993; Miyoshi et al. 1995). Moreover, NGC 4258 has since served as an anchor galaxy in calibrating the distance ladder and measuring the expansion rate of the Universe H0 (Pesce et al. 2020). Nowadays, water masers tracing edge-on molecular disks around AGN – called disk megamasers – have been (more or less definitively) detected in a couple of dozen of galaxies, allowing for the measurement of the most precise extragalactic SMBH masses to date (e.g., Kuo et al. 2011) as well as geometric distances (e.g., Kuo et al. 2015; Reid et al. 2019). NGC 4258 has historically been considered as the archetype for the class of disk megamasers, although today it has been acknowledged as a somewhat anomalous source with respect to the similar objects (e.g., for its low obscuration along the line of sight; see Masini et al. 2016).
After the discovery of water maser spots in the nucleus of NGC 4258, slight (albeit significant) deviations from a pure Keplerian rotation were noted (Herrnstein et al. 2005), indicating that a simple, flat, geometrically thin molecular disk was too simplistic a model to accurately explain their dynamics. By introducing both a position angle and inclination warps, Herrnstein et al. (2005) were instead able to reconcile the maser spots kinematics with a pure Keplerian rotation. Furthermore, in this model, the projected clustering of the systemic masers was naturally explained by their confinement at the bottom of the “bowl” caused by the inclination warp. A natural implication of a warped maser disk was that it would rise in front of the observer, hiding the central engine and possibly providing the observed moderate absorption in the X-ray spectrum (Fruscione et al. 2005), which was first noted more than 25 years ago (Makishima et al. 1994). Herrnstein et al. (2005) were able to put a constraint on the radial distance at which the warp crosses the line of sight, by comparing their warp model with the radius at which the X-ray irradiation would cause a transition from molecular to atomic gas in the disk (Neufeld & Maloney 1995). The transition radius was found to be at ∼0.28 pc from the nucleus, and it was also used to constrain the accretion rate through the maser disk while assuming a steady-state, geometrically thin and optically thick accretion disk (Shakura & Sunyaev 1973).
Also, NGC 4258 is a very interesting AGN because its particularly low bolometric luminosity in Eddington units1 (LBol/LEdd ∼ 10−4) could be either explained by a very low accretion rate or by invoking a radiatively inefficient accretion flow (RIAF; see, e.g., Narayan & Yi 1995, and references therein). The acronym RIAF generally refers to physically different accretion flows, such as advection-dominated flows (ADAF, Narayan & Yi 1995) or adiabatic inflow-outflow solutions (ADIOS, Blandford & Begelman 1999). In these models, the inner regions of the accretion disk do not follow the usually assumed Shakura & Sunyaev (1973) one. Therefore, a detailed study of this source offers a unique opportunity to explore the inner fraction of a parsec of an underluminous AGN.
Several previous studies have investigated the nature of the accretion flow in NGC 4258, both through its broadband spectral energy distribution (SED) and detailed X-ray spectroscopy. After the discovery of the sub-pc maser disk, for instance, Neufeld & Maloney (1995) derived an accretion rate Ṁ = 7 × 10⁻⁵α (where α is the standard viscosity parameter of Shakura & Sunyaev 1973), by assuming a viscous accretion disk whose midplane is traced by the masers and obliquely illuminated by a central X-ray source. By combining the low X-ray luminosity with such an accretion rate and assuming a bolometric correction typical of Seyfert galaxies (Mushotzky et al. 1993), Neufeld & Maloney (1995) derived a “standard” radiative efficiency of order η ∼ 0.1; thus, one that does not require radiatively inefficient accretion to explain the low luminosity of the AGN. On the other hand, Lasota et al. (1996) and Gammie et al. (1999) fitted the SED of the source with an ADAF with a much higher accretion rate (Ṁ ∼ 10−2). Still, Yuan et al. (2002) later demonstrated that a “classical” ADAF-like accretion flow was not able to account for the nuclear IR data, in particular the steep power law shape, indicative of non-thermal emission (Chary et al. 2000). Moreover Fiore et al. (2001), in analyzing BeppoSAX data, found that pure bremsstrahlung emission (as expected from an ADAF, Narayan & Yi 1995) is ruled out by the X-ray data. Rather, the X-ray spectrum of NGC 4258 resembles an average Seyfert-like spectrum, having been successfully described by the combination of a power law modified at low energy by photoelectric absorption and soft X-ray emission due to the extended (kpc-scale) structures connected to the so-called twisted anomalous arms (Wilson et al. 2001, and references therein). Yuan et al. (2002) suggested that a composite model, in which an outer thin disk transitions to an inner RIAF, which then transfers energy to a relativistic jet, was able to account for the radio to X-ray SED of NGC 4258. In this model, the X-ray emission would arise from Comptonization by hot electrons at the base of the jet. This picture was broadly supported by Herrnstein et al. (2005), who inferred a consistently low (∼10−4α M⊙ yr−1) accretion rate. The absence of a broad Fe Kα line, paired with the detection of a weak, narrow, and rapidly variable component (Reynolds et al. 2009), further supported the view that the inner regions of NGC 4258 might deviate significantly from the canonical radiatively efficient disk. Later on, Wu et al. (2013) again fit the broadband nuclear SED of NGC 4258 with a composite model (inner RIAF + outer truncated thin disk + a jet), suggesting that the SED can be reproduced by a combination of the three components, along with setting a constraint over the spin parameter of the SMBH (a = 0.7 ± 0.2).
The goal of this work is to comprehensively review the X-ray properties of NGC 4258 and possibly shed new light on its accretion flow and long-term (∼20 yr) evolution. To this end, we have taken advantage of the wealth of available data: we re-analyzed, using state-of-the-art models, archival (from ∼2000−2016) spectroscopic observations from the Chandra X-ray telescope (Weisskopf et al. 2000), XMM-Newton observatory (Jansen et al. 2001), Swift/BAT telescope (Gehrels et al. 2004; Barthelmy et al. 2005), and NuSTAR (Harrison et al. 2013). The obtained results were then complemented with others from the literature (from ∼1993−2000) to obtain a complete and thorough X-ray view of a nearby underluminous AGN, spanning 23 years of observations.
The paper is structured as follows. In Sect. 2, both the observations used in this work and their associated data reduction are presented. Section 3 offers a discussion of the contribution to the XMM-Newton and NuSTAR fluxes of the non-AGN components, namely, the large-scale plasma emission and the off-nuclear point source. The broadband spectral analysis is conducted in Sect. 4, with the setup presented in 4.1 and results discussed in Sects. 4.2 and 4.3. Both the short- and long-term variability are discussed in Sect. 5. A presentation of the general results obtained is given in Sect. 6, while our conclusions are drawn in Sect. 7. Tables displaying the spectral analysis results are reported in Appendix A. Throughout the paper, uncertainties are given at the 90% confidence level, unless otherwise stated, and no cosmology is assumed, given the adopted geometric distance (Reid et al. 2019).
2. Observations and data reduction
NGC 4258 was observed multiple times by all major X-ray astronomical facilities in recent decades. Here, we focus on the most recent Chandra ACIS-S, XMM-Newton EPIC PN and MOS, NuSTAR FPMA and FPMB, and Swift/BAT observations. A summary of the observations considered, with their dates and cleaned exposure times, is given in Table 1. Together with this data, we consider previously published results from the literature, regarding ASCA (Makishima et al. 1994; Reynolds et al. 2000; Terashima et al. 2002), BeppoSAX (Fiore et al. 2001), and Suzaku (Reynolds et al. 2009) observations. For all of the analyses, we use the fitting package XSPEC (Arnaud 1996) v.12.11.1.
Log of the observations analyzed in this work.
2.1. Chandra
NGC 4258 has been observed four times by Chandra with the ACIS-S instrument, for a total exposure time of 46 ks. The nucleus is so bright that its emission is piled-up even in a modest Chandra exposure (Young & Wilson 2004). Indeed, the majority of the ACIS-S exposure time was intended for the study of the anomalous arms, while very few ks of observations with short time frames (0.4 s and 0.1 s) could, in principle, be used to extract less piled-up spectra of the nuclear source. Pile-up manifests itself as a spectral distortion that hardens the spectrum and makes it unnaturally flat. Although there are ad hoc models available in spectral fitting software to mitigate the effects of pile-up, they rely on a few poorly known parameters (see, e.g., the pile up model from Davis 2001). Therefore, we chose not to increase the number of parameters in our modeling and, instead, we took advantage of the excellent angular resolution of Chandra to extract the spectra of the non-nuclear components that are very likely to contaminate the XMM-Newton and NuSTAR data, due to their lower angular resolution and larger point spread function (PSF). Chandra observations were downloaded from the Chandra Data Archive and reprocessed with the chandra_repro task in CIAO (Fruscione et al. 2006) v.4.12. The specextract task was used to extract the spectrum of the circum-nuclear soft, diffuse emission and of an off-nuclear X-ray source that is  south-east from the nucleus and already known in the literature (Wilson et al. 2001; Pietsch & Read 2002; Young & Wilson 2004).
2.2. XMM-Newton
NGC 4258 was observed by XMM-Newton multiple times, in particular, for five epochs during the early 2000s (Fruscione et al. 2005) and once in 2006 (Reynolds et al. 2009). The XMM-Newton observations were downloaded from the HEASARC archive and reduced with the SAS v.19.1.0. In particular, cleaned event files were created for both the PN and MOS cameras on board XMM with the epproc and emproc tasks, respectively. No pile-up was detected, as reported in Fruscione et al. (2005). High background time intervals were selected using light curves in the 10−12 keV energy range. The event files were thus filtered with these defined good time intervals and by adopting the standard FLAG=0 and pixel groups with pattern ≤4 and ≤12 for the PN and MOS cameras, respectively. Finally, the source and background spectra, as well as ancillary files and responses, were extracted using the SAS task xmmselect. Source spectra were extracted from 15″-radius circular apertures, while background spectra were extracted from larger circles (with size ranging from 60″ to 90″) on the same detector chips. Then, epicspeccombine was used to co-add MOS1 and MOS2 spectra for each of the six epochs, resulting in a total of 12 XMM-Newton spectra. All the spectra have been rebinned to have at least 20 counts per bin with the HEASOFT tool grppha.
2.3. NuSTAR
NuSTAR observed NGC 4258 twice, for a total exposure time of ∼158 ks. We downloaded the ObsIDs from the HEASARC archive and reduced the observations with the NuSTARDAS package, using the standard nupipeline task to clean the raw data. The cleaned event files were used to extract the spectral products, through the task nuproducts. The source and background spectra were extracted from circles of 50 and 120″ radius, respectively. The background regions were chosen on the same detector chip where the source spectra were extracted. All the spectra have been rebinned to have at least 20 counts per bin with the HEASOFT tool grppha.
2.4. Swift/BAT
We downloaded the Swift/BAT spectrum of NGC 4258 from the Swift/BAT 105-Month Hard X-ray Catalog (Ricci et al. 2017; Oh et al. 2018)2 for a final broad band range 0.3−195 keV.
3. Off-nuclear contaminants
The deepest Chandra ACIS-S observation (ObsID 1618, see Table 1) was used to extract the spectrum of the diffuse, extended soft X-ray emitting plasma in the nucleus of NGC 4258 and of the off-nuclear point source. While the former basically disappears at energies E ≳ 2 keV, contributing negligibly to the hard X-ray flux, the latter component is expected to contribute (to some extent) to the flux in the XMM-Newton and NuSTAR energy bands.
3.1. Soft, diffuse emission
As detailed in Wilson et al. (2001), the clear diffuse X-ray emission coincident with the anomalous arms of NGC 4258, which have been historically detected with radio and Hα imaging as well, is due to galactic disk gas that has been shocked by mass motions driven by the out-of-plane radio jets. More recently, evidence for shocks has also been found in cold molecular gas (Ogle et al. 2014). Thus, much of the gas that was originally found in the disk has been ejected into the galaxy halo in an X-ray hot outflow. As a consequence, the star formation in the central few kpc is rather low (0.08 M⊙ yr−1, Ogle et al. 2014). In addition, the anomalous arms themselves have been suggested to be free of star formation activity (Courtes et al. 1993).
We extracted the Chandra spectrum of the diffuse, soft emission along the anomalous arms of NGC 4258, from a rectangular region south-east of the nucleus (left panel of Fig. 1). The spectrum was grouped to have at least 20 counts per bin and fitted with a double mekal (Mewe et al. 1985) component in XSPEC. The spectrum is equally well fit either by two different temperatures with solar abundance or by assuming only one component, in which case the abundance is sub-solar. To be consistent throughout the paper, we assume solar abundance throughout and adopt two mekal components to describe this component (e.g., Reynolds et al. 2009).
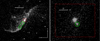 |
Fig. 1. Chandra ACIS-S 0.5−7.0 keV imaging of NGC 4258. Left: green box labels the extraction region of the soft, diffuse emission, while the red dashed box marks the size of the zoomed inset in the right panel. Right: zoom-in on the nuclear region with the off-nuclear source clearly visible. Its spectrum has been extracted from the green circular region. The red dashed box marks the corresponding size of the zoomed inset in the left panel. In both panels, north is up and east to the left. |
3.2. Off-nuclear point source
The presence of an off-nuclear point source, located 2 5 to the south-east of the nucleus of NGC 4258, has been known for more than two decades (Wilson et al. 2001; Pietsch & Read 2002; Young & Wilson 2004). Nonetheless, its precise nature is still unknown. Its Chandra spectrum is extracted from a small circular region, carefully avoiding the emission from the active nucleus of NGC 4258 itself (right panel of Fig. 1). The spectrum is equally well fit by an absorbed power law (in which case we find that the results are consistent with those of Young & Wilson 2004), and by a multicolor blackbody model (diskbb in XSPEC). In the first case, the source could be a background AGN with a fairly typical photon index (
 ) obscured by a column density
  cm−2 (which could be due to gas in NGC 4258 itself); while in the second case it could be an X-ray binary in the nuclear region of the galaxy, with a temperature
  keV and whose flux is again absorbed by a column density in excess of 1021 cm−2. The unknown nature of this source results in an uncertain extrapolation of its contribution to the X-ray flux at higher energies, depending on the spectral model assumed. To remain conservative, we consider the absorbed power law model (which provides the largest contribution at hard X-ray energy), fixing the best fit column density, photon index and power law normalization to their best fit values. We also verified that across the three Chandra observations in which the source is detected (spanning approximately one year), its 0.5−7 keV flux is rather stable, showing possible variations at the 20% level – which are nonetheless consistent with being constant within the uncertainties. Its spectral shape is also constant within the uncertainties. However, the quality of the data in the other observations allowed only a rough assessment of the X-ray spectral shape of the off-nuclear point source to be done. Its observed 2−10 keV flux is F2−10 ∼ 10−13 erg cm−2 s−1, namely, it is ≈2% of the average observed flux in the same band from NGC 4258.
4. X-ray spectral analysis
The broadband XMM-Newton + NuSTAR + Swift/BAT spectra, covering almost three orders of magnitude in energy (0.3−195 keV) and more than 15 years over time, are shown in Fig. 2. They show two peaks, around ∼4−5 keV and ∼1 keV. While the latter peak is due to the diffuse plasma at large scales, the higher energy one is due to the absorbing column density affecting preferentially soft X-ray photons, hence producing the observed spectral curvature. Consistently with this interpretation, the soft (≲2 keV) emission is stable over the years, while the hard X-ray flux is variable by a factor of ∼10 at E > 3 keV. We considered whether this variability could be accounted for by means of the flux variability only or whether the explanation is more complex (i.e., spectral variability). To answer these questions, we tested two different setups for any given spectral model.
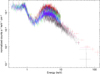 |
Fig. 2. Broadband 0.3−195 keV spectrum of NGC 4258, composed of the 17 spectra analyzed in this work (12 XMM-Newton, 4 NuSTAR and 1 Swift/BAT) spanning more than 15 years of observations. While the soft emission ≲2 keV is due to extended plasma and is constant throughout the years, the harder component shows significant variability across different observations. In particular, NGC 4258 was caught in its faintest state during the NuSTAR observations. The spectral turnover below 4−5 keV is due to the moderate absorption, possibly due to the line of sight intercepting the warped maser disk. |
4.1. Models setup
In the first setup, dubbed setup A, we assume that the observed variability is due only to flux variability; thus, we fit all the 17 spectra using the same set of parameters, allowing for a free normalization constant for the nuclear component alone, relative to the first epoch: December 2000 (see the left panel of Fig. 3)3. In the second setup, dubbed setup B, we instead allow for spectral variability, leaving the column density, photon index, and normalization of the coronal power law free for each epoch4 (right panel of Fig. 3). In both setups, the soft emission is modeled in the same way. In all the analyses, the Galactic absorption is fixed to NH, Gal = 4.19 × 1020 cm−2 (HI4PI Collaboration 2016).
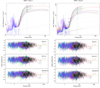 |
Fig. 3. Models and residuals for the two setups assumed in the spectral analysis. Top row: two different setups are shown, adopting the ABSPL model as an example. Left panel: refers to setup A, in which the spectral parameters are the same for all the data sets (labeled with different colors), modulo a normalization constant that encapsulates the nuclear flux variability of the hard X-ray emission alone. Setup B is shown in the right panel, for which the diversity in spectral slope, column density and normalization can be appreciated. Bottom row: data vs. model residuals, as fit with the setup A (left panel), and B (right panel). From top to bottom: ABSPL, BORUS, and WARPDSK models, respectively. |
The data requires multiple components to reproduce the broadband spectrum of NGC 4258. First, we need a soft X-ray component to fit the emission below 2 keV. This has been extensively studied and it is usually fit with two plasma emission models, as discussed in Sect. 3.1. Then, the nuclear hard X-ray emission is generally well described, to the first order, by the “typical” spectrum of a local AGN, namely, a power law modified at low energies by some intervening absorption along the line of sight and declining at high energies as an approximately exponential cutoff. We fixed the high energy cutoff at the median observed value for local Seyfert IIs, that is, 290 keV, which is found to be consistent with that of Seyfert Is (Baloković et al. 2020). When some degree of absorption is present, both a scattered power law at soft energies, mirroring the primary one, as well as a narrow fluorescent Fe Kα line at E ≈ 6.4 keV are also expected. In this particular case, the controversial significance of the line detection which has been somewhat debated in the literature (see, e.g., Reynolds et al. 2009), further motivated us to include in our baseline model a Gaussian line component. Finally, an absorbed power law describing the contamination from the off nuclear point source is taken into account and it is fixed by the best fit values derived from the Chandra spectrum (Sect. 3.2). In XSPEC notation, this baseline model (dubbed “ABSPL”) is written out as:
 (1)
(1)
The ABSPL model provides a very good phenomenological description of the data. However, more recent self-consistent models have been developed, based on Monte Carlo simulations of the radiative transfer of X-ray photons emitted by a central source and propagating through some neutral medium with a given assumed geometry (Ikeda et al. 2009; Murphy & Yaqoob 2009; Brightman & Nandra 2011; Baloković et al. 2018). Therefore, we also fit the broadband spectrum with one such more physically motivated descriptions, namely, the Borus02 (BORUS) model from Baloković et al. (2018). The assumed geometry of the obscuring medium is a homogeneous sphere with polar cutouts, in which the opening angle θoa of the torus, measured from the polar axis of the system, is an adjustable parameter. The covering factor CF, defined as the fraction of the sky as seen from the corona obscured by the torus, in this model is CF = cos θoa, and allows to explore both sphere-like and disk-like geometries. In XSPEC, its implementation is similar to the ABSPL model:
 (2)
(2)
The warped megamaser disk of NGC 4258 has been robustly studied and mapped in detail (e.g., Herrnstein et al. 1998, 2005; Humphreys et al. 2013) and it has been suggested that it may be responsible for the obscuration along the line of sight (Fruscione et al. 2005). Buchner et al. (2021) recently proposed a spectral model, based on a warped disk geometry, which we refer to as WARPDSK. The total emission of WARPDSK is the sum of two components: the primary one (warpeddisk.fits), consisting of photons coming directly from the central source and accounting for Compton scattering and absorption from the warped disk, and a second one (warpeddisk-omni.fits) that comprises the so-called omni-directional scattered component due to photons randomly scattered into our line of sight. This warm mirror emission is the angle-averaged (omni-directional) spectrum, predominantly comprising the incident power law from unobscured lines of sight and effectively replaces the scattered power law of the ABSPL and BORUS models. The free parameter diskfrac basically represents the “strength” of the warp: a diskfrac value that is close to unity suggests a strong warp, while a smaller value hints to a flatter geometry. As such, it can be interpreted as a CF as well, although it is not trivial to directly compare the CF from BORUS with diskfrac in WARPDSK. All the parameters of the omni-directional component are linked to those of the main one – except its normalization, that effectively sets the scattered fraction.
In XSPEC notation, the WARPDSK model is implemented as follows:
 (3)
(3)
4.2. Results
The simplest model is ABSPL with the same parameters for all 17 spectra, modulo a free constant to account for flux variability only (setup A). The reduced χ2 is already acceptable (χ2/d.o.f. = 3976/3761), with the two mekal components and with significantly different temperatures describing the soft emission sufficiently well at < 2 keV (see Sect. 3.1). The hard X-ray power law is obscured by a column of almost 1023 cm−2 and has a slope consistent with a typical value Γ ∼ 1.8.
As expected, the constants encapsulating the flux variability are significantly different from unity (set by the flux of the first XMM-Newton observation). Interestingly, they show a decreasing trend with time: the flux at the last NuSTAR epoch is around ∼25%, while the average Swift/BAT flux is roughly 65%5. The other two models, BORUS and WARPDSK, give results consistent with those of the ABSPL (χ2/d.o.f. = 3969/3760 and χ2/d.o.f. = 3976/3760, respectively; see the bottom left panel of Fig. 3), both in terms of the soft X-ray emission and the hard X-ray coronal slope and obscuration. Across all models, the scattered power law component needed to fit the spectrum in the 1−3 keV range gets washed out at lower energies, due to the thermal plasma emission. The only noticeable difference, although within the uncertainties, is in the intrinsic normalization, which results ∼50% higher adopting the WARPDSK model. Despite this, the combination of the higher normalization with the softer photon index of the WARPDSK model (see Sect. 5.2) gives fully consistent intrinsic 2−10 keV flux (and therefore luminosity) among the models. A detailed comparison with the results from previous work (e.g., Fruscione et al. 2005; Reynolds et al. 2009; Kawamuro et al. 2016; Panagiotou & Walter 2019; Osorio-Clavijo et al. 2022) is not trivial, especially taking into consideration the different and more recent models adopted here. In general, however, our spectral parameters are consistent with those found in the literature.
The ABSPL model allows to make an assessment over the significance of the Fe Kα emission line, whose rest frame energy has been fixed to 6.4 keV: its average equivalent width (EW) results rather low (EW = 45 ± 12 eV), similar to the EW of the Si Kα line identified at ∼1.84 keV. If the energy of the Fe line feature is left free to vary, the accuracy of χ2 is not significantly improved and the energy is well constrained (EFeKα = 6.40 ± 0.03) around the expected value for neutral Fe Kα emission. One clear advantage of both the BORUS and WARPDSK models is their self-consistency in treating radiative transfer within the assumed geometry. As previously mentioned, BORUS has the CF of the torus as a free parameter: when fitting for the CF, we find an upper limit of CF < 0.16, strongly suggesting that the maser disk is responsible for the obscuration and supporting previous independent claims (e.g., Fruscione et al. 2005). Furthermore, if we leave both the NH (representing the line of sight column density) and the parameter log NH, Tor of BORUS (interpreted as a global average NH; see Baloković et al. 2018) free, slightly different values are returned, suggesting that the obscuring medium may be clumpy. The fit with the WARPDSK model in setup A returns a diskfrac parameter of ∼0.9, suggesting a strong warp. The detailed results for setup A are summarized in Table A.1.
The most interesting results are obtained when refining the analysis by leaving the photon index, column density, and coronal flux normalization free for each epoch, namely, by adopting setup B. This setup also allows us to explore whether (and how) the spectral shape and X-ray luminosity of the source have changed over the years. For simplicity, when fitting with BORUS we linked the global average NH of the torus and the line of sight NH. In general, the three models return acceptable fits with much better reduced χ2 with respect to the corresponding setup A. This is not merely due to the increase of the free parameters, as the Δχ2/Δd.o.f. = 356/28, 345/21, 323/23 for the ABSPL, BORUS, and WARPDSK models, respectively (bottom right panel of Fig. 3). This supports evidence for spectral variability between different epochs. Indeed, a clear column density and spectral slope variations are detected, independently of the spectral model assumed, and will be further discussed in Sect. 5. At any given epoch, the three models give consistent results as shown in Table A.2. Both the CF parameter of BORUS and the diskfrac parameter of the WARPDSK model were free to vary but kept linked for all epochs, and the fitted values are significantly different from those of setup A, suggesting a slightly larger CF (CF = 0.37 ± 0.14), and a much less prominent warping of the disk (diskfrac = 0.25 ± 0.01), respectively. This last result could be expected to a certain extent. First, the larger number of free parameters in setup B allows to better fit the spectral shape at each epoch, thus returning a new value for the warp strength which is significantly different from before. Furthermore, as detailed in Buchner et al. (2021), WARPDSK is tailored for heavily Compton-thick AGN, as the vast majority of disk megamasers turn out to be. Hence, the megamaser disk, by construction, has an assigned column log NH/cm−2 = 25 to provide the extreme obscuration that is often observed in the best studied local megamasers (e.g., Arévalo et al. 2014; Puccetti et al. 2014; Bauer et al. 2015; Masini et al. 2016). In this particular case, however, in order to account for the relatively low column density affecting the spectrum, WARPDSK is forced by the fixed inclination of the inner disk (72°, Humphreys et al. 2013) to graze the warp, fitting the diskfrac parameter to the lower reported value.
4.3. NGC 4258 in the context of local, low-λEdd AGN
Disk megamasers, when compared with the local Swift/BAT-selected AGN population, generally occupy the high-end of the λEdd distribution (see, e.g., Fig. 8 of Masini et al. 2019). In this regard, NGC 4258 is definitely peculiar with respect to other disk megamasers, although other Swift/BAT-selected AGN show accretion rates comparable with that of NGC 4258. Thus, it is interesting to consider this source in a broader context, comparing its properties with those of other local, low-Eddington ratio AGN. The sample of 81 local AGN observed by NuSTAR with log λEdd < −3 presented by Osorio-Clavijo et al. (2022), where NGC 4258 is included as a LINER, is the ideal sample for making such a comparison. In terms of the black hole mass, bolometric luminosity, and Eddington ratio, NGC 4258 is fully consistent with the average values found for their sample of local LINERs. The same holds true also regarding its X-ray properties: both the photon index and the average column density are consistent with their respective averages of the LINER sample. In general, the results about NGC 4258 reported in this work and Osorio-Clavijo et al. (2022) are consistent, despite applying different models, and we also do not find any significant contribution by a reflection component in the hard X-ray spectrum of NGC 4258. These findings support the hypothesis that at a low accretion rate, the standard picture of the torus may break down. In the specific case of NGC 4258, the missing reflection component may be a consequence of the low covering factor of the warped maser disk surrounding the AGN.
5. Short and long-term variability
As shown in the previous Section, setup B allows to keep track of the spectral parameters and the luminosity of NGC 4258 as a function of time. Moreover, the last two NuSTAR epochs allow us to also explore the intrinsic, hard X-ray emission from the putative corona. In the following, we thus focus on both the short- and long-term variability of NGC 4258.
5.1. Short term variability
We took advantage of the NuSTAR data to explore the intrinsic hard X-ray variability (i.e., not caused by variable absorption) of the AGN. The background-subtracted 10−40 keV NuSTAR light curve for both ObsIDs is shown in Fig. 4, where the data of the two focal plane modules have been averaged together and binned with a 5 ks bin size. First, we note again that the average, net count rate from NGC 4258 has decreased between the two NuSTAR observations by roughly ∼20%. While the most recent data do not show any particular trend, a clear peak is visible in the first dataset around 17-Nov-2015. We extracted the NuSTAR spectrum of the “mini-flare” and compared it with the quiescent spectrum, finding no significant difference in either spectral slope or column density. This could be due to the relatively weak intensity of the peak, which is actually lower than a 50% increase in the count rate.
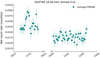 |
Fig. 4. NuSTAR (average of FPMA and FPMB) 10−40 keV light curve across two observations, showing the background-subtracted count rate in bins of 5 ks. The shorter observation of November 2015 displays variability on short timescales (a few ks) that are intrinsic to the source (and not due to obscuration). |
Figure 4 shows that a rise time of ∼20 ks is observed for the mini-flare on 17-Nov-2015. This timescale appears to be halfway between the ones found by Reynolds et al. (2009), who detected both a significant brightening of NGC 4258 during the 2007 Suzaku exposure with a timescale of ∼50 ks, and lower amplitude fluctuations over much shorter timescale of ∼5 ks. Assuming that variability is associated with accretion disk processes, Reynolds et al. (2009) equated these variability timescales with the dynamical time of a Keplerian disk  , to put constraints over the size of the X-ray emitting region. Under the same assumption, the observed timescale of ∼20 ks corresponds to an emitting region size of ∼20rg, where rg = GM/c2 is the usual definition of the gravitational radius.
5.2. Long-term variability and the Fe Kα line
The spectrum of NGC 4258 shows moderate flux variability among the XMM-Newton and NuSTAR observations, as previously reported in the literature, and as also demonstrated in our analysis. Therefore, we collected the spectral parameters of the three models employed in Sect. 4 as a function of time, along with previous results from the literature. This allows us to explore the long-term behavior of NGC 4258, spanning 23 years, between 1993 and 2016.
The first panel from the top of Fig. 5 shows the variability of the X-ray obscuring column density NH. The column density is always around ∼1023 cm−2, with fluctuations of a factor of ∼2. As detailed in Fruscione et al. (2005), NH has been observed to increase over a few months timescale in 2001, with an associated length scale of about 1015 cm, very similar to the expected scale height of a standard thin accretion disk. We find a fully consistent trend in the first five XMM-Newton epochs analyzed here, in which NH increases from ∼8 × 1022 cm−2 to ∼14 × 1022 cm−2 over Δt = 530 days. Assuming that the absorbing gas is located at the radius where the warp is expected to cross the line of sight, that is, R ∼ 0.3 pc, and that it orbits in a Keplerian rotation the central mass of M = 4 × 10⁷ M⊙, the orbital velocity is  km s−1. The characteristic size is then s = vΔt ∼ 3.5 × 1015 cm. Assuming the typical density for masers to occur ρ ∼ 108 cm−3, and the column density variation ΔNH ∼ 6 × 1022 cm−2, the associated depth variation (i.e., size along the line of sight) is ΔL ∼ ΔNH/ρ ∼ 6 × 1015 cm, which is roughly twice the previously derived characteristic size, s. This increase in column density could be obtained either by doubling the number of clouds along the line of sight or doubling the density of the absorbing medium. Interestingly, the column density seems to oscillate more or less regularly on a timescale of about 10 years, as suggested by the sinusoidal function with a period of 10 years we have plotted over the data. Although the reduced χ2 of fitting a simple sinusoidal function to the data is large enough to reject the null hypothesis (
 ), a simple linear fit with roughly constant column density returns a much worse result (
 ). If this remarkable, oscillatory trend is confirmed, its period (∼10 yr) is much shorter than the orbital period at the warp radius (∼2600 yr), and it may suggest periodic density variations in the absorbing gas, happening on a temporal scale of 5–10 yr. This timescale corresponds to a linear scale of 1−2 × 1016 cm (0.003−0.006 pc) at the warp radius. Interestingly, spiral density waves have been proposed to explain the periodicity and clustering of the masers in NGC 4258 (Humphreys et al. 2008). In the same paper, Humphreys et al. (2008) show that massive He I stars with a mass of 50−100 M⊙, comparable to those found in the Galactic center (Genzel et al. 2003), would be able to create gaps in the maser disk, with a size consistent with that observed here, and potentially responsible for the column density fluctuations. The second panel from the top shows the long term evolution of the photon index Γ. It is generally measured between 1.6−2.0, and there is no significant variability. We note that, at any given epoch, the WARPDSK model tends to return systematically softer (although statistically consistent) photon indices with respect to the ABSPL and BORUS models. The third panel of Fig. 5 shows the intrinsic, absorption-corrected 2−10 keV luminosity: after the early 2000s, the luminosity has been steadily decreasing, by a factor of ∼3. The 2007 Suzaku observation seems to be the exception to this trend but, as mentioned previously, Reynolds et al. (2009) caught NGC 4258 in a bright flux state during this observation. Since the luminosity is already corrected for variable absorption, the data strongly suggest that NGC 4258 is constantly getting fainter during the period considered. It is interesting to compare the intrinsic 2−10 keV luminosity derived here from that expected from the well known 12 μm–2−10 keV correlation. NGC 4258 has a nuclear 12 μm luminosity log L12 μm/erg s−1 = 41.26 ± 0.05, from which an expected log L2−10 keV/erg s−1 = 41.03 ± 0.04 is derived (Asmus et al. 2015). This luminosity is consistent with that measured until the early 2000s, while the MIR observations described in Asmus et al. (2015) refer to the years 2010–2011, when NGC 4258 was already a factor of about 2 fainter, according to our results. If there are no sources of contamination contributing significantly to the 12 μm flux, and if NGC 4258 has kept steadily decreasing its X-ray luminosity, this result could suggest a lag of the MIR with respect to the X-ray emission of at least a decade, thereby placing the MIR-emitting dust on a scale of ∼3 pc.
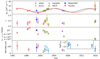 |
Fig. 5. Long-term evolution of the main spectral parameters. From top to bottom: column density in units of 1022 cm−2, photon index Γ (generally between 1.6−2.0), intrinsic (de-absorbed) 2−10 keV luminosity, EW of the Fe Kα line (only for the ABSPL model and for values from the literature; the inset shows the logarithmic flux of the Fe Kα line in the ABSPL model, for the data considered in this work). The values referring to the three models employed in our analysis are labeled with different empty markers and colors (blue circles, orange squares and green upward triangles for the ABSPL, BORUS, and WARPDSK models, respectively), and are fully consistent with each other. Red diamonds, the blue star and the purple downward triangle refer to ASCA (Reynolds et al. 2000; Terashima et al. 2002), BeppoSAX (Fiore et al. 2001), and Suzaku (Reynolds et al. 2009) observations, respectively. Top panel: dashed black line is a simple sinusoid with a period of 10 years, and it is not a fit to the data. Most notably, the intrinsic de-absorbed 2–10 keV luminosity shows an approximately steady decrease of more than a factor of 3 over ∼20 years. |
Finally, the behavior of the Fe Kα line (bottom panel of Fig. 5) is not easy to interpret. While the first ASCA observations suggested the presence of a moderately prominent emission line with an EW around ∼100 eV, the subsequent XMM-Newton observations we have considered in this work set only upper limits and never firmly detect the line, apart from the 2007 epoch (Reynolds et al. 2009), in which the line has in any case a modest EW. In the two most recent NuSTAR epochs, the line has been marginally detected only in the last (and longer) observation. This could be due to the more stable and systematically lower count rate of the source during the last NuSTAR epoch, as shown in Fig. 4, which would make the line stand out more easily. If this hypothesis is correct, this would also imply that the Fe line is produced on large scales (∼ pc scale) and lags significantly behind the continuum, differently from the inner disk origin interpretation of Reynolds et al. (2009). Independently of its origin interpretation, the line EW from the NuSTAR epochs is consistent with that reported by Reynolds et al. (2009). The inset in the last panel of Fig. 5 shows the logarithmic flux of the Fe Kα line for the spectra that we analyze in this work, derived through the XSPEC command cflux. The behavior of the line flux is fully consistent with what is seen for its EW.
6. Discussion
The comparison of the X-ray spectra of NGC 4258 across two decades has shown that its X-ray properties have changed through the years both due to variations (by a factor of ∼2) of the absorbing column density, plausibly associated with the dusty megamaser disk, as well as to intrinsic changes in the emission from the central engine; most notably the coronal luminosity, which appears to have steadily decreased by a factor of ∼3 across close to 15 years, the only exception being the Suzaku observation, which caught the source in a high state (Reynolds et al. 2009).
The short variability timescale (∼20 ks) observed in the hard X-ray NuSTAR data suggests that the variations might be due to changes in the accretion rate, which is, in turn, related to the rate of energy deposition in the corona. Accretion rate variability would also explain the long term decrease in intrinsic luminosity observed through 15 years of observations. The viscous timescale of a standard thin disk is generally much longer than few years. On the other hand, the SEDs of low-luminosity AGN such as NGC 4258 are often explained in the context of RIAFs, namely, based on a combination of truncated Shakura & Sunyaev (1973) disks with inner ADAFs and relativistic jets. Past efforts have successfully explained the broadband SED of NGC 4258 with such a model, albeit with their own shortcomings (e.g., Yuan et al. 2002; Wu et al. 2013). Interestingly, the viscous timescale is ∝(r/H)2, thus becoming significantly shorter for an ADAF (Narayan & Yi 1995). Both the Shakura & Sunyaev (1973) and the RIAF models are in turn part of the so-called standard and normal evolution (SANE) models, in which the magnetic field is assumed to not significantly impact the dynamics of the disk. In opposition to SANE, there are magnetically arrested disk models (MAD; Narayan et al. 2003) that are expected to form when the accretion flow is supplied with a sufficient amount of magnetic flux. Unfortunately, it is difficult to observationally disentangle the two families of models (Xie & Zdziarski 2019).
Furthermore, given the above results, it is not a trivial step to discriminate between a RIAF and a standard thin disk. Indeed, the absorption-corrected X-ray luminosity LX, combined with archival determinations of the bolometric luminosity, implies a bolometric correction of kbol ∼ 20, which is intriguingly typical of Seyferts powered by accretion through thin disks (Lusso et al. 2012; Duras et al. 2020). We note, however, that NGC 4258 could nonetheless be in a “sweet spot” where the bolometric correction is consistent with that of a typical Seyfert, with it still being powered by a RIAF (Nemmen et al. 2014). Moreover, its average photon index Γ ∼ 1.8 is consistent with the typical value of the broader AGN population (e.g., Ricci et al. 2017). Thus, our work suggests that NGC 4258 is a standard, low-luminosity Seyfert II, despite its accretion rate in Eddington units being well within the expected RIAF regime.
Further discussions arise when considering the X-ray photon index Γ as a function of X-ray Eddington ratio λX = LX/LEdd (Fig. 6). Previous works have found somewhat conflicting results related to the Γ − λEdd correlation: Brightman et al. (2013, 2016) found a positive correlation between these two quantities, both for unobscured and heavily obscured AGN. On the other hand, Trakhtenbrot et al. (2017) found a much shallower correlation using a large, local Swift/BAT-selected sample. In analyzing a sample of low-luminosity AGN, Gu & Cao (2009) instead found an anti-correlation, similar to what is observed for X-ray binaries in the hard state (e.g., Liu et al. 2019). In our case, the spanned range in λX is around one order of magnitude, and there does not appear to be any significant correlation between the two quantities considering the whole range. A possible anti-correlation may exist for log λX < −5, similar to what is observed in other low-luminosity AGN (e.g., Kawamuro et al. 2016) and this may suggest a transition between hot and cold accretion flows below and above a critical value, namely, log λX = −5. Assuming a typical bolometric correction on the order of ∼20, this critical value would roughly correspond to λEdd ∼ 10−4, which appears to be somewhat low for the transition between cold and hot accretion flows. However, this may suggest a MAD scenario to be in place, given the lower accretion rate at which a cold solution may still exist, with respect to SANE models (Xie & Zdziarski 2019). In summary, if the change of slope in the Γ − λX plane is real, we may be witnessing the switch between cold and hot accretion flows in NGC 4258. Of course, at log λX ≲ −5, there are just three data points at the moment, so future observations are highly warranted to support or discard this finding, especially if the trend of steady decrease in X-ray luminosity is eventually confirmed.
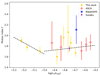 |
Fig. 6. Photon index Γ as a function of the X-ray Eddington ratio λX (λX = LX/LEdd). Yellow points, red diamonds, blue star, and purple triangle refer to the data analyzed in this work with the BORUS model and to archival ASCA, BeppoSAX, and Suzaku data, respectively. Black dashed lines are simple linear fits below and above the separation value of log λX = −5 (broadly corresponding to a canonical Eddington ratio of ≈10−4 for a bolometric correction on the order of 10), indicating two possible regimes. |
7. Conclusions
In this paper, we analyze the accretion properties of a well-studied, nearby low-luminosity AGN, NGC 4258. We collected and re-analyzed Chandra, XMM-Newton, NuSTAR, and Swift/BAT observations, building a broadband X-ray spectrum (0.3−150 keV) that spans from the early 2000s up to 2016; furthermore, we added results from earlier archival observations taken from the literature, for a total timespan of ∼23 yr. Our main findings are as follows:
-
The soft X-ray emission (E < 2 keV) is stable across the years (Fig. 2) and it is well described by emission from hot plasma consistent with that found in the anomalous arms on kpc scales.
-
The hard X-ray emission (E > 2 keV), on the other hand, displays significant variability (Fig. 2), both on timescales of hours (Fig. 4) and years (Fig. 5) and that are both intrinsic and due to absorbing gas.
-
We employed three different models to fit the dataset of 17 spectra: a simple absorbed power law, a torus, and a warped disk. All three models gave consistent results over the spectral parameters, either when fitting the data simultaneously with a single model or when a full spectral variability is allowed for (Fig. 3).
-
The average spectral properties of NGC 4258 are typical of low-luminosity obscured Seyferts, with a photon index and column density fluctuating in the range of Γ = 1.6−2.2 and NH = 0.8−2.1 × 1023 cm−2, respectively (Fig. 5).
-
The obscuring column density shows fluctuations of a factor of two, as previously reported in the literature. Its variations appear to be qualitatively periodic, with a period of about 10 yr (Fig. 5). If confirmed, this trend would suggest smooth density variations, possibly induced by spiral density waves or gaps (or both) in the disk carved by massive He I stars.
-
The Fe Kα line, as previously reported in the literature, is weak, with an average EW = 45 ± 12 eV. Its detectability is significantly different in comparison to the dataset considered here, and in only two epochs, it is detected at a ∼2σ level of confidence (Fig. 5).
-
The absorption-corrected, intrinsic 2−10 keV luminosity is observed to be almost steadily decreasing by a factor of 3 on the timescale between 2000 and 2016 (Fig. 5).
-
The variations in photon index and luminosity appear to follow two different behaviors (Fig. 6): when the source is brighter than a certain critical value in X-ray-scaled Eddington ratio (log λX > −5), no apparent trend is seen; at lower accretion rate, there seems to be an anti-correlation between the two quantities, which may indicate a transition between hot and cold accretion states; this is comparable to what is observed in X-ray binaries.
In summary, NGC 4258 offers a unique opportunity to explore the details of accretion onto a SMBH at low accretion rate. However, despite being one of the closest and most studied AGN, the true nature and geometry of its inner accretion disk are still elusive. Future observations, in conjunction with more sophisticated modeling, will be key to unravel the mysteries of this unique AGN.
The bolometric luminosity of NGC 4258 has been historically estimated in the literature through SED fitting (Lasota et al. 1996; Yuan et al. 2002; Wu et al. 2013), and has been found to be around ∼10−4 times the Eddington luminosity. The optical/UV data employed by those works are either upper limits from continuum observations, or those by Wilkes et al. (1995), who directly detected the nucleus of NGC 4258 in polarized light at 5500 Å.
When simultaneously fitting datasets from different instruments, a multiplicative cross-calibration constant is usually considered. However, in this case, we do not include a cross-calibration constant in setup A, since the cross-calibration uncertainty is much smaller (∼10−15%; Madsen et al. 2015, 2017) than the observed flux spread, and the fit would be insensitive to its value.
In setup B, we have fitted at each epoch the cross-calibration constant among cameras of the same instrument (see Table A.2).
Taking the Swift/BAT flux as a reference, this means that the first XMM-Newton and last NuSTAR epochs caught NGC 4258 with a flux ∼54% higher and ∼62% lower than the average, respectively.
Acknowledgments
We thank J. Buchner for useful guidance in using the warped disk model. This work made use of data from the NuSTAR mission, a project led by the California Institute of Technology, managed by the Jet Propulsion Laboratory, and funded by the National Aeronautics and Space Administration. This research made use of the NuSTAR Data Analysis Software (NuSTARDAS) jointly developed by the ASI Science Data Center (ASDC, Italy) and the California Institute of Technology (USA). This research has also made use of data obtained from the Chandra Data Archive and software provided by the Chandra X-ray Center (CXC). This work is also based on observations obtained with XMM-Newton, an ESA science mission with instruments and contributions directly funded by ESA Member States and NASA. We acknowledge the use of public data from the Swift data archive. P. B. acknowledges financial support from the Czech Science Foundation project No. 22-22643S.
References
- Arévalo, P., Bauer, F. E., Puccetti, S., et al. 2014, ApJ, 791, 81 [CrossRef] [Google Scholar]
- Arnaud, K. A. 1996, in Astronomical Data Analysis Software and Systems V, eds. G. H. Jacoby, & J. Barnes, ASP Conf. Ser., 101, 17 [NASA ADS] [Google Scholar]
- Asmus, D., Gandhi, P., Hönig, S. F., Smette, A., & Duschl, W. J. 2015, MNRAS, 454, 766 [NASA ADS] [CrossRef] [Google Scholar]
- Baloković, M., Brightman, M., Harrison, F. A., et al. 2018, ApJ, 854, 42 [Google Scholar]
- Baloković, M., Harrison, F. A., Madejski, G., et al. 2020, ApJ, 905, 41 [Google Scholar]
- Barthelmy, S. D., Barbier, L. M., Cummings, J. R., et al. 2005, Space Sci. Rev., 120, 143 [Google Scholar]
- Bauer, F. E., Arévalo, P., Walton, D. J., et al. 2015, ApJ, 812, 116 [Google Scholar]
- Blandford, R. D., & Begelman, M. C. 1999, MNRAS, 303, L1 [NASA ADS] [CrossRef] [Google Scholar]
- Brightman, M., & Nandra, K. 2011, MNRAS, 413, 1206 [NASA ADS] [CrossRef] [Google Scholar]
- Brightman, M., Silverman, J. D., Mainieri, V., et al. 2013, MNRAS, 433, 2485 [Google Scholar]
- Brightman, M., Masini, A., Ballantyne, D. R., et al. 2016, ApJ, 826, 93 [NASA ADS] [CrossRef] [Google Scholar]
- Buchner, J., Brightman, M., Baloković, M., et al. 2021, A&A, 651, A58 [NASA ADS] [CrossRef] [EDP Sciences] [Google Scholar]
- Chary, R., Becklin, E. E., Evans, A. S., et al. 2000, ApJ, 531, 756 [NASA ADS] [CrossRef] [Google Scholar]
- Claussen, M. J., Heiligman, G. M., & Lo, K. Y. 1984, Nature, 310, 298 [NASA ADS] [CrossRef] [Google Scholar]
- Courtes, G., Petit, H., Hua, C. T., et al. 1993, A&A, 268, 419 [NASA ADS] [Google Scholar]
- Davis, J. E. 2001, ApJ, 562, 575 [NASA ADS] [CrossRef] [Google Scholar]
- Duras, F., Bongiorno, A., Ricci, F., et al. 2020, A&A, 636, A73 [NASA ADS] [CrossRef] [EDP Sciences] [Google Scholar]
- Fiore, F., Pellegrini, S., Matt, G., et al. 2001, ApJ, 556, 150 [NASA ADS] [CrossRef] [Google Scholar]
- Fruscione, A., Greenhill, L. J., Filippenko, A. V., et al. 2005, ApJ, 624, 103 [NASA ADS] [CrossRef] [Google Scholar]
- Fruscione, A., McDowell, J. C., Allen, G. E., et al. 2006, Proc. SPIE, 6270, 62701V [Google Scholar]
- Gammie, C. F., Narayan, R., & Blandford, R. 1999, ApJ, 516, 177 [NASA ADS] [CrossRef] [Google Scholar]
- Gehrels, N., Chincarini, G., Giommi, P., et al. 2004, ApJ, 611, 1005 [Google Scholar]
- Genzel, R., Schödel, R., Ott, T., et al. 2003, ApJ, 594, 812 [Google Scholar]
- Gu, M., & Cao, X. 2009, MNRAS, 399, 349 [NASA ADS] [CrossRef] [Google Scholar]
- Harrison, F. A., Craig, W. W., Christensen, F. E., et al. 2013, ApJ, 770, 103 [Google Scholar]
- Herrnstein, J. R., Greenhill, L. J., Moran, J. M., et al. 1998, ApJ, 497, L69 [NASA ADS] [CrossRef] [Google Scholar]
- Herrnstein, J. R., Moran, J. M., Greenhill, L. J., & Trotter, A. S. 2005, ApJ, 629, 719 [NASA ADS] [CrossRef] [Google Scholar]
- HI4PI Collaboration (Ben Bekhti, N., et al.) 2016, A&A, 594, A116 [NASA ADS] [CrossRef] [EDP Sciences] [Google Scholar]
- Humphreys, E. M. L., Reid, M. J., Greenhill, L. J., Moran, J. M., & Argon, A. L. 2008, ApJ, 672, 800 [NASA ADS] [CrossRef] [Google Scholar]
- Humphreys, E. M. L., Reid, M. J., Moran, J. M., Greenhill, L. J., & Argon, A. L. 2013, ApJ, 775, 13 [Google Scholar]
- Ikeda, S., Awaki, H., & Terashima, Y. 2009, ApJ, 692, 608 [Google Scholar]
- Jansen, F., Lumb, D., Altieri, B., et al. 2001, A&A, 365, L1 [NASA ADS] [CrossRef] [EDP Sciences] [Google Scholar]
- Kawamuro, T., Ueda, Y., Tazaki, F., Terashima, Y., & Mushotzky, R. 2016, ApJ, 831, 37 [NASA ADS] [CrossRef] [Google Scholar]
- Kuo, C. Y., Braatz, J. A., Condon, J. J., et al. 2011, ApJ, 727, 20 [NASA ADS] [CrossRef] [Google Scholar]
- Kuo, C. Y., Braatz, J. A., Lo, K. Y., et al. 2015, ApJ, 800, 26 [NASA ADS] [CrossRef] [Google Scholar]
- Lasota, J. P., Abramowicz, M. A., Chen, X., et al. 1996, ApJ, 462, 142 [NASA ADS] [CrossRef] [Google Scholar]
- Liu, H., Dong, A., Weng, S., & Wu, Q. 2019, MNRAS, 487, 5335 [NASA ADS] [CrossRef] [Google Scholar]
- Lusso, E., Comastri, A., Simmons, B. D., et al. 2012, MNRAS, 425, 623 [Google Scholar]
- Madsen, K. K., Harrison, F. A., Markwardt, C. B., et al. 2015, ApJS, 220, 8 [Google Scholar]
- Madsen, K. K., Beardmore, A. P., Forster, K., et al. 2017, AJ, 153, 2 [Google Scholar]
- Makishima, K., Fujimoto, R., Ishisaki, Y., et al. 1994, PASJ, 46, L77 [NASA ADS] [Google Scholar]
- Masini, A., Comastri, A., Baloković, M., et al. 2016, A&A, 589, A59 [NASA ADS] [CrossRef] [EDP Sciences] [Google Scholar]
- Masini, A., Comastri, A., Hickox, R. C., et al. 2019, ApJ, 882, 83 [Google Scholar]
- Mewe, R., Gronenschild, E. H. B. M., & van den Oord, G. H. J. 1985, A&AS, 62, 197 [NASA ADS] [Google Scholar]
- Miyoshi, M., Moran, J., Herrnstein, J., et al. 1995, Nature, 373, 127 [NASA ADS] [CrossRef] [Google Scholar]
- Murphy, K. D., & Yaqoob, T. 2009, MNRAS, 397, 1549 [Google Scholar]
- Mushotzky, R. F., Done, C., & Pounds, K. A. 1993, ARA&A, 31, 717 [NASA ADS] [CrossRef] [Google Scholar]
- Nakai, N., Inoue, M., & Miyoshi, M. 1993, Nature, 361, 45 [NASA ADS] [CrossRef] [Google Scholar]
- Narayan, R., & Yi, I. 1995, ApJ, 452, 710 [NASA ADS] [CrossRef] [Google Scholar]
- Narayan, R., Igumenshchev, I. V., & Abramowicz, M. A. 2003, PASJ, 55, L69 [NASA ADS] [Google Scholar]
- Nemmen, R. S., Storchi-Bergmann, T., & Eracleous, M. 2014, MNRAS, 438, 2804 [Google Scholar]
- Neufeld, D. A., & Maloney, P. R. 1995, ApJ, 447, L17 [NASA ADS] [Google Scholar]
- Ogle, P. M., Lanz, L., & Appleton, P. N. 2014, ApJ, 788, L33 [NASA ADS] [CrossRef] [Google Scholar]
- Oh, K., Koss, M., Markwardt, C. B., et al. 2018, ApJS, 235, 4 [Google Scholar]
- Osorio-Clavijo, N., González-Martín, O., Sánchez-Sánchez, S. F., et al. 2022, MNRAS, 510, 5102 [NASA ADS] [CrossRef] [Google Scholar]
- Panagiotou, C., & Walter, R. 2019, A&A, 626, A40 [NASA ADS] [CrossRef] [EDP Sciences] [Google Scholar]
- Pesce, D. W., Braatz, J. A., Reid, M. J., et al. 2020, ApJ, 891, L1 [Google Scholar]
- Pietsch, W., & Read, A. M. 2002, A&A, 384, 793 [NASA ADS] [CrossRef] [EDP Sciences] [Google Scholar]
- Puccetti, S., Comastri, A., Fiore, F., et al. 2014, ApJ, 793, 26 [NASA ADS] [CrossRef] [Google Scholar]
- Reid, M. J., Pesce, D. W., & Riess, A. G. 2019, ApJ, 886, L27 [Google Scholar]
- Reynolds, C. S., Nowak, M. A., & Maloney, P. R. 2000, ApJ, 540, 143 [NASA ADS] [CrossRef] [Google Scholar]
- Reynolds, C. S., Nowak, M. A., Markoff, S., et al. 2009, ApJ, 691, 1159 [NASA ADS] [CrossRef] [Google Scholar]
- Ricci, C., Trakhtenbrot, B., Koss, M. J., et al. 2017, ApJS, 233, 17 [Google Scholar]
- Shakura, N. I., & Sunyaev, R. A. 1973, A&A, 24, 337 [NASA ADS] [Google Scholar]
- Terashima, Y., Iyomoto, N., Ho, L. C., & Ptak, A. F. 2002, ApJS, 139, 1 [CrossRef] [Google Scholar]
- Trakhtenbrot, B., Ricci, C., Koss, M. J., et al. 2017, MNRAS, 470, 800 [NASA ADS] [CrossRef] [Google Scholar]
- Weisskopf, M. C., Tananbaum, H. D., Van Speybroeck, L. P., & O’Dell, S. L. 2000, in X-Ray Optics, Instruments, and Missions III, eds. J. E. Truemper, & B. Aschenbach, Proc. SPIE, 4012, 2 [NASA ADS] [CrossRef] [Google Scholar]
- Wilkes, B. J., Schmidt, G. D., Smith, P. S., Mathur, S., & McLeod, K. K. 1995, ApJ, 455, L13 [NASA ADS] [Google Scholar]
- Wilson, A. S., Yang, Y., & Cecil, G. 2001, ApJ, 560, 689 [NASA ADS] [CrossRef] [Google Scholar]
- Wu, Q., Yan, H., & Yi, Z. 2013, MNRAS, 436, 1278 [NASA ADS] [CrossRef] [Google Scholar]
- Xie, F.-G., & Zdziarski, A. A. 2019, ApJ, 887, 167 [NASA ADS] [CrossRef] [Google Scholar]
- Young, A. J., & Wilson, A. S. 2004, ApJ, 601, 133 [NASA ADS] [CrossRef] [Google Scholar]
- Yuan, F., Markoff, S., Falcke, H., & Biermann, P. L. 2002, A&A, 391, 139 [NASA ADS] [CrossRef] [EDP Sciences] [Google Scholar]
Appendix A: Additional tables
Results of the analysis with the three models assumed in setup A.
Results of the analysis with the three models assumed in setup B.
All Tables
All Figures
|
Fig. 1. Chandra ACIS-S 0.5−7.0 keV imaging of NGC 4258. Left: green box labels the extraction region of the soft, diffuse emission, while the red dashed box marks the size of the zoomed inset in the right panel. Right: zoom-in on the nuclear region with the off-nuclear source clearly visible. Its spectrum has been extracted from the green circular region. The red dashed box marks the corresponding size of the zoomed inset in the left panel. In both panels, north is up and east to the left. |
| In the text | |
|
Fig. 2. Broadband 0.3−195 keV spectrum of NGC 4258, composed of the 17 spectra analyzed in this work (12 XMM-Newton, 4 NuSTAR and 1 Swift/BAT) spanning more than 15 years of observations. While the soft emission ≲2 keV is due to extended plasma and is constant throughout the years, the harder component shows significant variability across different observations. In particular, NGC 4258 was caught in its faintest state during the NuSTAR observations. The spectral turnover below 4−5 keV is due to the moderate absorption, possibly due to the line of sight intercepting the warped maser disk. |
| In the text | |
|
Fig. 3. Models and residuals for the two setups assumed in the spectral analysis. Top row: two different setups are shown, adopting the ABSPL model as an example. Left panel: refers to setup A, in which the spectral parameters are the same for all the data sets (labeled with different colors), modulo a normalization constant that encapsulates the nuclear flux variability of the hard X-ray emission alone. Setup B is shown in the right panel, for which the diversity in spectral slope, column density and normalization can be appreciated. Bottom row: data vs. model residuals, as fit with the setup A (left panel), and B (right panel). From top to bottom: ABSPL, BORUS, and WARPDSK models, respectively. |
| In the text | |
|
Fig. 4. NuSTAR (average of FPMA and FPMB) 10−40 keV light curve across two observations, showing the background-subtracted count rate in bins of 5 ks. The shorter observation of November 2015 displays variability on short timescales (a few ks) that are intrinsic to the source (and not due to obscuration). |
| In the text | |
|
Fig. 5. Long-term evolution of the main spectral parameters. From top to bottom: column density in units of 1022 cm−2, photon index Γ (generally between 1.6−2.0), intrinsic (de-absorbed) 2−10 keV luminosity, EW of the Fe Kα line (only for the ABSPL model and for values from the literature; the inset shows the logarithmic flux of the Fe Kα line in the ABSPL model, for the data considered in this work). The values referring to the three models employed in our analysis are labeled with different empty markers and colors (blue circles, orange squares and green upward triangles for the ABSPL, BORUS, and WARPDSK models, respectively), and are fully consistent with each other. Red diamonds, the blue star and the purple downward triangle refer to ASCA (Reynolds et al. 2000; Terashima et al. 2002), BeppoSAX (Fiore et al. 2001), and Suzaku (Reynolds et al. 2009) observations, respectively. Top panel: dashed black line is a simple sinusoid with a period of 10 years, and it is not a fit to the data. Most notably, the intrinsic de-absorbed 2–10 keV luminosity shows an approximately steady decrease of more than a factor of 3 over ∼20 years. |
| In the text | |
|
Fig. 6. Photon index Γ as a function of the X-ray Eddington ratio λX (λX = LX/LEdd). Yellow points, red diamonds, blue star, and purple triangle refer to the data analyzed in this work with the BORUS model and to archival ASCA, BeppoSAX, and Suzaku data, respectively. Black dashed lines are simple linear fits below and above the separation value of log λX = −5 (broadly corresponding to a canonical Eddington ratio of ≈10−4 for a bolometric correction on the order of 10), indicating two possible regimes. |
| In the text | |
Current usage metrics show cumulative count of Article Views (full-text article views including HTML views, PDF and ePub downloads, according to the available data) and Abstracts Views on Vision4Press platform.
Data correspond to usage on the plateform after 2015. The current usage metrics is available 48-96 hours after online publication and is updated daily on week days.
Initial download of the metrics may take a while.