Open Access
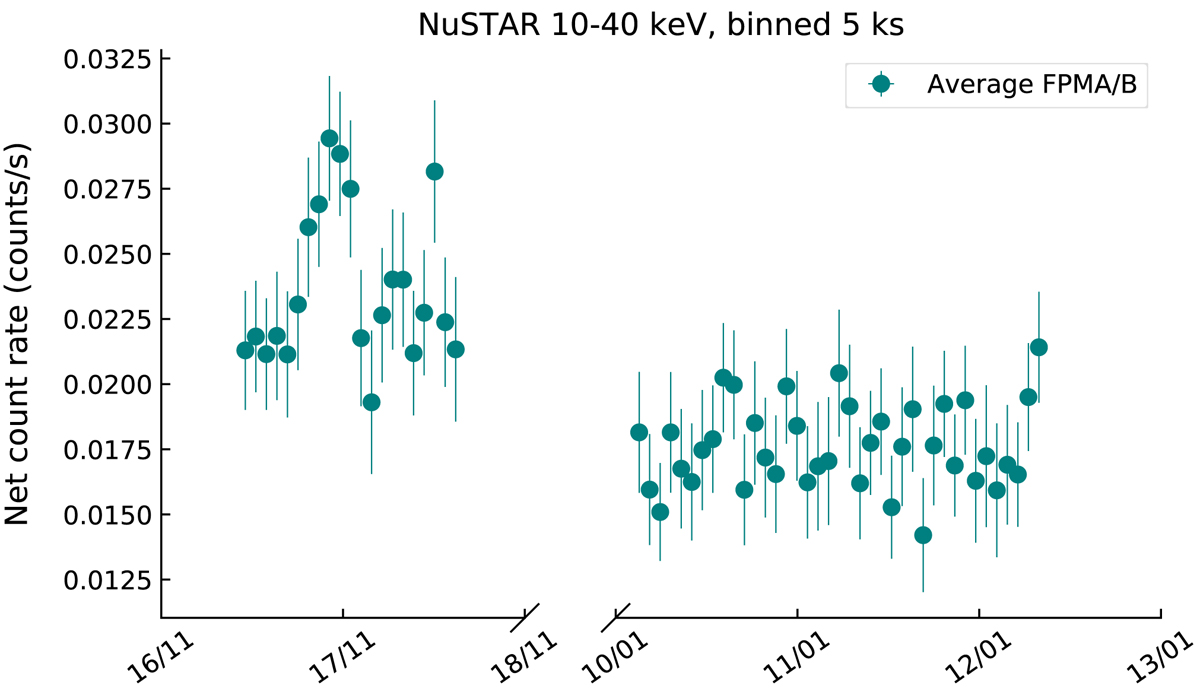
Fig. 4.
Download original image
NuSTAR (average of FPMA and FPMB) 10−40 keV light curve across two observations, showing the background-subtracted count rate in bins of 5 ks. The shorter observation of November 2015 displays variability on short timescales (a few ks) that are intrinsic to the source (and not due to obscuration).
Current usage metrics show cumulative count of Article Views (full-text article views including HTML views, PDF and ePub downloads, according to the available data) and Abstracts Views on Vision4Press platform.
Data correspond to usage on the plateform after 2015. The current usage metrics is available 48-96 hours after online publication and is updated daily on week days.
Initial download of the metrics may take a while.