Fig. 3.
Download original image
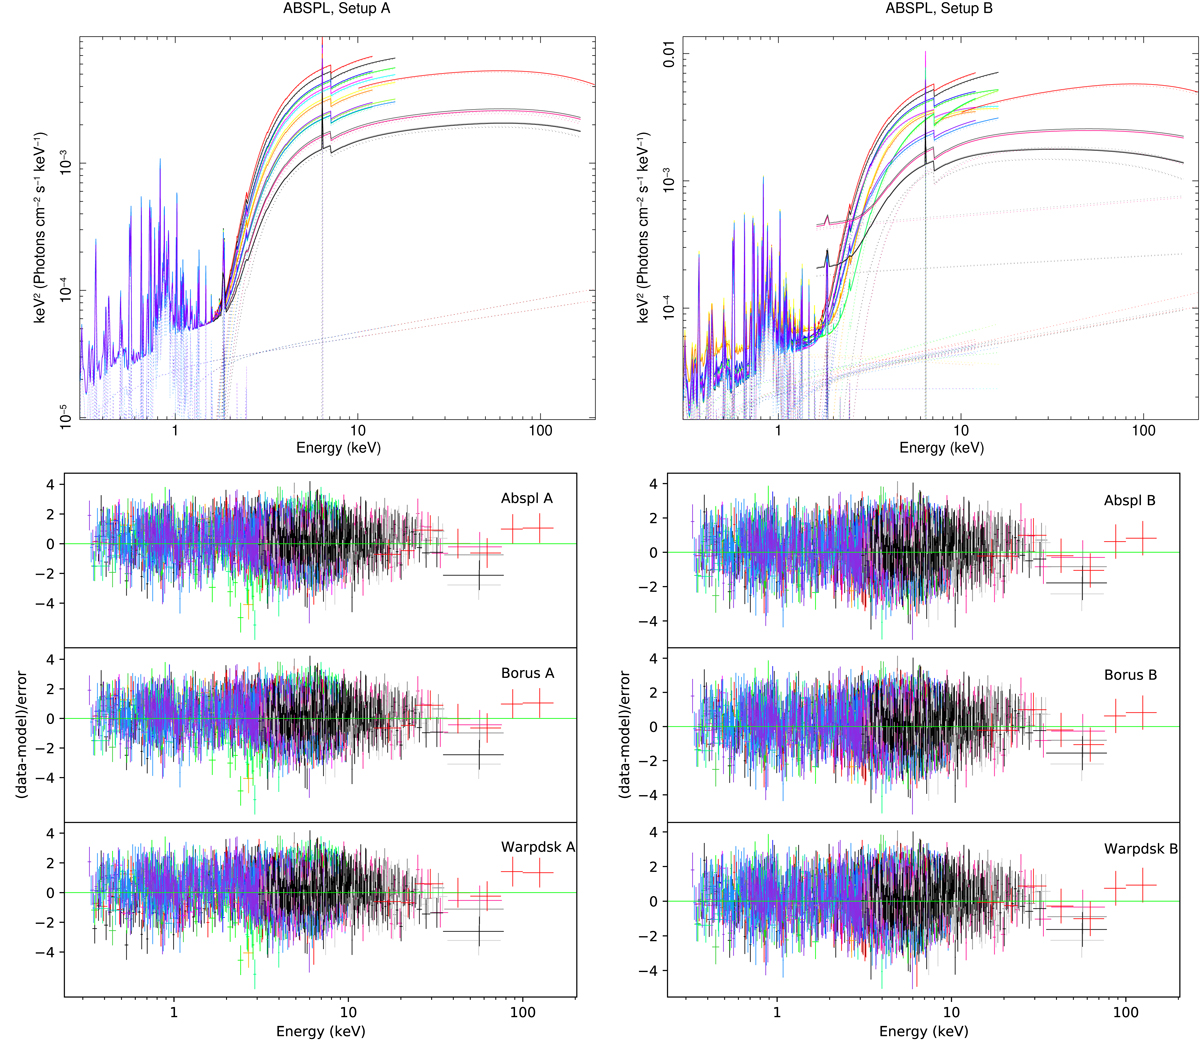
Models and residuals for the two setups assumed in the spectral analysis. Top row: two different setups are shown, adopting the ABSPL model as an example. Left panel: refers to setup A, in which the spectral parameters are the same for all the data sets (labeled with different colors), modulo a normalization constant that encapsulates the nuclear flux variability of the hard X-ray emission alone. Setup B is shown in the right panel, for which the diversity in spectral slope, column density and normalization can be appreciated. Bottom row: data vs. model residuals, as fit with the setup A (left panel), and B (right panel). From top to bottom: ABSPL, BORUS, and WARPDSK models, respectively.
Current usage metrics show cumulative count of Article Views (full-text article views including HTML views, PDF and ePub downloads, according to the available data) and Abstracts Views on Vision4Press platform.
Data correspond to usage on the plateform after 2015. The current usage metrics is available 48-96 hours after online publication and is updated daily on week days.
Initial download of the metrics may take a while.