Fig. 3
Download original image
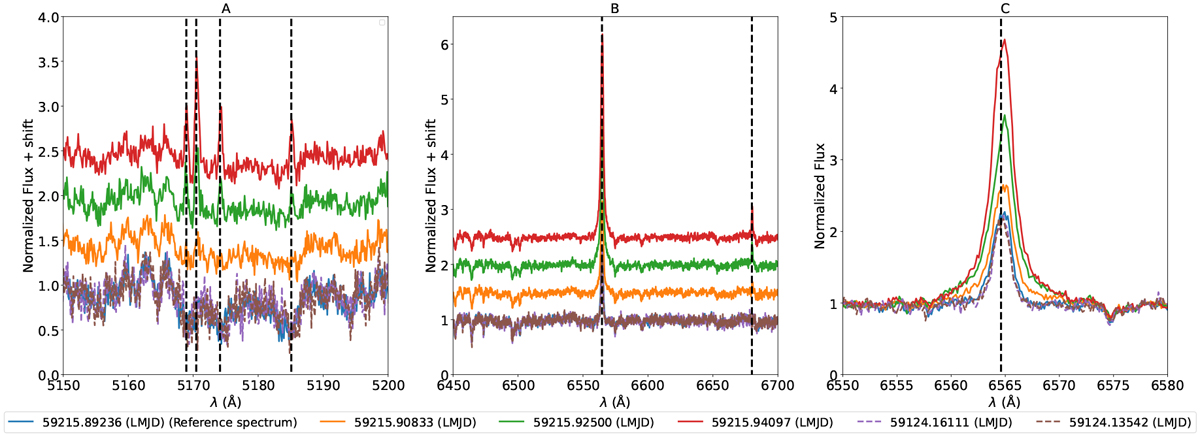
Pre-processed spectra of CME candidate 1 (four solid lines) and the reference spectra of the host star (two dashed lines). Each spectrum is marked with the LAMOST local modified Julian day (LMJD) at the time of exposure. Panel A is part of the blue arm (5150–5200 Å), which contains the Mg I triplet lines (5168.94 Å, 5174.13 Å, and 5185.10 Å) and the Fe II 5170.47 Å line. The rest wavelengths of these chromospheric lines are marked with the vertical dotted black lines. Panel B is part of the red arm (6450–6700 Å), which contains the Hα (6564.61 Å) line and the He I 6680 Å line. The vacuum wavelengths of these lines are taken from van Hoof (2018). In panels A and B, the spectra of CME candidate 1 observed at different times are shifted on the vertical axis for a better illustration. In order to clearly show the changes in the Hα line profiles, the spectra near the Hα line are plotted in panel C.
Current usage metrics show cumulative count of Article Views (full-text article views including HTML views, PDF and ePub downloads, according to the available data) and Abstracts Views on Vision4Press platform.
Data correspond to usage on the plateform after 2015. The current usage metrics is available 48-96 hours after online publication and is updated daily on week days.
Initial download of the metrics may take a while.