| Issue |
A&A
Volume 663, July 2022
|
|
|---|---|---|
| Article Number | A45 | |
| Number of page(s) | 14 | |
| Section | Catalogs and data | |
| DOI | https://doi.org/10.1051/0004-6361/202142860 | |
| Published online | 12 July 2022 | |
Discovery of new TESS pulsating hot subdwarfs
1
Astronomical Observatory, Jagiellonian University,
ul. Orla 171,
PL-30-244
Krakow, Poland
e-mail: jk@oa.uj.edu.pl
2
South African Astronomical Observatory,
PO Box 9,
Observatory, Cape Town, South Africa
e-mail: labsaao.ac.za
Received:
8
December
2021
Accepted:
21
March
2022
Aims. This work is dedicated to a search for new pulsating hot subdwarfs in TESS photometric data which could have been missed in previous searches.
Methods. By matching catalogues of hot subdwarfs with TESS targets and using luminosities from Gaìa parallaxes, a list of 1389 candidate hot subdwarfs observed by TESS was created. The periodograms of these stars were inspected, and the stars were classified according to variability type.
Results. An updated catalogue of all known pulsating hot subdwarfs is presented. A number of probable pulsating binaries have been identified, which might prove useful for verifying the asteroseismic masses. The mean masses of p- and g-mode pulsators are estimated from the stellar parameters.
Conclusions. A list of 63 previously unknown pulsating hot subdwarfs observed by TESS is presented. More than half of the stars previously identified as pure p-mode pulsators are found to have frequencies in the g-mode region as well. As a result, hybrid p- and g-mode pulsators occur over the whole instability strip.
Key words: subdwarfs / stars: oscillations
© ESO 2022
1 Introduction
Hot subdwarf stars form roughly two classes of objects. The cooler subdwarf B-type (sdB) class, whose spectra typically show no or weak helium lines, and the hotter subdwarf O-type (sdO) class, which has (on average) a higher helium abundance (Stroeer et al. 2007).
The sdBs are core He-burning stars on the extreme horizontal branch having very thin hydrogen envelopes (Heber 1986, 2016; Saffer et al. 1994). It is thought that most of the hydrogen was removed by mass loss that could have occurred as a result of mass interchange in a binary system (Han et al. 2002, 2003). This is supported by the fact that many sdB stars are close binary systems, which are either late M-type main sequence stars or white dwarfs (Maxted et al. 2001; Heber 2016). The effective temperature range of the sdBs is between 20000 and 40 000 K and the surface gravity (log g) is between 5.2 and 6.2 (Green et al. 2008; Saffer et al. 1994).
The hotter sdO class encompasses a wider range of hot objects with diverse origins. These stars are located blueward of the extreme horizontal branch stars in the HR diagram (Stroeer et al. 2007; Németh et al. 2012). Most are likely descendants of red giant stars; however, a few have luminosities and temperatures similar to the central stars of planetary nebulae and therefore might be of post-AGB origin (Heber et al. 1988; Rauch et al. 1991). Because evolutionary tracks of sdB stars pass through the sdO region (Dorman et al. 1993), a link between the two classes is also possible and some sdOs in the class might also be descendants of sdB stars. On the other hand, the population of sdO stars consists mostly of single stars (Napiwotzki 2008); therefore, a merger of two helium white dwarfs (Webbink 1984; Iben & Tutukov 1984; Saio & Jeffery 2000), and the delayed helium flash of a WD (Lanz et al. 2004) or hot-flasher (Miller Bertolami et al. 2008) were the scenarios suggested to explain the existence of some of these stars.
The effective temperatures of the hotter sdOs can reach up to 80 000 K, and due to the diversity of the sdO stars, their surface gravity (log g) range (4.0–6.5) is broader than for sdBs (Oreiro Rey et al. 2004; Johnson et al. 2014; Heber 2009, 2016). The fraction of sdO stars with temperatures around 40 000 K are likely He-burning subdwarfs, while the hotter sdOs are thought to have entered a subsequent He-shell-burning phase (Wang et al. 2021). For an in-depth review of the two classes, see Heber (2016).
Charpinet et al. (1996) investigated pulsational driving in sdB stars. They found that most of the driving is the result of the opacity κ-mechanism operating in the partial ionisation zone of Fe-group elements. This is the same mechanism that operates in the main sequence β Cep and SPB stars (Moskalik & Dziembowski 1992; Dziembowski et al. 1993). However, pulsation in models of sdB stars will only occur if the metal abundance in the driving region is enhanced by about a factor of two at uniform envelope abundance. A basic result of radiatively driven diffusion is that an element accumulates in a layer where the specific opacity for the element is highest. Therefore, Fe-group elements will tend to be enhanced in the region of the opacity bump, as required for pulsational driving.
Shortly after these model calculations, Kilkenny et al. (1997) reported the discovery of small-amplitude, rapid light variations in the sdB binary, EC 14026-2647. The main frequency peak is at about 600d−1 with an amplitude of about 0.01 mag. Since then, many other sdB stars pulsating at high frequencies have been discovered. These p-mode pulsators are now called the V361 Hya variables.
Green et al. (2003) discovered a second family of related sdB stars. These are also low-amplitude multiperiodic variables, but with frequencies in the range 10–50d−1. These are called V1093 Her variables. The pulsations are attributed to g-modes of low spherical harmonic degree driven by the same mechanism as in the hotter V361 Hya stars (Fontaine et al. 2003). Because they have lower effective temperatures, the driving zone is deeper in the V1093 Her stars and the thermal timescale is longer. As a result, only g-mode pulsations of long periods are unstable. The situation is analogous to the β Cep/SPB case.
It should be mentioned that pulsating stars have also been found among sdOs. The first in this class is SDSS J160043.6+074802.9, a subdwarf discovered by Woudt et al. (2007); it is a binary with a late-type companion (Rodríguez-López et al. 2010). The second, previously classified as a sdBV in a binary system with an F0 star (Koen et al. 1997; O'Donoghue et al. 1998), is EOCet (PB8783), which was later re-classified as an sdO pulsator (Østensen 2012). The last is EC 03089-6421, a sdOV star discovered by Kilkenny et al. (2017). All are rapid pulsators with periods in the range 0.5–2 min. There were also cooler (~50000ĸ) sdO pulsators discovered in a globular cluster (ω Cen) (Randall et al. 2011, 2016), but they likely make up a different class of subdwarf pulsators than the field sdOV stars.
Space photometry from the Kepler mission (Borucki et al. 2010) and from the TESS mission (Stassun et al. 2019) has been an important source of new candidates for V1093 Her and V361 Hya classes of variables (Østensen et al. 2010b, 2011; Kawaler et al. 2010b,a; Reed et al. 2010). The majority of the sdB stars observed by Kepler are V1093 Her variables (16 stars), with one hybrid and one V361 Hya star. Analysis of data from the extended Kepler K2 mission resulted in the discovery of 15 pulsating sdB variables, two of which belong to the V361 Hya class (Reed et al. 2018b). Analysis of data from the TESS mission is ongoing (Reed et al. 2020; Uzundag et al. 2021; Sahoo et al. 2020a; Charpinet et al. 2019). Holdsworth et al. (2017) gives a table of 110 pulsating subdwarfs known at the time. Lynas-Gray (2021) presents a good review which includes a list of 56 known pulsating sdB stars.
More recently, Van Grootel et al. (2021) has presented three lists of 1302, 269, and 1013 confirmed hot subdwarfs (including hot subdwarf pulsators) observed by the TESS mission. These numbers are taken from their online catalogues (see link in their paper). These catalogues were assembled by Working Group 8 (WG8, compact pulsators) of the TESS Asteroseismic Consortium. Their contents overlap, so that the total number of entries is larger than the actual number of hot subdwarfs.
In this paper we present the results of a search for pulsating hot subdwarfs using TESS photometry. We begin in Sect. 2 by describing the TESS data and how hot subdwarfs are identified. We emphasize the importance of Gaia parallaxes (Gaia Collaboration 2016, 2018) in this regard. In Sect. 3 we discuss lists of known hot subdwarf pulsators and why it is important to identify p- and g-mode pulsators. In Sect. 4 the search for variability among TESS stars identified as probable hot sub-dwarfs is discussed. The criteria used to distinguish between eclipsing and pulsating stars from the periodograms is described. The effect of contamination from nearby stars is discussed. The mass distribution of hot subdwarfs derived from Gaia luminosities and published surface gravities is discussed in Sect. 5. This allows the relative masses of p- and g-mode pulsating hot subdwarfs to be estimated. In Sect. 6 the location of the pulsating hot subdwarfs in the Hertzsprung–Russell (H–R) diagram is discussed and compared to the models. In the appendix a catalogue of all known pulsating hot subdwarfs discovered since the previous listing by Holdsworth et al. (2017) is presented. A table of the newly discovered pulsating hot subdwarfs is also presented. A separate list of many new pulsating hot subd-warfs, which were unrecognized as pulsators by Van Grootel et al. (2021), is included. Finally, the periodograms of all newly discovered pulsating hot subdwarfs are shown.
2 Data and Identification of Hot Subdwarfs
The TESS photometric survey consists of continuous wide-band photometry of 13 sectors per celestial hemisphere (Ricker et al. 2014). Each sector is observed continuously for about 27 days with 2 min cadence. Stars near the ecliptic equator are only observed for one sector. Stars nearer the poles may be observed in more than one sector so that, at the ecliptic poles, stars are observed continuously for over 350 days. The light curves are corrected for time-correlated instrumental signatures using pre-search data conditioning (PDC, Jenkins et al. 2016). These are the data labelled PDCSAP_FLUX in the light curve FITS files. The data used here are the full PDCSAP light curves from sectors 1–38. As this was part of a survey for stellar variability among many thousands of TESS stars, no effort was made to optimise the aperture. The light curves for TESS stars are available on the MAST website1.
Hot subdwarfs were first identified in surveys of faint blue stars at high Galactic latitudes (Humason & Zwicky 1947). Subsequent surveys added to the list. The first catalogue of spectroscopically identified hot subdwarf stars (Kilkenny et al. 1988) contained 1225 sdB and sdO stars. Østensen (2006) expanded the list to more than 2300 stars. The advent of mass surveys such as the Sloan Digital Sky Survey (SDSS) extended the search to fainter magnitudes and provided spectra of almost 2000 hot subdwarfs (Geier et al. 2015; Kepler et al. 2015, 2016). The precise proper motions and parallaxes provided by Gaia (Gaia Collaboration 2016, 2018) has led to an even greater number of possible subdwarf candidates based on colour, absolute magnitude, and reduced proper motion cuts (Geier et al. 2017a, Geier et al. 2019; Geier 2020).
These lists were cross-matched with the TESS input catalogue (Stassun et al. 2019), leading to 1398 hot subdwarf candidates for which light curves are available. Not surprisingly, the majority of these stars are also listed on the WG8 list of compact pulsators.
Perhaps the most direct way of identifying hot subdwarfs is to place the star in the H–R diagram. The photometric effective temperatures for hot stars are unreliable unless they include observations in the UV band. The sources of effective temperature, Teff, are mainly those in Geier (2020), but the literature was searched for further values using the SIMBAD database (Wenger et al. 2000) for stars of interest. The luminosity for each star was estimated from Gaia EDR3 parallax (Gaia Collaboration 2016, Gaia Collaboration 2018) in conjunction with reddening obtained from a three-dimensional map by Gontcharov (2017) using the bolometric correction calibration by Pecaut & Mamajek (2013). From the error in the Gaia parallax, the typical standard deviation in log(L/L⊙) is estimated to be about 0.10 dex, allowing for standard deviations of 0.1 mag in the apparent magnitude, 0.1 mag in visual extinction and 0.1 mag in the bolometric correction in addition to the parallax error.
Unfortunately, the effective temperature is not available for many stars. It turns out that the derived luminosity is only slightly dependent on Teff, which is mainly used for deriving the bolometric correction. On the assumption that the selected stars are subdwarfs, a good approximation to the luminosity for stars without effective temperature measurements can be obtained simply by adopting Teff ≈ 30 000 K for sdB and Teff ≈ 50 000 K for sdO stars. The approximate luminosity obtained in this way is a good indicator of whether or not the star is a subdwarf. Figure 1 shows the theoretical H–R diagram for all TESS sub-dwarf candidates for which parallaxes are available.
As can be seen, there are some stars well above the subd-warf sequence. Stars with log(L/L⊙) exceeding approximately 1 dex above the well-defined subdwarf sequence were eliminated from the sample. There are also several stars cooler than about 15 000 K. The effective temperatures for these stars are nearly all derived from photometric indices and are considered unreliable. On the assumption that they are all subdwarfs, and assigning Teff = 30 000 K to these stars, some were found to have luminosities consistent with hot subdwarfs. As a result, of the 1389 TESS subdwarf candidates examined, about 1250 lie within the hot subdwarf region. These stars were retained for further study, while the others were rejected.
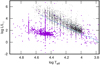 |
Fig. 1 Theoretical H–R diagram showing subdwarfs (violet filled circles) and main sequence stars brighter than 12.5 mag (small black circles) observed by TESS. Luminosities were derived from Gala parallaxes. The vertical arraignment of some points is due to adopted values of Teff = 50 000 K for sdO and Teff = 30 000 K for sdB stars for which values are not available and the use of Teff from spectral types for some main sequence stars. The solid line is the zero age main sequence for models with solar abundance (Bertelli et al. 2008). Also shown are the theoretical instability strips for β Cep and SPB stars from Miglio et al. (2007). |
3 Known Hot Subdwarf Pulsators
Since the last compilation by Holdsworth et al. (2017), several studies have identified more pulsating hot subdwarfs. A list of these additional V361 Hya and V1093 Her stars is given in Table A1. More recently, Van Grootel et al. (2021) have identified new pulsating hot subdwarfs using TESS photometry. These are also included in Table A.1. Wherever possible, effective temperatures from the literature are included in the tables. Where no effective temperatures are available, the adopted effective temperatures described above were used to estimate the luminosity.
There are 26 know pure p-mode pulsators observed by TESS in the compilation by Holdsworth et al. (2017). In ten of these stars significant frequency peaks in the g-mode region were detected (Fig. 2). These stars, listed in Table 1, clearly need to be re-classified as p+g-mode hybrids. In this table, a list of previously unrecognised sdBV binary candidates is also given.
The only meaningful subdivision of sdBV stars is the classification into p-mode and g-mode variables. The restoring force in p-mode variables is the pressure, while for g-mode variables it is buoyancy. The subdivision is based on the expected frequency ranges for p- and g-modes derived from models. The theoretical pulsation period boundary between p- and g-modes is around 250 s or a frequency of 340 d−1 (Bloemen et al. 2014). This is the criterion used by Holdsworth et al. (2017). In this paper we use this definition of p- and g-mode variables. The shortest period that can be observed by TESS is 240 s (2 min cadence), which means that only g-mode pulsators (V1096 Her stars) can be detected.
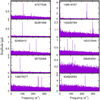 |
Fig. 2 Known pure p-mode pulsating hot subdwarfs observed by TESS showing frequency peaks in the g-mode range. |
Stars in Holdsworth et al. (2017) classified as pure p-mode pulsators but which have clear g-mode frequency peaks in the TESS photometry.
4 New Pulsational variables
The TESS periodograms of hot subdwarfs have relatively low signal-to-noise ratios owing to the faintness of the stars. It should also be noted that the TESS photometric bandpass is very wide and mostly sensitive in the near infrared (Ricker et al. 2014). This is not well suited to detecting pulsations in very hot stars because the amplitudes are much lower in the near infrared than in the blue region of the spectrum.
The periodograms of each star were visually inspected and the type of variability noted. Any star in which only one peak below 30 d−1 or a peak with one or more harmonics was detected is regarded as a binary. The dips in the light curves of detached eclipsing binaries manifest as harmonics in the periodogram. The possibility exists that the variability is due to pulsation modes with harmonics or even rotation, rather than binarity. The differences cannot be distinguished from the light curve alone. On the other hand, if multiple peaks are seen that are not in a harmonic relation, then one may feel confident that pulsation is involved.
In a few stars, a frequency peak with one or more harmonics is present in addition to other unrelated frequency peaks. These stars are classified as possible pulsating binary hot subdwarfs.
No significant light variation could be seen in 640 stars. There are 24 stars that are clearly main sequence stars with erroneous parallaxes, and 12 stars with irregular light variations. As many as 410 possible binaries were noted, but half of them have uncertain low amplitudes. We classified 210 stars as definite binary candidates, 8 of which were noted to have flares (presumably originating in a cool companion).
Inspection of the periodograms of the TESS candidates within the sdB region of the H–R diagram showed many of the variables have only a single significant peak in the periodogram. These stars were removed from the sdBV candidate list on the assumption that the periodicity might be due to binary motion rather than pulsation, as described above. After removing a few other stars where the evidence for pulsation was considered too weak, 63 previously unknown pulsating hot subdwarf candidates remain. These include 38 stars in Van Grootel et al. (2021), which seemed to have been overlooked as sdBV stars. They are listed in Table A.2 and their periodograms shown in Fig. A1. The remaining 25 stars are newly discovered sdBV candidates (Table A.3). Periodograms of these stars are shown in Fig. A2.
TESS images of every target star listed in Tables A.2 and A.3 were visually examined for the presence of background or neighbouring stars that could affect the signal in the TESS aperture. The target CCD pixel images were overlaid with scaled SDSS or Digital Sky Survey (DSS) images. A visual assessment was made and the probable affect on the light curve designated by the code shown in Tables A.2 and A.3. The TESS pixel is 21 × 21 arcsec and in the worst case (code 3), intrusion of light from neighbouring stars of comparable brightness will affect the measured light amplitude.
Whenever doubts have arisen about light intrusion into the TESS aperture, the neighbouring stars were examined for light variability when possible. None of these neighbouring stars appeared to be a variable, but there were some cases where background stars occupied the same pixel as, or an adjoining pixel to the target star. In these cases the field was examined using SDSS or DSS colour images to estimate the colours of the neighbouring stars. In all cases the target appeared to be a blue star, while the neighbour(s) were distinctly cooler. This makes it less likely that the intruding star(s) are responsible for any of the pulsation patterns seen in the hot subdwarfs.
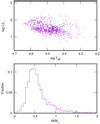 |
Fig. 3 Top panel: theoretical H–R diagram of hot subdwarfs extracted from the catalogue of Geier (2020) and located within the instability region. Bottom panel: mass distribution of these stars estimated directly from the stellar parameters. |
5 Masses
The luminosity derived from Gaia parallax provides an independent method of estimating the stellar mass. From the equations L/L⊙ = (R/R⊙)2(Teff/Teff⊙)4 and g/g⊙ = M/M⊙/(R/R⊙)2 we have

Since the log g, log L/L⊙, and log Teff values are known for many hot subdwarfs, it is possible to obtain individual stellar masses. These masses might not be reliable because of the large errors in measuring these three quantities. The typical standard deviations are σ(log Teff) ≈ 0.010, σ(log L/L⊙) ≈ 0.011, σ(log g) ≈ 0.07 which gives σ(log M/M⊙) ≈ 0.14. The expected error in mass is a substantial fraction of the mass itself. Clearly, obtaining individual stellar masses in this way is not useful. However, the average mass of a fairly large population will be quite well determined and might prove interesting.
The catalogue of Geier (2020) was used to extract 876 candidate subdwarfs with known stellar parameters within the region of the p-mode and g-mode pulsators (top panel of Fig. 3). The bottom panel of Fig. 3 shows the mass distribution of these stars estimated from the above equation. There is a long tail of high masses which could be a result of inclusion of main sequence stars in the Geier (2020) catalogue. There are certainly a number of Be and other peculiar stars in the catalogue. The peak of the distribution is at M = 0.45 M⊙. If only stars in the range 0.25 < M/M⊙ < 1.0 are retained, the mean is M = 0.545 ± 0.006 M/M⊙ from 754 stars.
Among the 754 stars there are 45 g-mode pulsators with mean mass  . The 11 hybrids have
  , while the 27 p-mode pulsators have a mean mass
  . These values assume that the measured values of effective temperature, luminosity, and surface gravity are free of systematic errors. Even if the actual values suffer from systematic errors in the measured quantities, the relative values should remain about the same. It is therefore safe to assume that p-mode pulsators have higher masses than g-mode pulsators.
Perhaps the most precise masses are those obtained from asteroseismology (see Fontaine et al. 2012). From 20 astero-seismic masses of p-mode stars the mean mass is  . There are only three g-mode pulsators with astero-seismic masses, giving
  . Again, the p-mode pulsators have higher masses, but one can argue that a sample of three g-mode stars is too small for a meaningful determination. On the other hand, the Van Grootel et al. (2013) dynamical and asteroseismic mass determination of PG1336-018, a sdBV in a binary system, seems to confirm the precision of asteroseis-mological models. The systematic difference between the aster-oseismic masses and the masses derived here could be explained if the effective temperatures are increased by about 5%.
In our list of newly discovered pulsating hot subdwarfs, there are ten probable binaries, four of which have between 7 and 13 frequency peaks (Table 1). It might be possible to obtain both pulsation masses and dynamical masses from these stars. This would allow an important verification of the pulsation masses.
6 Location of the g-mode Hot Limit
The models of Fontaine et al. (2003), which can account for the high pulsation frequencies in V386 Hya stars, require the observed modes to be of relatively high degree (spherical harmonic l = 3 or 4) because the more visible low-degree modes are only excited in stars cooler than the coolest known sdB stars. Furthermore, the hot end of the g-mode instability strip turns out to be about Teff ≈ 24 500 K, which is significantly cooler than observations.
The discrepancy between the observed and theoretical blue edges was resolved by Jeffery & Saio (2006) using updated opacities together with enhanced Ni and Fe in the driving zone. They find the blue edge at around Teff ≈ 28 000 K for l = 3 if the Ni abundance is enhanced by a factor of 20. Hu et al. (2009) found that helium settling causes a shift in the theoretical blue edge of the g-mode instability domain to higher effective temperatures. A blue edge at about Teff ≈ 29 500 K is possible for l = 3 modes with Ni enhancement and helium settling.
Bloemen et al. (2014) point out that the abundance enhancements of Fe and Ni due to diffusion were previously underestimated. Their models predict g-mode pulsations at effective temperatures as high as Teff = 33 500 K which is hotter than the observed hot limit for g-modes and well inside the p-mode region.
The top panel of Fig. 4 shows the location of the pulsating hot subdwarfs observed by TESS in the H–R diagram. The middle panel shows all known pulsating hot subdwarfs as well as the four blue edges discussed above. As already mentioned, many of the known p-mode TESS stars in the literature show distinct frequency peaks in the g-mode region as well (Table 1 and Fig. 2). These new hybrid pulsators, as well as previously known hybrid pulsators, are shown in the middle panel of Fig. 4. They no longer form a tight sequence between the p- and g-mode pulsators, but are to be found right across the instability strip. The bottom panel of Fig. 4 shows the same stars in the more frequently used log g - Teff diagram.
There is a simple reason for the lack of detection of g-mode frequency peaks in p-mode stars observed from the ground. Because of daily gaps in ground-based photometry, night-tonight changes in atmospheric conditions and low amplitudes, low frequencies in the periodogram are contaminated by the daily alias peaks and instrumental drift. High frequency p-mode pulsations remain relatively unaffected. On the other hand, the almost continuous time sequences over many weeks obtained by TESS eliminates the aliasing problem and allows detection of low-frequency pulsations even at very low amplitudes.
There are three very hot g-mode pulsators among the p-mode stars in Fig. 4: TIC 442482669 (LS IV-14 116, Ahmad & Jeffery 2005), TIC 20420376 (UVO 0825+15, Jeffery et al. 2017), and TIC 371813244 (Feige 46, Latour et al. 2019). These pulsators may represent a different type of object (Dorsch et al. 2020).
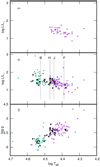 |
Fig. 4 Top panel: theoretical H–R diagram for TESS pulsating subdwarfs. Middle panel: all pulsating subdwarfs, including the TESS pulsators. The p-mode pulsators are shown as green filled circles and the g-mode pulsators as violet open circles. The hybrid pulsators are shown as black asterisks. The four dotted lines show the predicted hot limit of Fontaine et al. (2003) (F), Jeffery & Saio (2006) (J), Hu et al. (2009) (H), and Bloemen et al. (2014) (B). Bottom panel: gravity–effective temperature diagram for all pulsating subdwarfs. The cross at the top left of each panel shows the approximate 1σ error bars. |
7 Conclusions
A list of all known pulsating sdB stars was compiled by Holdsworth et al. (2017). This list was extended by a literature search, supplemented with the lists from Van Grootel et al. (2021) and presented in Table A.1.
By cross-matching the positions of stars observed by TESS with the lists of subdwarf candidates by Geier (2020), a total of 1398 stars with TESS light curves was obtained. Using the stellar luminosities derived from Gala parallaxes, stars not likely to be hot subdwarfs were identified and removed from the sample.
The periodograms of these stars were inspected and stars classified according to variability type. Pulsating hot subdwarfs are identified by the presence of multiple peaks in the periodogram. Many other stars showing only one peak below 30 d−1, or one peak and its harmonics, are assumed to be binaries.
In this way, 63 pulsating hot subdwarfs were detected, 38 of which are listed in Van Grootel et al. (2021), but not classified as pulsating variables. The remaining 25 stars are previously unknown pulsating hot subdwarf candidates. This is a significant increase in the number of pulsating subdwarfs presented by the WG8 work. The new variables are presented in Tables A.2 and A.3. Their periodograms are shown in Figs. A.1 and A.2.
Stellar masses of a large sample of hot subdwarfs were determined from Teff, log g, and log L/L⊙. Applying this method to a sample of p-mode and g-mode pulsators, it is found that masses of p-mode pulsators are 15% higher than those of g-mode pulsators. The same result is found using asteroseismic masses.
While current pulsation models are able to explain the pulsations in these stars, they are unable to fix the location of the g-mode blue edge. The models by Bloemen et al. (2014) allow g-mode pulsations to continue well past the observed blue edge, depending on the amount of iron-group metal abundances in the driving zone.
The TESS observations have detected many stars with g-modes previously thought to be pure p-mode pulsators. As a result, these newly classified hybrid stars no longer form a tight group between the p- and g-mode stars. It seems likely that the previous observations could not detect the long periods of the g-mode stars, giving a misleading indication of the location of the hybrid stars. The situation is analogous to the lack of long-period detections from the ground in δ Scuti stars. Space observations later showed that long periods (low frequencies) are present in almost all δ Scuti variables (Balona 2014).
Acknowledgements
L.A.B. thanks the National Research Foundation of South Africa for financial support. This paper includes data collected by the TESS mission. Funding for the TESS mission is provided by the NASA Explorer Program. Funding for the TESS Asteroseismic Science Operations Centre is provided by the Danish National Research Foundation (Grant agreement no.: DNRF106), ESA PRODEX (PEA 4000119301) and Stellar Astrophysics Centre (SAC) at Aarhus University. We thank the TESS and TASC/TASOC teams for their support of the present work. This work has made use of data from the European Space Agency (ESA) mission Gala (https://www.cosmos.esa.int/gaia), processed by the Gala Data Processing and Analysis Consortium (DPAC, https://www.cosmos.esa.int/web/gaia/dpac/consortium). Funding for the DPAC has been provided by national institutions, in particular the institutions participating in the Gala Multilateral Agreement. This research has made use of the SIMBAD database, operated at CDS, Strasbourg, France. This research has made use of the VizieR catalogue access tool, CDS, Strasbourg, France (DOI: 10.26093/cds/vizier). The original description of the VizieR service was published in A&AS 143, 23. The data presented in this paper were obtained from the Mikulski Archive for Space Telescopes (MAST). STScI is operated by the Association of Universities for Research in Astronomy, Inc., under NASA contract NAS5-2655.
Appendix Notes, tables and periodograms
This appendix gives an updated list of known pulsating subdwarfs in Table A1, which continues the list presented in Holdsworth et al. (2017). Table A2 presents the TESS stars listed in Van Grootel et al. (2021) that are unrecognised new pulsating variables. Periodograms of these stars are shown in Fig. A1. Table A3 presents additional new TESS pulsating variables. The periodograms of these stars are shown in Fig. A2.
Notes to Table A2
TIC 21343832. A flare at BJD 2458844.77 seems to be present.
TIC 63208546. A peak at 3.375 d−1 with a very strong harmonic suggests a double-wave light curve with period P = 0.296 d from orbital motion.
TIC 151641733. Pelisoli et al. (2020) attributed the peak at 1.79 d−1 as being due to rotation of the secondary. However, there are several peaks in the range 22.7-29.7 d−1 with S/N between 6 and 7 which are likely g-mode pulsations.
TIC 201251043, 457225725. These stars were analysed by Sahoo et al. (2020b) using TESS full-frame imqages sampled with a cadence of 30 min. Although they are listed as pulsating sdB stars, the long cadence prohibits the detection of frequencies higher than about 24 d−1. They all have frequency peaks exceeding this limit.
TIC 279373920. A high-amplitude peak at 2.126 d−1 and its harmonic indicates binary motion with P = 0.468 d.
TIC 311432346. The light curve shows clear sinusoidal variations with a period P = 1.495 d, which is perhaps orbital.
TIC 311898870. The main frequency peak and a marginal harmonic suggest orbital motion with P = 0.363 d.
TIC 380641758. The pulsation frequencies in this star do not correspond to those generally seen in sdB or sdO stars. Typical sdO pulsations are in the p-mode region, which is higher than the TESS Nyquist frequency. Perhaps they originate in the A-type companion.
TIC 421895532. A peak at 1.314 d−1 and its harmonic indicates binary motion with P = 0.761 d. The harmonic to the main peak at 6.896 d−1 is also present. Perhaps 0.761 d represents rotation and 0.145 d the orbital motion.
TIC 466277784. The strongest peak at 1.667 d−1 and its harmonic suggests binary motion with period P = 0.599 d.
Notes to Table A3
TIC 23838673. A forest of frequencies below 10 d−1 indicate a main sequence βCep. There is a cut-off frequency limit for sdBV pulsation mode excitation (about 5 d−1) below which we do not see any pulsation due to energy dispersion in the driving zone. However, in this star there are some higher frequency modes of low amplitudes visible in the periodogram, and we left it for further investigations.
TIC 56541907. The presence of a strong peak at 7.770 d−1 and its harmonic suggest a binary with period P = 0.129 d.
TIC 124802885 (HD 154137) and TIC 301776333 (HD 289333). While both are classified as normal main sequence stars, their luminosities are well within the hot subdwarf range. They are not listed as subdwarf candidates in the literature. It is possible that the Gaia parallaxes are in error.
TIC 176089274. The peak at 5.608 d−1 has a weak harmonic suggesting orbital motion with P = 0.178 d.
TIC 219641382. The light curve shows a clear sinusoidal variation with P = 2.7 d.
TIC 224284872. This high-lattitude faint star is listed as a candidate hot subdwarf in Geier et al. (2019) and also in Gontcharov et al. (2011). The luminosity is certainly compatible with a subdwarf (no reliable effective temperature has been measured). However, it was given an A0 classification by Slettebak & Brundage (1971) and listed as a high-frequency A-type main sequence pulsator by Holdsworth et al. (2014). On the basis of the low luminosity it is a likely V1093 Her star with a rich frequency spectrum in the range 50-130 d−1. There are several interesting relationships between frequencies that suggest tidal interaction in a binary system. The presence of a peak at 0.734 d−1 and its high-amplitude harmonic can be seen as a double-wave variation in the light curve. This could be a result of binary motion with period P = 1.362 d. The star might turn out to be a main sequence star with incorrect parallax, but it certainly deserves attention.
TIC 262753627. The star was also analysed by Sahoo et al. (2020b) using TESS full-frame images sampled with a cadence of 30 min. It is not listed in Van Grootel et al. (2021).
TIC 282810113. While the single peak at 13.001 d−1 is present, there are four other peaks with 4 < S/N < 5. However, confirmation of these frequencies is clearly required.
TIC 314296949 High amplitude frequencies in the range 5-10 d−1 are unusual in an sdBV star.
TIC 471013511 The only significant peak at 10.25 d−1 may be due to low-amplitude binary variations, either rotation or pulsation. While it is listed as a cataclysmic binary or related object by Ritter & Kolb (2004), it lies well within the sdB instability strip among the g-mode pulsators.
Pulsating hot subdwarfs discovered since Holdsworth et al. (2017). The pulsation type is either P (p-mode), G (g-mode), or H (both p- and g-modes present). Suspected binary systems are labelled B. The effective temperature (kK) and luminosity (from Gaia EDR3 parallaxes) are shown. If no value of Teff is available, the calculation of the luminosity assumes Teff = 3.0 kK. The surface gravity, log(g), and the log helium abundance Y = n(He)/n(H) are from Geier (2020). The reference codes for pulsation (Pref) and for the effective temperatures (Tref) are listed in the last two columns. The second half of the table lists the TESS sdBV stars discovered by Van Grootel et al. (2021).
List of 38 newly discovered pulsating sdB stars not marked as pulsators in the Van Grootel et al. (2021) catalogue. The columns are the same as in Table A1. An asterisk refers to a note for the star. The column marked F gives the following flags: 1 - an isolated target or target star with neighbours that have no influence on the target fluxes; 2 - a crowded field where the target flux is not substantially polluted by light from neighbouring stars; 3 - a star with bright neighbours that might substantially affect the amplitudes of the subdwarf light variation. The last column is the spectral type from Van Grootel et al. (2021).
List of 25 newly discovered TESS pulsating sdB candidates that are not listed in Van Grootel et al. (2021). The columns are the same as in Table A2. The last column is the spectral type from the literature.
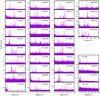 |
Fig. A.1 Periodograms of unrecognised sdBV stars in Van Grootel et al. (2021). The amplitude is in parts per thousand. |
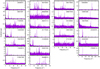 |
Fig. A.2 Periodograms of newly discovered TESS sdBV stars. The amplitude is in parts per thousand. |
References
- Ahmad, A., & Jeffery, C.S. 2005, A&A, 437, L51 [NASA ADS] [CrossRef] [EDP Sciences] [Google Scholar]
- Anders, F., Khalatyan, A., Chiappini, C., et al. 2019, A&A, 628, A94 [NASA ADS] [CrossRef] [EDP Sciences] [Google Scholar]
- Arentsen, A., Prugniel, P., Gonneau, A., et al. 2019, A&A, 627, A138 [NASA ADS] [CrossRef] [EDP Sciences] [Google Scholar]
- Arkhipova, V.P., Ikonnikova, N.P., Komissarova, G.V., & Esipov, V.F. 2002, Astron. Lett., 28, 778 [NASA ADS] [CrossRef] [Google Scholar]
- Bachulski, S., Baran, A.S., Jeffery, C.S., et al. 2016, Acta Astron., 66, 455 [NASA ADS] [Google Scholar]
- Bai, Y., Liu, J., Wicker, J., et al. 2018, ApJS, 235, 16 [NASA ADS] [CrossRef] [Google Scholar]
- Balona, L.A. 2014, MNRAS, 437, 1476 [NASA ADS] [CrossRef] [Google Scholar]
- Baran, A.S., Reed, M.D., Østensen, R.H., Telting, J.H., & Jeffery, C.S. 2017, A&A, 597, A95 [NASA ADS] [CrossRef] [EDP Sciences] [Google Scholar]
- Baran, A.S., Østensen, R.H., Telting, J.H., et al. 2018, MNRAS, 481, 2721 [NASA ADS] [CrossRef] [Google Scholar]
- Bertelli, G., Girardi, L., Marigo, P., & Nasi, E. 2008, A&A, 484, 815 [NASA ADS] [CrossRef] [EDP Sciences] [Google Scholar]
- Bloemen, S., Hu, H., Aerts, C., et al. 2014, A&A, 569, A123 [NASA ADS] [CrossRef] [EDP Sciences] [Google Scholar]
- Borucki, W.J., Koch, D., Basri, G., et al. 2010, Science, 327, 977 [Google Scholar]
- Charpinet, S., Fontaine, G., Brassard, P., & Dorman, B. 1996, ApJ, 471, L103 [Google Scholar]
- Charpinet, S., Brassard, P., Fontaine, G., et al. 2019, A&A, 632, A90 [NASA ADS] [CrossRef] [EDP Sciences] [Google Scholar]
- Córsico, A.H., Uzundag, M., Kepler, S.O., et al. 2021, A&A, 645, A117 [NASA ADS] [CrossRef] [EDP Sciences] [Google Scholar]
- Dorman, B., Rood, R.T., & O’Connell, R.W. 1993, ApJ, 419, 596 [NASA ADS] [CrossRef] [Google Scholar]
- Dorsch, M., Latour, M., Heber, U., et al. 2020, A&A, 643, A22 [EDP Sciences] [Google Scholar]
- Dziembowski, W.A., Moskalik, P., & Pamyatnykh, A.A. 1993, MNRAS, 265, 588 [NASA ADS] [CrossRef] [Google Scholar]
- Edelmann, H., Heber, U., Hagen, H.J., et al. 2003, A&A, 400, 939 [NASA ADS] [CrossRef] [EDP Sciences] [Google Scholar]
- Fontaine, G., Brassard, P., Charpinet, S., et al. 2003, ApJ, 597, 518 [Google Scholar]
- Fontaine, G., Brassard, P., Charpinet, S., et al. 2012, A&A, 539, A12 [NASA ADS] [CrossRef] [EDP Sciences] [Google Scholar]
- Gaia Collaboration (Prusti, T., et al.) 2016, A&A, 595, A1 [NASA ADS] [CrossRef] [EDP Sciences] [Google Scholar]
- Gaia Collaboration (Brown, A.G.A., et al.) 2018, A&A, 616, A1 [NASA ADS] [CrossRef] [EDP Sciences] [Google Scholar]
- Geier, S. 2013, A&A, 549, A110 [NASA ADS] [CrossRef] [EDP Sciences] [Google Scholar]
- Geier, S. 2020, A&A, 635, A193 [NASA ADS] [CrossRef] [EDP Sciences] [Google Scholar]
- Geier, S., Heber, U., Edelmann, H., et al. 2013, A&A, 557, A122 [NASA ADS] [CrossRef] [EDP Sciences] [Google Scholar]
- Geier, S., Kupfer, T., Heber, U., et al. 2015, A&A, 577, A26 [NASA ADS] [CrossRef] [EDP Sciences] [Google Scholar]
- Geier, S., Østensen, R.H., Nemeth, P., et al. 2017a, A&A, 600, A50 [NASA ADS] [CrossRef] [EDP Sciences] [Google Scholar]
- Geier, S., Østensen, R.H., Nemeth, P., et al. 2017b, Open Astron., 26, 164 [NASA ADS] [CrossRef] [Google Scholar]
- Geier, S., Raddi, R., Gentile Fusillo, N.P., & Marsh, T.R. 2019, A&A, 621, A38 [NASA ADS] [CrossRef] [EDP Sciences] [Google Scholar]
- Girven, J., Gänsicke, B.T., Steeghs, D., & Koester, D. 2011, MNRAS, 417, 1210 [NASA ADS] [CrossRef] [Google Scholar]
- Gontcharov, G.A. 2017, Astron. Lett., 43, 472 [NASA ADS] [CrossRef] [Google Scholar]
- Gontcharov, G.A., Bajkova, A.T., Fedorov, P.N., & Akhmetov, V.S. 2011, MNRAS, 413, 1581 [NASA ADS] [CrossRef] [Google Scholar]
- Green, E.M., Fontaine, G., Reed, M.D., et al. 2003, ApJ, 583, L31 [NASA ADS] [CrossRef] [Google Scholar]
- Green, E.M., Fontaine, G., Hyde, E.A., For, B.Q., & Chayer, P. 2008, ASP Conf. Ser., 392, 75 [NASA ADS] [Google Scholar]
- Han, Z., Podsiadlowski, P., Maxted, P.F.L., Marsh, T.R., & Ivanova, N. 2002, MNRAS, 336, 449 [NASA ADS] [CrossRef] [Google Scholar]
- Han, Z., Podsiadlowski, P., Maxted, P.F.L., & Marsh, T.R. 2003, MNRAS, 341, 669 [NASA ADS] [CrossRef] [Google Scholar]
- Heber, U. 1986, A&A, 155, 33 [NASA ADS] [Google Scholar]
- Heber, U. 2009, ARA&A, 47, 211 [Google Scholar]
- Heber, U. 2016, PASP, 128, 082001 [Google Scholar]
- Heber, U., Hunger, K., Jonas, G., & Kudritzki, R.P. 1984, A&A, 130, 119 [NASA ADS] [Google Scholar]
- Heber, U., Werner, K., & Drilling, J.S. 1988, A&A, 194, 223 [NASA ADS] [Google Scholar]
- Hilditch, R.W., Harries, T.J., & Hill, G. 1996, MNRAS, 279, 1380 [NASA ADS] [CrossRef] [Google Scholar]
- Holberg, J.B., Barstow, M.A., & Sion, E.M. 1998, ApJS, 119, 207 [NASA ADS] [CrossRef] [Google Scholar]
- Holdsworth, D.L., Smalley, B., Gillon, M., et al. 2014, MNRAS, 439, 2078 [NASA ADS] [CrossRef] [Google Scholar]
- Holdsworth, D.L., Østensen, R.H., Smalley, B., & Telting, J.H. 2017, MNRAS, 466, 5020 [NASA ADS] [Google Scholar]
- Hu, H., Nelemans, G., Aerts, C., & Dupret, M. 2009, A&A, 508, 869 [NASA ADS] [CrossRef] [EDP Sciences] [Google Scholar]
- Humason, M.L., & Zwicky, F. 1947, ApJ, 105, 85 [NASA ADS] [CrossRef] [Google Scholar]
- Iben, I.J., & Tutukov, A.V. 1984, ApJ, 284, 719 [NASA ADS] [CrossRef] [Google Scholar]
- Jeffery, C.S., & Saio, H. 2006, MNRAS, 372, L48 [NASA ADS] [CrossRef] [Google Scholar]
- Jeffery, C.S., Baran, A.S., Behara, N.T., et al. 2017, MNRAS, 465, 3101 [NASA ADS] [CrossRef] [Google Scholar]
- Jenkins, J.M., Twicken, J.D., McCauliff, S., et al. 2016, Proc. SPIE, 9913, 99133E [NASA ADS] [CrossRef] [Google Scholar]
- Johnson, C., Green, E., Wallace, S., et al. 2014, ASP Conf. Ser., 481, 153 [NASA ADS] [Google Scholar]
- Kawaler, S.D., Reed, M.D., Østensen, R.H., et al. 2010a, MNRAS, 409, 1509 [NASA ADS] [CrossRef] [Google Scholar]
- Kawaler, S.D., Reed, M.D., Quint, A.C., et al. 2010b, MNRAS, 409, 1487 [NASA ADS] [CrossRef] [Google Scholar]
- Kepler, S.O., Pelisoli, I., Koester, D., et al. 2015, MNRAS, 446, 4078 [NASA ADS] [CrossRef] [Google Scholar]
- Kepler, S.O., Pelisoli, I., Koester, D., et al. 2016, MNRAS, 455, 3413 [NASA ADS] [CrossRef] [Google Scholar]
- Kepler, S.O., Pelisoli, I., Koester, D., et al. 2019, MNRAS, 486, 2169 [NASA ADS] [CrossRef] [Google Scholar]
- Kilkenny, D., Heber, U., & Drilling, J.S. 1988, South African Astron. Observ.Circ., 12, 1 [NASA ADS] [Google Scholar]
- Kilkenny, D., Luvhimbi, E., O’Donoghue, D., et al. 1995, MNRAS, 276, 906 [Google Scholar]
- Kilkenny, D., Koen, C., O’Donoghue, D., & Stobie, R.S. 1997, MNRAS, 285, 640 [NASA ADS] [CrossRef] [Google Scholar]
- Kilkenny, D., Worters, H.L., & Østensen, R.H. 2017, MNRAS, 467, 3963 [NASA ADS] [Google Scholar]
- Kilkenny, D., Worters, H.L., & Lynas-Gray, A.E. 2019, MNRAS, 485, 4330 [NASA ADS] [CrossRef] [Google Scholar]
- Koen, C., Kilkenny, D., O’Donoghue, D., van Wyk, F., & Stobie, R.S. 1997, MNRAS, 285, 645 [NASA ADS] [CrossRef] [Google Scholar]
- Kupfer, T., Geier, S., Heber, U., et al. 2015, A&A, 576, A44 [NASA ADS] [CrossRef] [EDP Sciences] [Google Scholar]
- Lanz, T., Brown, T.M., Sweigart, A.V., Hubeny, I., & Landsman, W.B. 2004, ApJ, 602, 342 [CrossRef] [Google Scholar]
- Latour, M., Green, E.M., & Fontaine, G. 2019, A&A, 623, L12 [NASA ADS] [CrossRef] [EDP Sciences] [Google Scholar]
- Lei, Z., Zhao, J., Németh, P., & Zhao, G. 2018, ApJ, 868, 70 [Google Scholar]
- Lei, Z., Zhao, J., Németh, P., & Zhao, G. 2019, ApJ, 881, 135 [NASA ADS] [CrossRef] [Google Scholar]
- Luo, Y.-P., Németh, P., Liu, C., Deng, L.-C., & Han, Z.-W. 2016, ApJ, 818, 202 [NASA ADS] [CrossRef] [Google Scholar]
- Luo, Y., Németh, P., Deng, L., & Han, Z. 2019, ApJ, 881, 7 [NASA ADS] [CrossRef] [Google Scholar]
- Lynas-Gray, A.E. 2021, Front. Astron. Space Sci.s, 8, 19 [NASA ADS] [Google Scholar]
- Maxted, P.F.L., Heber, U., Marsh, T.R., & North, R.C. 2001, MNRAS, 326, 1391 [CrossRef] [Google Scholar]
- Miglio, A., Montalbán, J., & Dupret, M.-A. 2007, MNRAS, 375, L21 [CrossRef] [Google Scholar]
- Miller Bertolami, M.M., Althaus, L.G., Unglaub, K., & Weiss, A. 2008, A&A, 491, 253 [NASA ADS] [CrossRef] [EDP Sciences] [Google Scholar]
- Moehler, S., Heber, U., & de Boer, K.S. 1990, A&A, 239, 265 [NASA ADS] [Google Scholar]
- Moni Bidin, C., Casetti-Dinescu, D.I., Girard, T.M., et al. 2017, MNRAS, 466, 3077 [NASA ADS] [CrossRef] [Google Scholar]
- Moskalik, P., & Dziembowski, W.A. 1992, A&A, 256, L5 [Google Scholar]
- Napiwotzki, R. 2008, ASP Conf. Ser., 391, 257 [NASA ADS] [Google Scholar]
- Németh, P., Kawka, A., & Vennes, S. 2012, MNRAS, 427, 2180 [Google Scholar]
- O’Donoghue, D., Koen, C., Solheim, J.E., et al. 1998, MNRAS, 296, 296 [CrossRef] [Google Scholar]
- Oreiro Rey, R., Rodríguez López, C., Ulla, A., et al. 2004, in Lecture Notes and Essays in Astrophysics, eds. A. Ulla, & M. Manteiga (USA: CreateSpace Independent Publishing Platform), 1, 133 [NASA ADS] [Google Scholar]
- Østensen, R.H. 2006, Balt. Astron., 15, 85 [Google Scholar]
- Østensen, R.H. 2012, ASP Conf. Ser., 452, 233 [Google Scholar]
- Østensen, R.H., Oreiro, R., Solheim, J.-E., et al. 2010a, A&A, 513, A6 [NASA ADS] [CrossRef] [EDP Sciences] [Google Scholar]
- Østensen, R.H., Silvotti, R., Charpinet, S., et al. 2010b, MNRAS, 409, 1470 [CrossRef] [Google Scholar]
- Østensen, R.H., Silvotti, R., Charpinet, S., et al. 2011, MNRAS, 414, 2860 [CrossRef] [Google Scholar]
- Østensen, R.H., Jeffery, C.S., Saio, H., et al. 2020, MNRAS, 499, 3738 [CrossRef] [Google Scholar]
- Pecaut, M.J., & Mamajek, E.E. 2013, ApJS, 208, 9 [NASA ADS] [CrossRef] [Google Scholar]
- Pelisoli, I., Vos, J., Geier, S., Schaffenroth, V., & Baran, A.S. 2020, A&A, 642, A180 [NASA ADS] [CrossRef] [EDP Sciences] [Google Scholar]
- Pérez-Fernández, E., Ulla, A., Solano, E., Oreiro, R., & Rodrigo, C. 2016, MNRAS, 457, 3396 [CrossRef] [Google Scholar]
- Prugniel, P., Vauglin, I., & Koleva, M. 2011, A&A, 531, A165 [NASA ADS] [CrossRef] [EDP Sciences] [Google Scholar]
- Ramspeck, M., Heber, U., & Edelmann, H. 2001, A&A, 379, 235 [NASA ADS] [CrossRef] [EDP Sciences] [Google Scholar]
- Randall, S.K., Calamida, A., Fontaine, G., Bono, G., & Brassard, P. 2011, ApJ, 737, L27 [NASA ADS] [CrossRef] [Google Scholar]
- Randall, S.K., Calamida, A., Fontaine, G., et al. 2016, A&A, 589, A1 [NASA ADS] [CrossRef] [EDP Sciences] [Google Scholar]
- Rauch, T., Heber, U., Hunger, K., Werner, K., & Neckel, T. 1991, A&A, 241, 457 [NASA ADS] [Google Scholar]
- Reed, M.D., O’Toole, S.J., Terndrup, D.M., et al. 2007, ApJ, 664, 518 [NASA ADS] [CrossRef] [Google Scholar]
- Reed, M.D., Kawaler, S.D., Østensen, R.H., et al. 2010, MNRAS, 409, 1496 [NASA ADS] [CrossRef] [Google Scholar]
- Reed, M.D., Armbrecht, E.L., Telting, J.H., et al. 2018a, MNRAS, 474, 5186 [NASA ADS] [CrossRef] [Google Scholar]
- Reed, M.D., Baran, A.S., Telting, J.H., et al. 2018b, Open Astron., 27, 157 [NASA ADS] [CrossRef] [Google Scholar]
- Reed, M.D., Telting, J.H., Ketzer, L., et al. 2019, MNRAS, 483, 2282 [NASA ADS] [Google Scholar]
- Reed, M.D., Shoaf, K.A., Németh, P., et al. 2020, MNRAS, 493, 5162 [NASA ADS] [CrossRef] [Google Scholar]
- Ricker, G.R., Winn, J.N., Vanderspek, R., et al. 2014, SPIE Conf. Ser., 9143, 914320 [NASA ADS] [Google Scholar]
- Ritter, H., & Kolb, U. 2004, VizieR Online Data Catalog: V/113C [Google Scholar]
- Rodríguez-López, C., Lynas-Gray, A.E., Kilkenny, D., et al. 2010, MNRAS, 401, 23 [CrossRef] [Google Scholar]
- Saffer, R.A., Bergeron, P., Koester, D., & Liebert, J. 1994, ApJ, 432, 351 [NASA ADS] [CrossRef] [Google Scholar]
- Sahoo, S.K., Baran, A.S., Heber, U., et al. 2020a, MNRAS, 495, 2844 [NASA ADS] [CrossRef] [Google Scholar]
- Sahoo, S.K., Baran, A.S., Sanjayan, S., & Ostrowski, J. 2020b, MNRAS, 499, 5508 [NASA ADS] [CrossRef] [Google Scholar]
- Saio, H., & Jeffery, C.S. 2000, MNRAS, 313, 671 [NASA ADS] [CrossRef] [Google Scholar]
- Sánchez-Blázquez, P., Peletier, R.F., Jiménez-Vicente, J., et al. 2006, MNRAS, 371, 703 [CrossRef] [Google Scholar]
- Schaffenroth, V., Geier, S., Heber, U., et al. 2018, A&A, 614, A77 [NASA ADS] [CrossRef] [EDP Sciences] [Google Scholar]
- Silvotti, R., Uzundag, M., Baran, A.S., et al. 2019, MNRAS, 489, 4791 [NASA ADS] [CrossRef] [Google Scholar]
- Silvotti, R., Baran, A.S., Nemeth, P., et al. 2021, A&A, 508, 869 [Google Scholar]
- Slettebak, A., & Brundage, R.K. 1971, AJ, 76, 338 [NASA ADS] [CrossRef] [Google Scholar]
- Soubiran, C., Le Campion, J.-F., Brouillet, N., & Chemin, L. 2016, A&A, 591, A118 [NASA ADS] [CrossRef] [EDP Sciences] [Google Scholar]
- Stassun, K.G., Oelkers, R.J., Paegert, M., et al. 2019, AJ, 158, 138 [NASA ADS] [CrossRef] [Google Scholar]
- Stroeer, A., Heber, U., Lisker, T., et al. 2007, A&A, 462, 269 [NASA ADS] [CrossRef] [EDP Sciences] [Google Scholar]
- Tian, Z., Liu, X., Yuan, H., et al. 2020, ApJS, 249, 22 [NASA ADS] [CrossRef] [Google Scholar]
- Uzundag, M., Vuckovic, M., Nemeth, P., et al. 2021, A&A 651, A121 [NASA ADS] [CrossRef] [EDP Sciences] [Google Scholar]
- Van Grootel, V., Charpinet, S., Brassard, P., Fontaine, G., & Green, E.M. 2013, A&A, 553, A97 [NASA ADS] [CrossRef] [EDP Sciences] [Google Scholar]
- Van Grootel, V., Pozuelos, F.J., Thuillier, A., et al. 2021, A&A, 650, A205 [NASA ADS] [CrossRef] [EDP Sciences] [Google Scholar]
- Vennes, S., Kawka, A., & Németh, P. 2011, MNRAS, 410, 2095 [NASA ADS] [Google Scholar]
- Vos, J., Østensen, R.H., Németh, P., et al. 2013, A&A, 559, A54 [NASA ADS] [CrossRef] [EDP Sciences] [Google Scholar]
- Wang, L., Gies, D.R., Peters, G.J., et al. 2021, AJ, 161, 248 [NASA ADS] [CrossRef] [Google Scholar]
- Webbink, R.F. 1984, ApJ, 277, 355 [NASA ADS] [CrossRef] [Google Scholar]
- Wenger, M., Ochsenbein, F., Egret, D., et al. 2000, A&AS, 143, 9 [NASA ADS] [CrossRef] [EDP Sciences] [Google Scholar]
- Woudt, P.A., Warner, B., & Kilkenny, D. 2007, ASP Conf. Ser., 372, 619 [NASA ADS] [Google Scholar]
All Tables
Stars in Holdsworth et al. (2017) classified as pure p-mode pulsators but which have clear g-mode frequency peaks in the TESS photometry.
Pulsating hot subdwarfs discovered since Holdsworth et al. (2017). The pulsation type is either P (p-mode), G (g-mode), or H (both p- and g-modes present). Suspected binary systems are labelled B. The effective temperature (kK) and luminosity (from Gaia EDR3 parallaxes) are shown. If no value of Teff is available, the calculation of the luminosity assumes Teff = 3.0 kK. The surface gravity, log(g), and the log helium abundance Y = n(He)/n(H) are from Geier (2020). The reference codes for pulsation (Pref) and for the effective temperatures (Tref) are listed in the last two columns. The second half of the table lists the TESS sdBV stars discovered by Van Grootel et al. (2021).
List of 38 newly discovered pulsating sdB stars not marked as pulsators in the Van Grootel et al. (2021) catalogue. The columns are the same as in Table A1. An asterisk refers to a note for the star. The column marked F gives the following flags: 1 - an isolated target or target star with neighbours that have no influence on the target fluxes; 2 - a crowded field where the target flux is not substantially polluted by light from neighbouring stars; 3 - a star with bright neighbours that might substantially affect the amplitudes of the subdwarf light variation. The last column is the spectral type from Van Grootel et al. (2021).
List of 25 newly discovered TESS pulsating sdB candidates that are not listed in Van Grootel et al. (2021). The columns are the same as in Table A2. The last column is the spectral type from the literature.
All Figures
|
Fig. 1 Theoretical H–R diagram showing subdwarfs (violet filled circles) and main sequence stars brighter than 12.5 mag (small black circles) observed by TESS. Luminosities were derived from Gala parallaxes. The vertical arraignment of some points is due to adopted values of Teff = 50 000 K for sdO and Teff = 30 000 K for sdB stars for which values are not available and the use of Teff from spectral types for some main sequence stars. The solid line is the zero age main sequence for models with solar abundance (Bertelli et al. 2008). Also shown are the theoretical instability strips for β Cep and SPB stars from Miglio et al. (2007). |
| In the text | |
|
Fig. 2 Known pure p-mode pulsating hot subdwarfs observed by TESS showing frequency peaks in the g-mode range. |
| In the text | |
|
Fig. 3 Top panel: theoretical H–R diagram of hot subdwarfs extracted from the catalogue of Geier (2020) and located within the instability region. Bottom panel: mass distribution of these stars estimated directly from the stellar parameters. |
| In the text | |
|
Fig. 4 Top panel: theoretical H–R diagram for TESS pulsating subdwarfs. Middle panel: all pulsating subdwarfs, including the TESS pulsators. The p-mode pulsators are shown as green filled circles and the g-mode pulsators as violet open circles. The hybrid pulsators are shown as black asterisks. The four dotted lines show the predicted hot limit of Fontaine et al. (2003) (F), Jeffery & Saio (2006) (J), Hu et al. (2009) (H), and Bloemen et al. (2014) (B). Bottom panel: gravity–effective temperature diagram for all pulsating subdwarfs. The cross at the top left of each panel shows the approximate 1σ error bars. |
| In the text | |
|
Fig. A.1 Periodograms of unrecognised sdBV stars in Van Grootel et al. (2021). The amplitude is in parts per thousand. |
| In the text | |
|
Fig. A.2 Periodograms of newly discovered TESS sdBV stars. The amplitude is in parts per thousand. |
| In the text | |
Current usage metrics show cumulative count of Article Views (full-text article views including HTML views, PDF and ePub downloads, according to the available data) and Abstracts Views on Vision4Press platform.
Data correspond to usage on the plateform after 2015. The current usage metrics is available 48-96 hours after online publication and is updated daily on week days.
Initial download of the metrics may take a while.