Fig. 4
Download original image
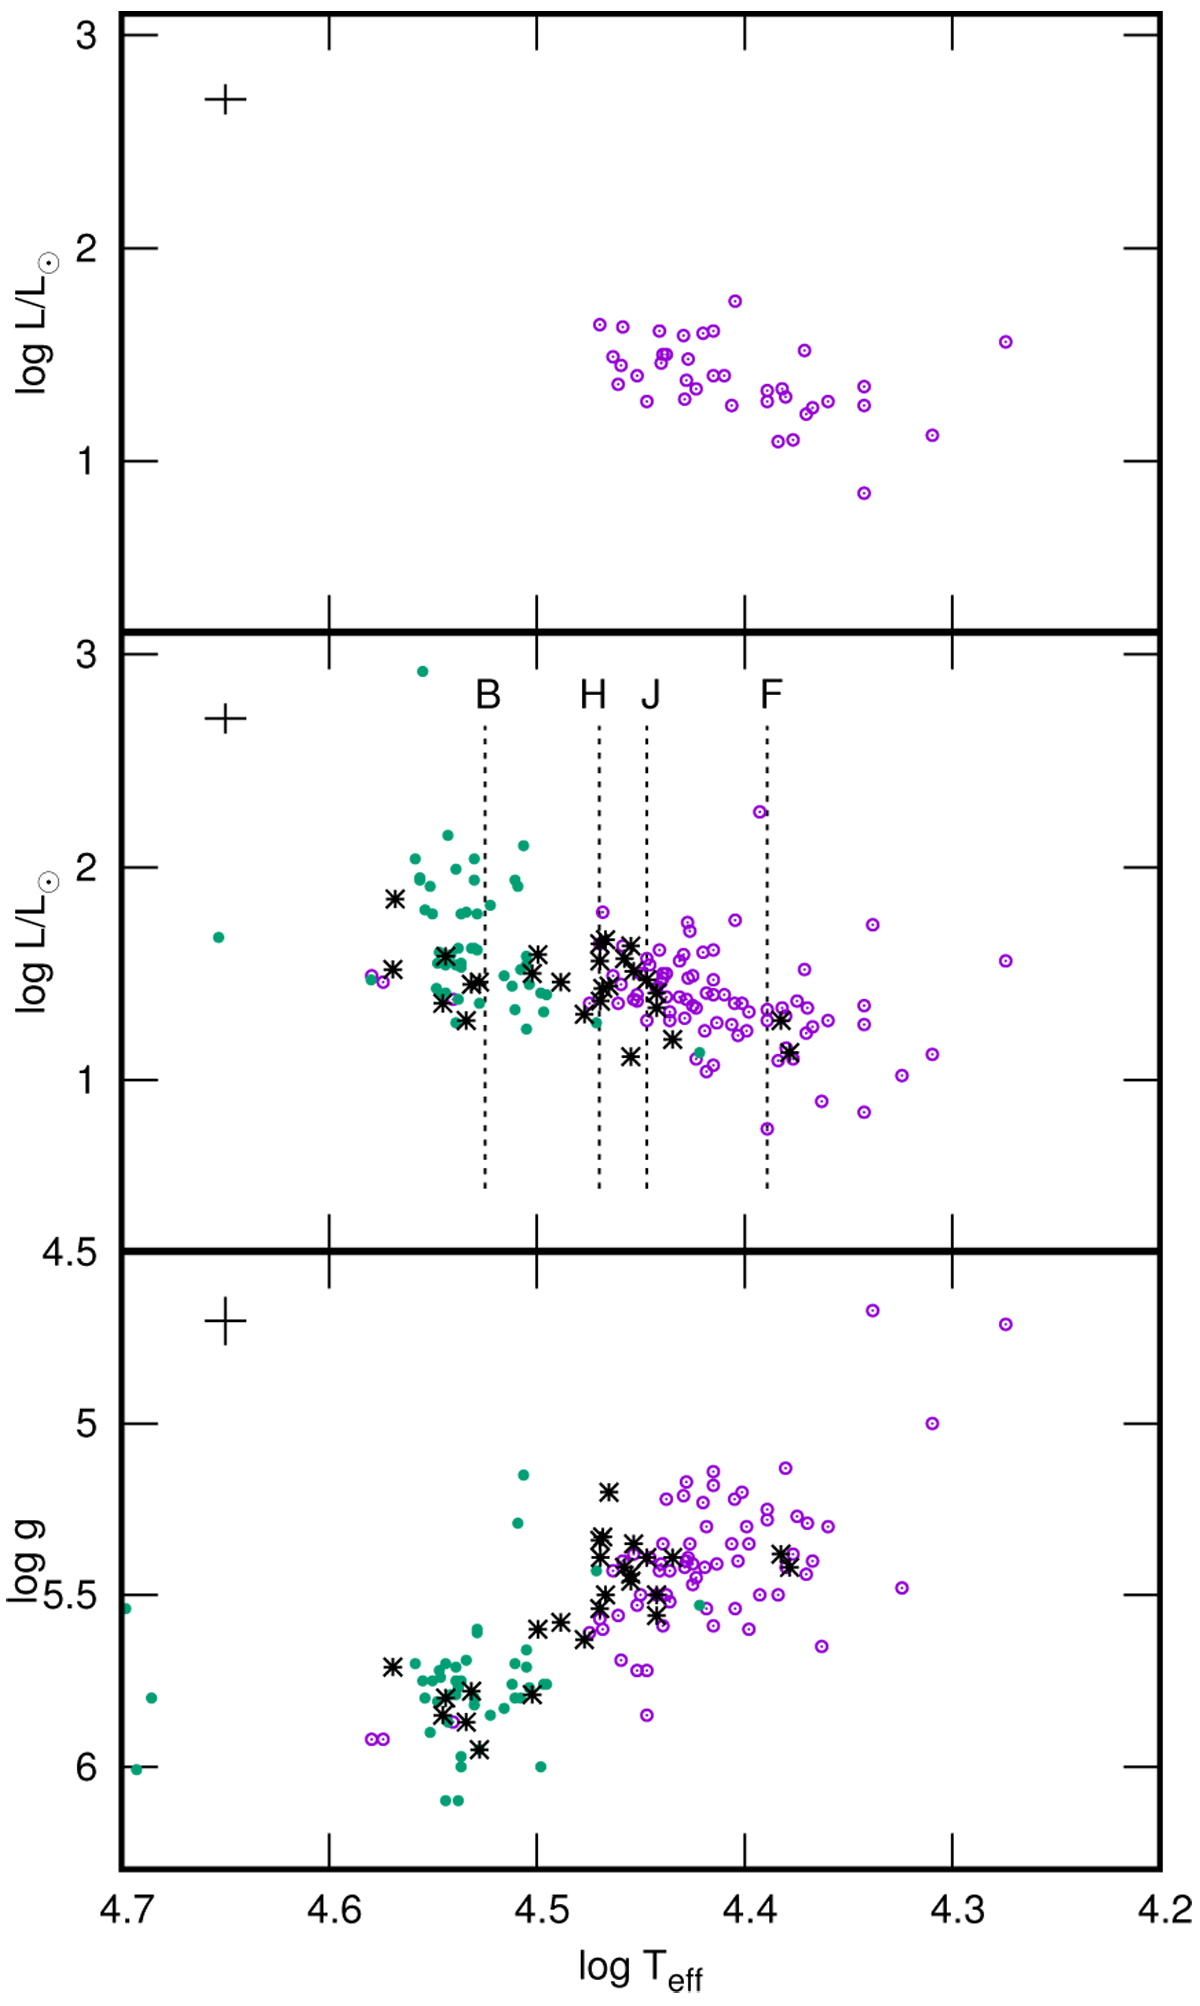
Top panel: theoretical H–R diagram for TESS pulsating subdwarfs. Middle panel: all pulsating subdwarfs, including the TESS pulsators. The p-mode pulsators are shown as green filled circles and the g-mode pulsators as violet open circles. The hybrid pulsators are shown as black asterisks. The four dotted lines show the predicted hot limit of Fontaine et al. (2003) (F), Jeffery & Saio (2006) (J), Hu et al. (2009) (H), and Bloemen et al. (2014) (B). Bottom panel: gravity–effective temperature diagram for all pulsating subdwarfs. The cross at the top left of each panel shows the approximate 1σ error bars.
Current usage metrics show cumulative count of Article Views (full-text article views including HTML views, PDF and ePub downloads, according to the available data) and Abstracts Views on Vision4Press platform.
Data correspond to usage on the plateform after 2015. The current usage metrics is available 48-96 hours after online publication and is updated daily on week days.
Initial download of the metrics may take a while.