| Issue |
A&A
Volume 663, July 2022
|
|
|---|---|---|
| Article Number | A152 | |
| Number of page(s) | 41 | |
| Section | Extragalactic astronomy | |
| DOI | https://doi.org/10.1051/0004-6361/202142480 | |
| Published online | 26 July 2022 | |
Predicting HCN, HCO+, multi-transition CO, and dust emission of star-forming galaxies
Constraining the properties of resolved gas and dust disks of local spiral galaxies
1
Université de Strasbourg, CNRS, Observatoire Astronomique de Strasbourg, UMR 7550, 67000 Strasbourg, France
e-mail: thomas.lizee@astro.unistra.fr
2
Laboratoire d’Astrophysique de Bordeaux, Univ. Bordeaux, CNRS, B18N, Allée Geoffroy Saint-Hilaire, 33615 Pessac, France
3
Argelander-Institut fur Astronomie, Universität Bonn, Auf dem Hügel 71, 53121 Bonn, Germany
Received:
19
October
2021
Accepted:
2
May
2022
The interstellar medium is a turbulent, multiphase, and multi-scale medium that follows scaling relations that link the surface density, volume density, and velocity dispersion with the cloud size. Galactic clouds range from below 1 pc to about 100 pc in size. Extragalactic clouds appear to follow the same range, although they are only now becoming observable in atomic and molecular lines. Analytical models of galactic gaseous disks need to take the multi-scale and multiphase nature of the interstellar medium into account. They can be described as clumpy star-forming accretion disks in vertical hydrostatic equilibrium, with the mid-plane pressure balancing the gravity of the gaseous and stellar disk. Interstellar medium turbulence is taken into account by applying Galactic scaling relations to the cold atomic and molecular gas phases. Turbulence is maintained through energy injection by supernovae. With the determination of the gas mass fraction at a given spatial scale, the equilibrium gas temperature between turbulent heating and line cooling, the molecular abundances, and the molecular line emission can be calculated. The resulting model radial profiles of infrared, HI, CO, HCN, and HCO+ emission are compared to THINGS, HERACLES, EMPIRE, SINGS, and GALEX observations of 17 local spiral galaxies. The model free parameters were constrained for each galactic radius independently. The Toomre parameter, which measures the stability against star formation (cloud collapse), exceeds unity in the inner disk of a significant number of galaxies. In two galaxies it also exceeds unity in the outer disk. Therefore, in spiral galaxies Qtot = 1 is not ubiquitous. The model gas velocity dispersion is consistent with the observed HI velocity dispersion where available. Within our model, HCN and HCO+ is already detectable in relatively low-density gas (∼1000 cm−3). We derive CO and HCN conversion factors and molecular gas depletion times. Both conversion factors are consistent with values found in the literature. Whereas in the massive galaxies the viscous timescale greatly exceeds the star-formation timescale, the viscous timescale is smaller than the star-formation timescale within R ∼ 2 Rd, the disk scale length, in the low-mass galaxies. We suggest that massive spiral galaxies undergo starvation in the absence of gas accretion from the halo, whereas in low-mass galaxies the fuel for star formation reaches R ∼ 2 Rd from outside via a thick gas disk component with a high radial infall velocity observable in the HI line.
Key words: galaxies: ISM / galaxies: evolution / galaxies: star formation
© T. Lizée et al. 2022
 Open Access article, published by EDP Sciences, under the terms of the Creative Commons Attribution License (https://creativecommons.org/licenses/by/4.0), which permits unrestricted use, distribution, and reproduction in any medium, provided the original work is properly cited.
This article is published in open access under the Subscribe-to-Open model. Subscribe to A&A to support open access publication.
1. Introduction
The interstellar medium (ISM) of spiral galaxies involves multiple scales, multiple densities and temperatures, and multiple phases (ionized, atomic, and molecular). The observed gas velocity dispersions (∼10 km s−1 in the atomic gas and several km s−1 in the molecular gas) indicate that the ISM is supersonically turbulent. Within the star-forming disk, turbulence is triggered by thermal instabilities and maintained by the energy injection through stellar feedback. Scaling relations for giant molecular clouds (GMCs) were first established by Larson (1981): power-law relationships between the velocity dispersion and the gas density on the one hand and the size of the emitting regions on the other. The power-law indices were refined by, for example, Heyer et al. (2009) and Lombardi et al. (2010). Galactic HI scaling relations were established by Larson (1979) and Quiroga (1983) and used in the two-phase HI model of the Galaxy by Wolfire et al. (2003).
The molecular gas depletion time, tdep, H2 = MH2/SFR, measured at kiloparsec scales in large spiral galaxies is about constant with tdep, H2 ∼ 2 Gyr (e.g., Kennicutt 1998a,b; Bigiel et al. 2008; Leroy et al. 2008; Ellison et al. 2021). This relation between the molecular gas mass and the star-formation rate (SFR) breaks down at scales smaller than a few hundred parsecs (Bigiel et al. 2011; Kruijssen & Longmore 2014; Schinnerer et al. 2019) because of the life cycle of the star-formation process. At the scale of individual GMCs, regions of massive star formation and cold molecular gas are not correlated because subsequent phases of the star-formation process are observed. At these scales, gas depletion times up to 17 times shorter than those of nearby galaxies (Heiderman et al. 2010) or broken power laws (Retes-Romero et al. 2017) were found.
The star-formation efficiency, which is the inverse of the gas depletion time, depends on the determination of the molecular gas mass, which is hampered by the uncertainty of the conversion between the observed line emission (mostly CO, but also HCN and HCO+ for dense gas) and the mass of molecular hydrogen. Whereas the Galactic CO conversion factor is well established (αCO = ΣH2/ICO = 4.3 M⊙ pc−2 (K km s−1)−1 including He; Bolatto et al. 2013) and can be regarded as canonical in star-forming galaxies of about solar metallicity, the widely used HCN conversion factor of αHCN = 10 M⊙ pc−2 (K km s−1)−1 was derived by Gao & Solomon (2004) assuming virialized (self-gravitating) optically thick dense gas cores with a gas density of n ∼ 3 × 104 cm−3 and constant brightness temperatures of 35 K. Wu et al. (2010) found a twice higher HCN conversion factor of αHCN ∼ 20 M⊙ pc−2 (K km s−1)−1.
The Vollmer & Beckert (2003) theory of clumpy gas disks provides analytic expressions for large-scale and small-scale properties of galactic gas disks. The large-scale properties considered are the gas surface density, volume density, disk height, turbulent driving length scale, velocity dispersion, gas viscosity, volume filling factor, and molecular fraction. Small-scale properties are the mass, size, density, turbulent crossing time, free-fall time, and molecular formation timescale of the most massive self-gravitating gas clouds. These quantities depend on the stellar surface density, angular velocity, disk radius R, and three free parameters, which are the Toomre parameter Q of the gas, the mass accretion rate Ṁ, and the ratio δ between the driving length scale of turbulence and the cloud size. Vollmer & Leroy (2011) determined these free parameters using three independent measurements of the radial profiles of the atomic gas (HI), molecular gas (CO), and SFR (far-ultraviolet + 24 μm) for a sample of 18 mostly spiral galaxies from Leroy et al. (2008). The fits of radial profiles were acceptable, with reduced χ2 minimizations (defined as the normalized sum of the squared differences divided by the observational uncertainties) generally smaller than 2 for all galaxies except NGC 5194 (M 51):
where 𝒪i corresponds to a single observational measurement, ℳi is the model value, and σi is the observational error. It was found that the model star-formation efficiency is very sensitive to the description of the local pressure equilibrium in the disk midplane. The model-derived free-fall timescales of self-gravitating clouds were in good agreement with expectations based on observations. Only low-mass galaxies (M* < 1010 M⊙) can balance the gas loss due to star formation with radial gas inflow within the galactic disk. Krumholz & Burkhart (2016) elaborated a similar model that included radial gas transport and stellar feedback. They concluded that, in spiral galaxies at low redshift, turbulence is driven by star formation.
Vollmer et al. (2017) significantly extended the Vollmer & Leroy (2011) model by introducing ISM scaling relations. The extended model simultaneously calculates the total gas mass, HI/H2 mass ratio, gas velocity dispersion, infrared luminosity, infrared spectral energy distribution, CO spectral line energy distribution (SLED), HCN(1−0) and HCO+(1−0) emission of a galaxy given its size, integrated SFR, stellar mass radial profile, rotation curve, and Toomre Q parameter. The model was applied to the integrated properties of local spiral galaxies, ultra-luminous infrared galaxies (ULIRGs), high-z star-forming galaxies, and submillimeter galaxies. The model reproduced the observed CO luminosities and SLEDs of all sample galaxies within the model uncertainties (∼0.3 dex). The model CO and HCN conversion factors had uncertainties of a factor of two. Both the HCN and HCO+ emission trace the dense molecular gas to a factor of approximately two for the local spiral galaxies, ULIRGs, and submillimeter galaxies.
In the present article we use the Vollmer et al. (2017) model to calculate the infrared, HI, CO, HCN, and HCO+ emission radial profiles and compare them to observations of 17 local spiral galaxies from Leroy et al. (2008). Unlike in Vollmer & Leroy (2011), the assumption of a radially constant mass accretion rate Ṁ was dropped and the Toomre parameter Q was self-consistently determined at each galactic radius. The new model allowed us to compare the SFR based on the far-ultraviolet (FUV) and 24 μm emission to the infrared radial profile and to calculate the radial variations in (i) the CO and HCN conversion factors and (ii) the star-formation efficiency.
The structure of this article is the following: The observations from the literature are described in Sect. 2. Our model of a turbulent clumpy accretion disk is outlined, the search for the best-fit model is explained, and the detected model degeneracies are presented in Sect. 3. The results are given in Sect. 4, followed by the discussion (Sect. 5) and our conclusions (Sect. 6).
2. Observations
In this section we describe the observational data, which are used for the comparison with the quantities obtained from our models. All multiwavelength data were convolved to the same spatial resolution and were converted to the same unit (i.e., K km s−1) for the atomic and molecular line data and MJy sr−1 for the infrared data.
2.1. Atomic hydrogen HI
The 21 cm HI radial profiles used in this paper were taken from the “HI Nearby Galaxy Survey” (THINGS, CDS VizieR table J/AJ/136/2782) presented in Walter et al. (2008). The spatial resolution is about 7″ with a spectral resolution of 5 km s−1 per channel. With an average of 7 h of observations on source, a typical rms noise of 0.4 mJy beam−1 (which corresponds to 5 K) was reached.
2.2. Carbon monoxide CO(2–1)
The “HERA CO Line Extragalactic Survey” (HERACLES) is presented in detail in Leroy et al. (2009). The data were collected using the HEterodyne Receiver Array (HERA) multi-pixel receiver from the single dish 30 m telescope of the “Institut de Radioastronomie Millimétrique” (IRAM, Pico Veleta, Spain). HERA was tuned near 230 GHz to observe the CO(2−1) rotational transition. On-the-flight (OTF) maps were produced, giving a spatial resolution of 13″, a spectral resolution of 2.6 km s−1 and a rms noise about 20 mK. The HERACLES survey focused on targets that were part of the THINGS galaxy sample. We used the radial profiles presented in Leroy et al. (2008) (CDS VizieR table J/AJ/136/2782) except for NGC 3627, NGC 5194, and NGC 7793, for which we used the CO(2−1) profile presented in den Brok et al. (2021) derived from the “Physics at High Angular resolution in Nearby GalaxieS” (PHANGS) data survey (Leroy et al. 2021).
2.3. Carbon monoxyde CO(1–0), hydrogen cyanide HCN(1–0), and formylium HCO+(1–0)
The CO(1−0), HCN(1−0), and HCO+(1−0) radial profiles were taken from the “EMIR Multiline Probe of the ISM Regulating Galaxy Evolution” (EMPIRE) survey (Jiménez-Donaire et al. 2019; CDS VizieR table J/ApJ/880/127). The EMPIRE observations were carried out at the IRAM 30 m telescope using the dual-polarization “Eight MIxer Receiver” (EMIR) receiver. The spectral resolution is about 4 km s−1 per channel, with an rms noise about 2−3 mK for the dense gas (nH2 ∼ 104 cm−3) HCN and HCO+ observations. Spatial resolutions are 26″, 33″, and 33″ for the CO(1−0), HCN(1−0) and HCO+(1−0) data, respectively. In contrast to the other data presented in this paper for which radial profiles with 10″ wide rings were extracted from the moment-0 maps, Jiménez-Donaire et al. (2019) used a stacking method to recover the emission from the regions with low signal-to-noise ratio.
2.4. Star-formation rate
Star-formation rate profiles were computed by Leroy et al. (2009) using the FUV “Galaxy Evolution Explorer” (GALEX) data (Gil de Paz et al. 2007) with the 24 μm infrared data from the “Spitzer Infrared Nearby Galaxies Survey” (SINGS) (Kennicutt et al. 2003). Their spatial resolutions are 6″ and 5″, respectively. The following linear combination was used to compute the SFR:
where IFUV and I24 μm are the ultraviolet and infrared fluxes in MJy sr−1 and i is the inclination angle of the galaxy. The SFR surface density  has units of M⊙ kpc−2 yr−1.
2.5. Far-infrared data profiles and temperature maps
We worked with four far-infrared bands from the “Photodetector Array Camera and Spectrometer” (PACS: 100 μm) and “Spectral and Photometric Imaging Receiver” (SPIRE: 250, 350, and 500 μm) instrument on the Herschel satellite. Their spatial resolutions are 7, 18, 25, and 35″, respectively. The far-infrared profiles were taken from Hunt et al. (2015) (CDS VizieR table J/A+A/576/A33).
2.6. Sample of galaxies
Our sample comprises 17 star-forming galaxies that the surveys presented in the previous section have in common. This galaxy sample is composed of five low-mass (M* < 1010 M⊙) galaxies and 12 nearby large spiral galaxies. The general properties of these galaxies are presented in Table 1. The rotation curves of the model galaxies were computed by Leroy et al. (2008) using the following expression (Boissier et al. 2003):
Galaxy properties.
where vflat and lflat were determined by performing a polynomial fit on the observational curves. The common spatial resolution is 400 pc for the low-mass galaxies and 800 pc for the large spiral galaxies.
3. Model fitting
In this section we describe our analytical model and introduce its free parameters. The comparison with the data was performed via a reduced χ2 minimization (Eq. (1)). We investigated the degeneracies between the free model parameters.
3.1. The model
Our model is a slightly modified version of the analytical model presented by Vollmer et al. (2017), itself derived from previous versions presented in Vollmer & Beckert (2003) and Vollmer & Leroy (2011). A detailed description of the model is given in Appendix A. The analytical model describes galaxies as star-forming, clumpy, and turbulent accretion disks. The ISM is considered as a turbulent multiphase gas. This gas is assumed to be in vertical hydrostatic equilibrium, with the mid-plane pressure balancing the weight of the gaseous and the stellar disk (Elmegreen 1989; Eq. (A.1)). The model gas is described as “clumpy”, so the local density can be enhanced relative to the average density of the disk. The local free-fall time of an individual gas clump is taken as the governing timescale for star formation. The SFR is used to calculate the rate of energy injection by supernova (SN) explosions. This rate is related to the turbulent velocity dispersion and the driving scale of turbulence. These quantities in turn provide estimates of the “clumpiness” of gas in the disk (the contrast between local and average density) and the rate at which viscosity moves matter inward. The model relies on several empirical calibrations: the relation between the stellar velocity dispersion and the stellar disk scale length (Eq. (A.2)), the relationship between the SFR and the energy injected into the ISM by SNe (Eq. (A.5)), and the characteristic time of H2 formation, which is related to the gas metallicity Z (Eqs. (A.15)–(A.17)) and the gas density. The equilibrium between the different phases of the ISM and the equilibrium between turbulence and star formation depends on three local timescales: the turbulent crossing time  , the molecule formation timescale
  , and the local free-fall timescale
  of a cloud. In addition, photodissociation of molecules is taken into account.
The model has a large-scale and a small-scale part. The large-scale part gives the surface density, turbulent velocity, disk height, and gas viscosity. The small-scale part begins at densities where gas clouds become self-gravitating ( ). The non-self-gravitating and self-gravitating clouds obey different scaling relations, which are set by observations (Appendix A.2.2). For each gas density, the mass fraction is characterized by a lognormal probability distribution function and the Mach number (Padoan et al. 1997). The temperatures of the gas clouds are calculated via the equilibrium between turbulent mechanical and cosmic ray heating and gas cooling via CO and H2 line emission (Appendix A.2.4). The abundances of the different molecules are determined using the gas-grain code Nautilus (Hersant et al. 2009). The dust temperatures are calculated via the equilibrium between heating by the interstellar UV and optical radiation field and cooling via infrared emission.
The model simultaneously calculates (i) for the large-scale part: the total gas profile, the gas velocity dispersion, the SFR, and the volume filling factor; (ii) for the small-scale part: the molecular fraction, infrared profiles and spectral energy distribution, and molecular line profiles of different molecules, such as CO(1−0), CO(2−1), HCN(1−0), and HCO+(1−0). The molecular line emission calculation is based on a two-level approximation and the escape probability formalism. This approximation greatly decreases the computation time. An important ingredient for the line emission is the area-filling factor of the gas clouds, which is a result of the small-scale part of the analytic disk model. The new code was modified to enable an independent treatment of each of the radial data points. The input of a given radial profile of the Toomre parameter Q and the assumption of a constant mass accretion rate Ṁ, which were required to produce the molecular line profiles in Vollmer & Leroy (2011), are no longer necessary. The radial profiles of the stellar surface density and the rotation curve (both taken from Leroy et al. 2008) are used as inputs of the model. The model yields the radial profiles of Ṁ and Q for a given δ, which best fit the available observations (SFR, HI, CO(1−0), CO(2−1)). With these profiles the physical properties of the ISM such as the molecular surface density, the gas velocity dispersion, or the CO and HCN conversion factors can be calculated.
3.2. Model parameters
The model inputs are the rotation curve and the stellar surface density profile. The model contains three main free parameters: (i) the Toomre parameter Q of the gas, which indicates the gravitational stability (Q = 1) of a gas cloud, (ii) the mass accretion rate Ṁ, which sets the gas turbulent velocity, and (iii) δ, the ratio between the turbulent driving length scale and the size of the largest self-gravitating clouds. At a given disk radius R the model yields the SFR per unit area and the HI and molecular line emission for a given set of Q, Ṁ, and δ.
Unlike Vollmer et al. (2017), we decided to vary other parameters that were previously constant. These parameters present large uncertainties and were identified as having a significant impact on the results. The first parameter, ξ, relates the SFR to the energy injected into the ISM by SNe (Eq. (A.5)). The second parameter, α0, relates the characteristic time to form H2 out of H to the local free-fall time (Eq. (A.16)). This parameter depends on to the gas metallicity of the galaxy (Eq. (A.17)). The last parameter, γ, controls the vertical component of the stellar velocity dispersion and thus the gravitational restoring force of the stellar disk (Eq. (A.1)). This is motivated by a possible heating of the stellar disk following a gravitational interaction. Because of the large computation time of the models we limited ourselves to four values for δ, five values of ξ and α0, and three values for γ: δ = [3, 5, 7, 9], ξ = (0.25, 0.5, 1, 2, 4) × 4.6 × 10−8 (pc yr−1)2, α0 = (0.25, 0.5, 1, 2, 4) × 2.2 × 107 yr M⊙ pc−3, and γ = 0.5, 1, 2. We individually varied each of these parameters, with default values corresponding to unity for ξ, α0, and γ. Because of the large computation times we did not consider combinations of these variations. All these free parameters are summarized in Table 2.
Model free parameters.
The infrared emission also depends on the gas-to-dust ratio (GDR) and exponent β of the wavelength dependence of the dust absorption coefficient. For the search of [Q(R),Ṁ(R),δ,α0,ξ,γ] we used GDR = 100 and β = 1.5. As a last step, we kept best-fit [Q(R),Ṁ(R),δ,α0,ξ,γ] constant and varied GDR and β to determine their values by searching for the best fit of the observed infrared profiles.
Finally, different values of the cosmic ray ionization rate were applied to the best-fit models. The value that was assumed in previous versions of the model was ζCR = 10−17 s−1, which corresponds to the standard value for GMCs (Dalgarno 2006). Additionally, we used ζCR = 3 × 10⁻¹⁸ s−1 and 10−18 s−1.
3.3. Determination of the best-fit model using χ2 minimizations
For each set of [δ, α0, ξ, γ] we performed a χ2 minimization at each radius independently to find the best-fit Q and Ṁ. The contributions from the different radial profiles (SFR, HI, CO(1−0), and CO(2−1)) were summed to obtain a total χ2:
where 𝒪i and ℳi are the observed and model data points and σi the uncertainties of the observations. For the majority of galaxies, we set  with the CO(2−1) data from the HERACLES survey. We increased the uncertainties of the PHANGS radial profiles of NGC 3627 and NGC 5194 to those typically found for the HERACLES profiles. Without this increase in the uncertainties, the PHANGS profiles would dominate the total χ2. For galaxies observed by the EMPIRE survey, we set
  to take the CO(1−0) emission in the determination of the best-fit model into account. It turned out that the inclusion of the CO(1−0) emission led to somewhat different fitting results. For consistency between the results of all galaxies, we also performed χ2 minimizations including only CO(2−1) emission for the galaxies observed by EMPIRE. The comparison of the line brightness temperatures obtained with our model and those obtained with RADEX (van der Tak et al. 2007) showed good agreement (within ∼50%) for the CO lines but much less good agreement for the HCN and HCO+ lines (up to a factor of two to three). Therefore,
  and
and  based on the line brightness temperatures obtained with our model were calculated but not included in the
  calculation. We worked within a parameter grid of twenty values of Toomre parameter Q = [1 : 10] and twenty values of the accretion rate Ṁ = [10−3:1] for each radius. These intervals were chosen according to the results of Vollmer & Leroy (2011). We did not consider gas disks that are unstable to fragmentation (Q < 1). The outer radius of the model is set by the detection limit of the CO observations.
The best-fit models for each galaxy are listed in Table 3 for galaxies with EMPIRE data and Table 4 for the rest of the sample. The corresponding radial profiles of Q and Ṁ are shown in Figs. 2 and B.1–B.16 and discussed in Sect. 4.3.1. The models presented in the two tables correspond to the models that present a  ]. In Table 3, the values between parentheses correspond to the
  that are not included in the
  calculations.
Best-fit models of the EMPIRE galaxies.
Best-fit models of the THINGS galaxies without EMPIRE data.
Because the determination of the best-fit basic models were very time consuming, we decided to vary GDR, β, and ζCR separately: a second, independent χ2 minimization was performed on the basic model to determine the value of β and GDR to fit the 100, 250, and 500 μm infrared radial profiles. This minimization generally led to values of GDR and β, which are higher than the default values, decreasing the dust optical depth and infrared emission. The corresponding change of the molecular line emission due to a lower background temperature is less than one percent. The values of β and GDR for each galaxy are presented in Table 5. We found a mean β = 2 and a mean GDR ∼250, which is more than twice the value found by Sandstrom et al. (2013). The difference probably lies in the dust illumination of our model and that of Draine & Li (2007). In our model the radiation field is proportional to the SFR, which is constant at a given galactic radius. In the Draine & Li model the dust mass is exposed to a power-law distribution of starlight intensities between Umin and Umax with dM/dU ∝ U−1. This leads to higher dust temperatures and lower dust masses in our model compared to those derived by the Draine & Li model.
Infrared profile parameters.
A third χ2 minimization was finally performed on the basic model to find which cosmic ray ionization rate reproduces the HCN and HCO+ radial profiles best, with three different values of ζCR = [10−18, 3 × 10⁻¹⁸, 10−17] s−1. These values correspond to the observed range of the cosmic ray ionization rate (see Sect. 4.3.2). The best-fit values of ζCR are presented in Table 6.
Determination of the HCN and HCO+ best-fit models for different cosmic ray ionization rates ζCR.
3.4. Degeneracies between free parameters
The study of the models revealed several degeneracies between the input parameters. Most of the results stated here have been discussed in our previous work (Lizée et al. 2021). First, the exact value of δ never appears to be important for the determination of the best-fit model. A constant value of δ = 5 as used in Vollmer & Leroy (2011) and Vollmer et al. (2017) is thus justified. Second, increasing the value of ξ by a factor of two leads to similar model χ2, Q, and Ṁ as dividing the value of α0 by a factor of two. Third, increasing the value of α0 by a factor of two leads to similar model χ2, Q, and Ṁ as multiplying the stellar velocity dispersion by a factor of two.
The first degeneracy is illustrated in Tables 3 and 4. In the case of NGC 5055, NGC 3351, NGC 3521, NGC 4736, NGC 7331, NGC 2403, and NGC 4214 although either a division of α0 by two or a multiplication of ξ by two is favored by most best-fit models, the second degeneracy mentioned above becomes evident when inspecting the ten models with the lowest χ2 for these galaxies. In addition, the best-fit models of NGC 7793 needed a decreased metallicity (2 × α0) with respect to the leaky box model (Eq. (A.16)). The lower metallicities are consistent with observations (Moustakas et al. 2010; Stanghellini et al. 2015) and can be understood as a consequence of external accretion of metal-poor gas.
The division of α0 by two is equivalent to a doubling of the metallicity, which is in conflict with existing metallicity measurements (e.g., Moustakas et al. 2010; Kreckel et al. 2019; Berg et al. 2020). A higher value of ξ can be justified in the following way: Thornton et al. (1998) have shown by modeling SN explosions in different environments that the kinetic energy of the remnants is about ten percent of the total SN energy irrespective of the density and metallicity of the ambient medium. The SN energy input into the ISM is  ergs. The integrated number of type II SNe in the Galaxy is taken to be ṄSN ∼ 1/60 yr−1 (Rozwadowska et al. 2021). The Galactic SFR is taken to be M* = 1.6 M⊙ yr−1 (Licquia & Newman 2015). With a kinetic to total SN energy fraction of 16% one obtains ξ = 9.2 × 10⁻⁸ (pc yr−1)2, a factor two higher than the value used by Vollmer & Beckert (2003) and Vollmer & Leroy (2011). The improved large-scale model presented in Appendix A is equivalent to the model used by Vollmer & Leroy (2011) provided that ξ = 9.2 × 10⁻⁸ (pc yr−1)2.
4. Results
Unlike the model presented in Vollmer et al. (2017), the current model is able to produce radial profiles of the infrared fluxes and molecular line emission. In this way we can directly compare the observational radial profiles to our models. Typical uncertainties of the derived Ṁ and Q are 0.3 dex and 0.2 dex, respectively. This translates into uncertainties of 2 − 3 km s−1 for the turbulent velocity dispersion of the ISM and 0.1 − 0.2 dex for the CO and HCN conversion factors.
In this section we focus on the results of NGC 6946 as an example; the results for the other galaxies are available in Appendix B. The best-fit models presented in Table 3 are computed using our molecular emission recipe (Appendix A.2.5) to fix the values of δ, ξ, α0, and γ, and to produce radial profiles of Q and Ṁ. We then recalculated the molecular line emission of our best-fit models using RADEX instead of our molecular emission recipe to produce the final radial profiles. Since the use of RADEX is time consuming, we could not use it for the Q−Ṁ grid calculations. As a consistency check we used RADEX for the Q−Ṁ grid calculations for NGC 6946 with the best-fit values of δ, ξ, α0, and γ given in Table 3. The resulting RADEX best-fit model yields a better fit to the CO(1−0) and CO(2−1) line emission, a less good fit to the SFR in the inner disk, a lower Q parameter (Q = 1), a comparable Ṁ, and a somewhat lower gas velocity dispersion compared to the model where RADEX was used a posteriori. Since these changes are within the uncertainties of the model, we are confident that our derived model parameters are meaningful.
4.1. NGC 6946
The best-fit models for NGC 6946 obtained with our molecular emission calculation recipe are presented in Figs. 1c and d. The best-fit models using RADEX for the molecular line emission with and without CO(1−0) in the χ2 minimization are compared in Figs. 1a and b, respectively. The total  without
  is 40, much lower than the one obtained when
  is included in
  (
( ; see Table 3). The very small errors given for the CO(1−0) EMPIRE data obtained via stacking tend to favor the CO(1−0) profile over the other quantities and lead to larger
  values. The
  with
with  in
in  is 182 compared to
  without
  in
in  . The difference is mainly due to the central part of the galaxy (R ≲ 2 kpc) that is not well reproduced by the model. Likewise,
  is much lower in the model without
  than in the model with
  in
in  (
( ) because of the poor fit within the central 2 kpc. Both HI and SFR radial profiles are reproduced within the error bars from 2 kpc to the edge of the disk with or without
  in
in  . The best-fits of the CO(2−1) radial profiles remain fairly comparable with or without
  in
in  (
( instead of 25).
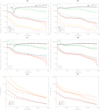 |
Fig. 1. NGC 6946. Errors bars correspond to the observations. Solid lines correspond the median results of the best-fit models and thin gray lines to the best-fit models. The values of the secondary parameters for these best-fit models are given in the lower-left corner of the middle panels. (a) Best-fit model including |
The comparison of the model and observed infrared profiles shows that without CO(1−0) the model is much better at reproducing the radial profiles in the central part of the galaxy. Beyond 2 kpc, the 250 and 500 μm profiles are also well reproduced without CO(1−0). The profile of the 100 μm emission, on the other hand, is not well reproduced by the model with or without  in
in  . The radial profiles of the model 250 and 500 μm profiles are somewhat steeper than the observed profiles in the model including
  in the χ2 minimization. The free parameters β and GDR, do not modify the slope of the far-infrared profiles.
The main improvement provided by the use of the CO(1−0) is the fit of the HCN(1−0) and HCO+(1−0) profiles with a significantly lower  , 5524 instead of 20 430 (see Table 6). However,
  and
and  increase by a factor of about 25 and 200, respectively, when
  is included in
  . The model is therefore not able to reproduce the infrared (and thus the SFR) and the dense molecular line emission simultaneously in the central part of the galaxy.
The physical parameters Q and Ṁ associated with the best-fit models are presented in Figs. 2a and b. The Toomre parameter Qgas increases from around unity near the galaxy center to Qgas = 2 − 3 toward the outer disk for both χ2 calculations. The accretion rate Ṁ increases monotonically from 1 to 6 kpc by a factor of ∼10 from the center to the edge of the disk. The combination of these two parameters leads to a total velocity dispersion  , which increases slightly from the canonical value of 10 km s−1 at 1 kpc to more than 13 km s−1 at 6 kpc (see Fig. 2, panels c and d). The model without
  in
in  shows velocity dispersions higher than 15 km s−1 at radii larger than 6 kpc.
 |
Fig. 2. NGC 6946: radial profiles of the main physical quantities with and without |
We compared the model velocity dispersion profiles to the observed profiles based on THINGS and HERACLES data presented by Caldú-Primo et al. (2013). Ianjamasimanana et al. (2015) found a constant velocity dispersion around the canonical value of 10 km s−1 up to R25 in NGC 6946. The model velocity dispersion profile including  in the χ2 minimization is consistent with the observed profiles Figs. 2c and d. The model without
  in χ2 significantly overestimates the velocity dispersion for R > 6 kpc. We conclude that this increase in the model velocity dispersion on the order of 8 km s−1 is not physical. This issue is further discussed in Sect. 4.3.1.
The profiles of the gas depletion and viscous timescales of the best-fit models are presented in Figs. 2e and f. The viscous timescale is defined as
where ldriv is the turbulent driving length. The gas depletion time corresponds to the time that a galaxy takes to locally convert its gas into stars. The timescale of radial gas transport is given by the viscous timescale. By comparing these two times, it is possible to estimate whether or not a galaxy can maintain its star formation via radial gas transport without external accretion. For the best-fit models with and without  in the
  calculations the gas depletion time is almost constant beyond 2 kpc with tdep ∼ 1 − 2 Gyr, which is consistent with the average value for spiral galaxies (Bigiel et al. 2008; Leroy et al. 2008; Ellison et al. 2021). The viscous timescale is much longer than the gas depletion time for all radii. Therefore, there must be external accretion onto the galactic disk to maintain the observed SFR for more than a few gigayears.
We computed the CO and HCN conversion factor profiles of NGC 6946 (see Fig. 2, panels g and h). For both χ2 calculations, the CO-to-H2 conversion factors increase from the galaxy center to the edge of the CO emission distribution, with a mean αCO close to the Galactic value of  pc−2 (K km s−1)−1 (Bolatto et al. 2013).
The HCN-to-dense gas conversion factor, defined as the ratio between the flux IHCN and the molecular gas formed in clouds with density over n = 3 × 104 cm−3, of the model with  in
in  is about a factor of two higher than the value of αHCN = 10 M⊙ pc−2 (K km s−1)−1 (Gao & Solomon 2004) and consistent with the value found by Wu et al. (2010). Since the model under-predicts the observed HCN emission by a factor of two, the model HCN conversion factor is probably overestimated by the same factor. On the other hand, the HCN-to-dense gas conversion factor of the model without
  in
in  is about a factor of two lower than the value of Gao & Solomon (2004). The difference is mainly caused by higher HCN abundances at a cosmic ray ionization rate of ζCR = 10−17 s−1 compared to the HCN abundances at a three times lower ζCR. We estimate the HCN conversion factor to be αHCN = 5 − 10 M⊙ pc−2 (K km s−1)−1. In both models the HCN-to-dense gas conversion factor decreases within the inner kpc.
4.2. The galaxy sample
In this section we review the results obtained for the other galaxies of the sample. The  and
and  are those calculated with excitation temperatures obtained from the method outlined in Appendix A.2.5. The corresponding figures, which show the integrated line emission based on the results of RADEX, are available in Appendix B, ordered in the same way as in Tables 3 and 4.
We first discuss the galaxies for which EMPIRE data are available (Table 3). Whereas most of these galaxies have a  including
  between 200 and 400, the
  of NGC 3627 and NGC 6946 are 1053 and 2102, respectively. As discussed in Sect. 4.1, the high
  of NGC 6946 is caused by an overestimation of the central SFR. In NGC 3627, the star formation and HI radial profiles could not be fitted in a satisfactory way. The model without
  reproduces the available observations significantly better than the model with
  in the
  calculations. We thus adopted the model with
  in
in  for all EMPIRE galaxies except NGC 3627.
For all EMPIRE galaxies the model infrared profiles are broadly consistent with observations. In general, the model infrared profiles are steeper than the observed infrared profiles. This effect becomes stronger at smaller wavelengths. The preferred CR ionization rate is ζCR = 10−18 s−1.
For all EMPIRE galaxies except NGC 6946 the Toomre parameter Qgas decreases with radius. The highest central Qgas are found in NGC 628 and NGC 5055 (Q ∼ 8). In NGC 3627 the Toomre parameter decreases from Qgas = 4 − 6 in the galaxy center to Qgas = 1.5 − 2 at R = 5 kpc. The NGC 5194 model yields a Toomre parameter, which decreases from Qgas = 2 in the center to about unity at R = 1.5 kpc.
The radial profiles of the mass accretion rate generally increase with radius. In NGC 628 and NGC 3184 the mass accretion rate increases in the inner 2 kpc and stays approximately constant at larger radii. The mass accretion rate is about constant Ṁ ∼ 0.1 M⊙ yr−1 in NGC 3627 and NGC 5055. In NGC 5194 the mass accretion rate is about Ṁ = 10−2 M⊙ yr−1 in the inner disk and increases to almost 10−1 M⊙ yr−1 at R = 5.5 kpc.
The resulting velocity dispersions are about 10 km s−1 in NGC 628, NGC 3184, NGC 3627, and NGC 5055. They are consistent with observations when available. In NGC 5194, σdisp ∼ 8 km s−1, significantly lower than the observed velocity dispersion of ∼15 km s−1. The high observed velocity dispersion could be due to noncircular motions induced by the gravitational interaction with NGC 5195. The strong increase in the model velocity dispersion at R = 7 kpc is not observed.
The CO conversion factors are fairly constant or increase slightly with radius. Whereas NGC 628 and NGC 3184 show a CO conversion factor about twice as high as the Galactic value, those of NGC 3627 and NGC 5055 are about Galactic. In NGC 5194 the CO conversion factor increases slightly from the Galactic value at R = 1 kpc to 1.5 times this value at R = 4 kpc. Like CO conversion factors, the HCN conversion factors are fairly constant or increase slightly with radius. The HCN conversion factor is close to the Gao & Solomon value in NGC 5055 and somewhat lower than the Gao & Solomon value in NGC 628, NGC 3184, and NGC 5194. The lowest HCN conversion factor is found in NGC 3627. All conversion factors, except the CO conversion factor in the outer disk of NGC 3184, are located within the observed ranges (3 ≤ αHCN ≤ 30 M⊙ pc2 (K km s−1)−1, Onus et al. 2018; 2 ≤ αHCN ≤ 10 M⊙ pc2 (K km s−1)−1, Bolatto et al. 2013). In four out of six EMPIRE galaxies the CO conversion factor exceeds the HCN conversion factor.
Whereas the radial profiles of the gas depletion timescale are relatively flat in all EMPIRE galaxies, those of the viscous timescales increase with radius. In all EMPIRE galaxies the viscous timescale exceeds the gas depletion timescale for R > 1 kpc.
For the rest of the massive galaxies (M* > 1010 M⊙), where no EMPIRE data are available, the model is able to fit the observational profiles in a satisfactory way. The  of NGC 2841, NGC 3198, and NGC 4736 are the lowest of all galaxies, with values below 30. With a value of 270, NGC 3521 shows the highest
  (including only
  of the whole galaxy sample. This is mainly due to an underestimation of the model CO(2−1) integrated line emission. Nevertheless, we consider that this is still an acceptable fit. The resulting radial profiles of Qgas and Ṁ are similar to those described above.
The model velocity dispersion profiles are approximately flat except for those of NGC 3521 and NGC 7331, where the velocity dispersion suddenly increases by ∼8 km s−1 in the outer disk. We think that this is a limitation of the model, which needs to significantly increase the value of Ṁ in the regions where the SFR changes from a molecular-gas-dominated regime to an atomic-gas-dominated one (i.e., where the CO flux becomes negligible compared to the HI flux) to fit the observational profiles satisfactorily (see Sect. 4.3.1). The viscous timescales are significantly higher than the gas depletion times in all galaxies. The CO conversion factors are approximately constant around one half and twice the Galactic value. Only NGC 3351 shows a CO conversion factor that exceeds twice the Galactic value.
For most of the low-mass galaxies (M* < 1010 M⊙) where no EMPIRE data are available, the  are considerably higher than those found for the high-mass galaxies, with values ranging from about 3000 for NGC 2976 to more than 7000 for NGC 925. For each of the low-mass galaxies, the fit of the CO(2−1) and SFR profiles becomes worse in the outer galactic disk. Whereas the molecular depletion times of the inner disks are similar to that commonly observed in star-forming spiral galaxies (Bigiel et al. 2008; Leroy et al. 2008), they are significantly higher in the outer disks of the low-mass galaxies, except for NGC 7793. The model cannot accommodate these high molecular depletion times, which leads to the high
  . We can only speculate that gas compression due to external accretion might be the cause of such a large amount of molecular gas in the outer disks of low-mass galaxies, which forms stars with a significantly lower efficiency than in the inner disk. A high Toomre parameter Qgas ∼ 8 is found in the inner disks of NGC 2403, NGC 2967, NGC 4214, and NGC 7793 decreasing to Qgas ∼ 1.5 − 2 in the outer disks. The observed infrared profiles of all low-mass galaxies are well reproduced by the model. In contrast to the high-mass galaxies, the radial profiles of the model gas velocity dispersion slightly decrease with radius. Where measured, the model profiles are consistent with the observed profiles. The viscous timescales exceed the gas depletion time in NGC 2403, NGC 2967, NGC 4214, and NGC 7793 beyond R ∼ 2 Rd, the radius within which half of the galaxy’s luminosity is contained. The CO conversion factors all increase with radius. In the outer disks they are significantly higher than the Galactic value.
4.3. General results
In this section we summarize and generalize the results obtained for all galaxies.
4.3.1. Toomre parameters Q, accretion rate  , and turbulent velocity dispersion vturb
The Toomre Q parameter can be interpreted as a stability criterion, where disks with Q < 1 are subject to fragmentation (see Eq. (A.18)). It can also be interpreted as a measure of the gas mass with respect to the maximum stable gas mass (Qgas = 1) for a given angular velocity and gas velocity dispersion. The radial profiles of the Toomre parameters Qgas generally decrease with radius (Fig. 3). We found Qgas > 5 in the central parts of six galactic disks. In the outer parts of the disks Qgas rarely exceeds Qgas = 3. An exception is NGC 2841, where Qgas > 4 in the entire gas disk. The total (gas and stars) Toomre parameter Qtot exceeds unity in the inner disk of a significant number of galaxies. Qtot is close to unity in the outer disks, except for NGC 628 and NGC 2841.
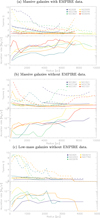 |
Fig. 3. Toomre parameter Q (solid: Qtot; dashed: Qgas) and mass accretion rate Ṁ of the high-mass galaxies with EMPIRE data (upper panel), high-mass galaxies without EMPIRE data (middle panel), and low-mass galaxies (lower panel; M* < 1010 M⊙). |
In all massive galaxies except NGC 3351, the mass accretion rate increases with radius from Ṁ ∼ 10−2 M⊙ yr−1 in the center to Ṁ ∼ 10−1 M⊙ yr−1 at the edge of the CO distribution (Fig. 3). Three low-mass galaxies show the opposite trend. In addition, NGC 925 and NGC 7793 have roughly constant mass accretion rates. Our mass accretion rates (∼0.1 M⊙ yr−1) are significantly lower than those derived by Schmidt et al. (2016), which can reach up to ∼1 M⊙ yr−1. They are consistent with the net mass accretion rates derived by Di Teodoro & Peek (2021): in their sample of 54 local spiral galaxies all galactic disks show some degree of radial gas flows, with radial velocities typically of a few km s−1, but these flows do not seem to have a preferential direction. As a consequence, the average radial velocity and mass flow rate across the sample at a given radius are nearly constant and close to zero.
The Toomre parameter Q and the accretion rate Ṁ are partially degenerate: an increase in either parameter leads to an increase in the turbulent velocity dispersion of the gas. In the massive galaxies, an increase in the accretion rate is accompanied by a decrease in the Toomre parameter, leading to a relatively constant velocity dispersion around the canonical value of vturb ∼ 10 km s−1 (Fig. 4). The velocity dispersions of the less massive galaxies decrease with radius. We need to take into account the finite lifetime of molecular clouds ( ) for the molecular gas fraction (Eq. (A.23)). Models without the finite lifetime systematically lead to radially increasing profiles of the gas velocity dispersion, which is contrary to observations. The slight increase in the velocity dispersion profiles close to the edge of the CO distribution can be explained by the difficulty of the model to fit regions with very low molecular gas surface densities in the outer galactic disks where the gas is dominated by the atomic phase. To fit the HI and SFR observational profiles, the accretion rate has to be significantly increased within the model, resulting in an increase in the velocity dispersion. However, this result is contrary to observations (Caldú-Primo et al. 2013; Ianjamasimanana et al. 2015). We observe the strongest discrepancy between our velocity dispersion profiles and the observed profiles for NGC 3521 and NGC 7331. In these galaxies, the velocity dispersion increases sharply at R ∼ 6 − 7 kpc.
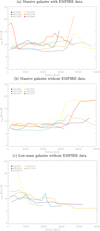 |
Fig. 4. Gas velocity dispersion profiles |
This behavior is caused by a change in the regime of energy injection. Whereas in the inner disk the energy injection by SNe dominates, the energy injection through accretion (Eq. (A.5)) is comparable to that of SNe in the outer disks of NGC 3521, and NGC 7331. Indeed, model calculations without the additional term of energy injection due to accretion show no sudden increase in the gas velocity dispersion in the outer disk (dashed lines in the middle panel of Fig. 4). The sudden increase in the velocity dispersion can also be avoided by a decrease in the gravitational potential of the galactic disk. This can be achieved by a local increase in the stellar velocity dispersion by a factor of two compared to our best fit models. Since NGC 7331 already needs an increase in the stellar velocity dispersion to fit the available data, a further increase might not be realistic. Alternatively, it is expected that an increase in the metallicity in the outer disk also leads to a decrease in the gas velocity dispersion. However, this would flatten the metallicity gradient of these galaxies, which is not consistent with the observed metallicity gradient (Moustakas et al. 2010). As a third possibility the star-formation timescale might be increased in the outer disk (Vollmer & Leroy 2011). These authors replaced the local free-fall time by the molecule formation time as the relevant timescale for star formation in the outer galactic disk. All these modifications increase the molecular gas depletion time.
We compared the profiles of the Toomre parameter Q and the mass accretion rate Ṁ of the model with the values presented by Vollmer & Leroy (2011) where the gas velocity dispersion was included in the χ2 calculations and the radial profile of Q was given as input and Ṁ was constant for the entire disk. In addition, Vollmer & Leroy (2011) assumed a Galactic CO conversion factor. The mass accretion rate was determined by the total SFR of the galactic disks. In particular, our model of NGC 5194 led to a significantly better fit to the available observations than the Vollmer & Leroy (2011) model.
The models of 6 out of 17 galaxies have mass accretion rates that are more than three times lower than those of the Vollmer & Leroy (2011) model for the following reasons: in NGC 5055, NGC 4736, and NGC 7331 Vollmer & Leroy (2011) used the observed HI velocity dispersions of Tamburro et al. (2009), which are more than 5 km s−1 higher than those obtained by our model. Given that the observed velocity dispersions are upper limits because of the beam smearing of noncircular motions, we are confident that our model yields more realistic mass accretion rates for these galaxies. NGC 3351 shows a particularly low mass accretion rate. Whereas our model preferred Qgas ∼ 2.5, Vollmer & Leroy (2011) set Q = 8. Again, our gas velocity dispersion is significantly smaller than that of Vollmer & Leroy (2011). The same observation is true for NGC 925 and NGC 2976. We conclude that Qgas, Ṁ, and thus σdisp might have been overestimated by Vollmer & Leroy (2011).
4.3.2. Ionization rate ζCR
Without any source of ionization, the network of reactions responsible for the great richness of the ISM cannot be initiated. The dominant mechanism responsible for the ionization of molecules in dense clouds is cosmic ray ionization. The cosmic ray ionization rate ζCR was estimated by many studies, resulting in a range from more than 10−16 s−1 for diffuse regions to a few 10−18 s−1 for the densest gas clouds (e.g., Spitzer & Tomasko 1968; van Dishoeck & Black 1986; Indriolo et al. 2007). Indriolo & McCall (2012) investigated the value of ζCR in diffuse regions and found that the rate varies around an average value of ζCR = 3 × 10⁻¹⁶ s−1. Within dense molecular clouds, the cosmic ray ionization rates cover a range of about two orders of magnitude (10−18 − 10−16 s−1) and are subject to considerable uncertainties (Padovani et al. 2009). Dalgarno (2006) suggested that ζCR = 10−17 s−1 corresponds to the lower limit of the ionization rate in dense regions. In our model ζCR is mainly determined by the HCO+ abundance. In addition, a decrease in ζCR leads to a slight decrease in the CO emission and a slight variation of the HCN line emission. The model HCO+-to-CO emission ratio is approximately proportional to ζCR. NGC 628 shows the lowest HCO+-to-CO ratio. The comparison of the best-fit models for NGC 628 with the different values of ζCR is presented in Fig. 5. We found that only the model using an ionization rate of ζCR = 10−18 s−1 is able to reproduce the observed HCO+-to-CO and HCN-to-HCO+ ratio. This value is at the lower end of the range given by Padovani et al. (2009).
 |
Fig. 5. NGC 628: best-fit models of HCN and HCO+ integrated line emission with different cosmic ray ionization rates ζCR. |
For all galaxies included in the EMPIRE survey, we varied the value of ζCR to determine the CR ionization rate that provides the best fit to the observed emission line profiles. The  for the different ionization rates ζCR = 10−17, 3 × 10⁻¹⁸ and, 10−18 s−1 are presented in Table 6. For most galaxies, a cosmic ray ionization rate smaller than ζCR = 10−17 s−1 is needed.
4.3.3. Molecular line emission as a function of density
Star formation occurs in the densest regions of the ISM, within GMCs. In general, the SFR correlates with the available amount of molecular gas, whose main tracer is CO emission (Schmidt 1959). CO emission traces gas with densities n ≳ 100 cm−3. Gas of higher densities can be detected in the HCN and HCO+ lines (e.g., Gao & Solomon 2004). Gao & Solomon (2004) defined the dense gas fraction as the ratio between the gas mass with densities n(H2)> 3 × 104 cm−3 and the total gas mass. They found a linear relationship between the infrared and HCN luminosities, which they interpreted as a linear relation between the SFR and the dense gas mass. Mangum & Shirley (2015) and Kauffmann et al. (2017) questioned the hypothesis that HCN is mainly emitted by dense gas. Based on observations of the Orion A cloud, they found that HCN is already emitted from regions with a density of approximately n(H2)∼103 cm−3. For the calculations of the HCN-to-dense gas model conversion factor, we use the definition of the dense gas fraction of Gao & Solomon (2004). To investigate at which densities most of the HCN is emitted, we show the brightness temperatures as a function of gas density for the CO(2−1), HCN(1−0) and HCO+(1−0) lines at three galactic radii for the EMPIRE galaxies in Fig. 6. The dependence of the brightness temperatures on galactic radius is weak. The model CO brightness temperatures of the different galaxies are quite uniform. The CO brightness temperature reaches the typical sensitivity of ALMA observation of ∼0.1 K at densities between 20 and 30 cm−3. Likewise, the HCN and HCO+ brightness temperatures are homogeneous except for NGC 3627, which shows higher HCN brightness temperatures for densities 500 ≲ n ≲ 1000 cm−3 at R = 2 Rd and 100 ≲ n ≲ 1000 cm−3 at R = 3 Rd.
 |
Fig. 6. CO(2−1), HCN(1−0), and HCO+(1−0) brightness temperature as a function of gas density. From left to right, the panels correspond to one to three times the characteristic length scale of the stellar disk Rd. |
In the model, the CO(2−1) brightness temperature reaches its maximum at a few 100 cm−3. The CO brightness temperature exceed 1 K for densities higher than ∼102 cm−3, those of HCN and HCO+ at densities higher than ∼103 cm−3. The HCN brightness temperature increases for density from 102 to 103 cm−3 and then stays constant at about 1 K. The HCO+ gradually increases from 102 to 104 cm−3.
We used the brightness temperatures to calculate the integrated line emission using Eq. (A.29). The resulting integrated line emission as a function of density is presented in Fig. 7. The peak of the integrated line emission around n ∼ 103 cm−3 occurs close to the transition between the diffuse and self-gravitating gas in our analytical model. The additional factor of 0.6 (Appendix A.2.1) decreases the integrated line emission of self-gravitating clouds. In the inner part of the galaxy (R ∼ Rd, the disk scale length) the CO line emission mostly originates in diffuse (i.e., non-self-gravitating) gas of density n < 103 cm−3. A non-negligible fraction of the HCN and HCO+ emission originates from gas at these densities as well.
 |
Fig. 7. CO(2−1), HCN(1−0), and HCO+(1−0) integrated line intensity as a function of gas density. From left to right, panels correspond to one to three times the characteristic length scale of the disk Rd. |
By integrating the line intensities of Fig. 7, we determined the density at which half of the line flux is emitted (Table 7). At R = Rd, we found average values of n(1/2) ∼ 200 − 500 cm−3 for CO(2−1), n(1/2) ∼ 1000 − 3000 cm−3 for HCN(1−0), and about n(1/2) ∼ 1000 − 3000 cm−3 for HCO+. None but one of the mid-flux densities significantly changes with radius by more than a factor of three. The HCN and HCO+ mid-flux density thresholds are low compared to the thresholds usually assumed in the literature in dense gas clouds 3 × 104 cm−3; (Gao & Solomon 2004). These high densities are based on assumed HCN and HCO+ brightness temperature of about 30 K (Gao & Solomon 2004). Leroy et al. (2017) found that lognormal gas distributions with low mean densities and small widths generate most of their HCN emission from low densities ≲103 − 104 cm−3. If a power law tail is added to the distribution most HCN is emitted by gas with densities exceeding 104 cm−3. Onus et al. (2018) calculated the HCN emission from simulated dense, star-forming cores and found that HCN emission traces gas with a luminosity-weighted mean number density of ∼104 cm−3. Based on 100 pc resolution observations of NGC 3627, Bešlić et al. (2021) found that HCN and HCO+ to CO(2−1) line ratios show greater scatter than 13CO and C18O to CO(2−1) line ratios, which might suggest that they trace densities above the mean molecular gas density. On the other hand, Liszt & Pety (2016) showed that the HCN and HCO+ lines can be excited and detected in diffuse gas because the emission brightness at the limit of detectability is independent of the critical density and varies only as the n(H)−N(HCN) product.
Density thresholds where 50% of the total flux is emitted, in cm−3.
We also computed the fractional integrated line intensity for n > 103, 103.5, 104, and 104.5 cm−3 (Table C.1). A significant fraction of the HCN (25 − 30%) and HCO+ (15 − 20%) emission stems from gas with densities exceeding n = 104 cm−3. Pety et al. (2017) studied the ratio of the molecular line fluxes originating from the dense gas within the Orion B GMC. Based on 0.04 pc resolution observations within a field of view of 5.6 × 7.5 pc, they found that the fraction of the total flux emitted from the densest regions with n > 7.3 × 103 cm−3 corresponds to 8% for the CO, 18% for the HCN, and 16% for the HCO+. Since the mean density nH2 ∼ 400 cm−3 (Pety et al. 2017) of the Orion B cloud is comparable to the density of self-gravitating clouds in our model, the comparison of their flux fractions to the corresponding model flux fractions is relevant for the HCN and HCO+ emission. We calculated the flux ratios based on the model profiles with the same density thresholds. The results are presented in Table 8. There is little variation of the flux ratios at the three different galactic radii. Our CO and HCO+ flux ratios at R = 3 × Rd (roughly solar radius) are comparable to the values given by Pety et al. (2017) whereas our HCN flux ratio is about 50% higher than the ratio found by these authors. Within our model the flux fraction depends on the probability density distribution of the gas density and the brightness temperature of the molecular lines, which in turn depends on the gas dispersion velocity, density, molecular gas surface density, and temperature. A sizable fraction of the model CO emission is produced by dense, non-self-gravitating gas at larger scales than those of GMCs. It is somewhat surprising that the CO flux fraction within a GMC, as Orion B, is comparable to our model CO flux fraction.
Percentage of total flux originating from dense clouds (n > 7.3 × 103 cm−3; Pety et al. 2017).
4.3.4. Conversion factors
In most galaxies the radial profiles of the CO conversion factor increase monotonically with radius (Fig. 8). The conversion factors range between half and twice the Galactic value in most of the galaxies. Notable exceptions are NGC 3351 and the outer disks of NGC 2976 and NGC 4214 where the CO conversion factors are higher than twice the Galactic value. Our CO conversion factors are about 50% higher than those found by Sandstrom et al. (2013) (Table 9). There is a big discrepancy for NGC 4736 where our CO weighted conversion factor is five times higher than that of Sandstrom et al. (2013). Likewise, our model CO conversion factor in the inner kpc of NGC 3351 is about a factor of five higher than that of Teng et al. (2022) based on 100 pc resolution 12CO, 13CO, and C18O observations and assuming a CO abundance of 3 × 10⁻⁴. A lower CO abundance caused by a low metallicity, as suggested by Díaz et al. (2007), decreases the difference between the Teng et al. (2022) and our conversion factors.
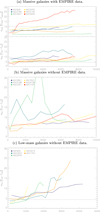 |
Fig. 8. CO-to-H2 (αCO) and HCN-to-dense gas (αHCN) conversion factors of the high-mass galaxies with EMPIRE data (upper panel), high-mass galaxies without EMPIRE data (middle panel), and low-mass galaxies (lower panel; M* < 1010 M⊙). Dense gas corresponds to n > 3 × 104 cm−3. |
CO-weighted conversion factors.
The models suggest that the conversion factors are slightly sub-Galactic in the center and exceed the Galactic value by up to a factor of two at the edge of the CO-emitting disk. For the HCN-to-dense gas conversion factor, the model yields values between half and twice the Gao & Solomon value. As for αCO, the radial profiles tend to increase slightly from the galaxy center to the edge of the molecular disk.
4.3.5. Gas depletion and viscous timescales
The radial profiles of the gas depletion and viscous timescale are presented in Fig. 9. For all massive galaxies, except NGC 628, the viscous timescales exceed the depletion timescales for R > Rd by a factor of about ten. For NGC 628, tvis is particularly small in the inner 2.5 kpc, and close to the gas depletion timescale of 2 − 3 Gyr.
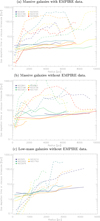 |
Fig. 9. Gas depletion (solid lines) and viscous timescale (dashed lines) of the high-mass galaxies with EMPIRE data (upper panel), high-mass galaxies without EMPIRE data (middle panel), and low-mass galaxies (lower panel; M* < 1010 M⊙). |
For the low-mass galaxies, with M* < 1010 M⊙, the model yields tvis ≤ tdep up to R ∼ 2 Rd for NGC 4214, NGC 2403, and NGC 7793 and up to R ∼ Rd for NGC 2976. This suggests that for low-mass galaxies, star formation can be maintained by radial gas accretion within the disk from the center to R ∼ 2 Rd (see also Vollmer & Leroy 2011). On the other hand, for massive galaxies (M* > 1010 M⊙) external gas accretion is needed to supply star formation with fresh gas, especially in the inner disk region. In the absence of external gas accretion, the gas surface density of the inner disk will significantly decrease within a few gigayears, leading to a high Qgas and to a Qtot exceeding unity (see Sect. 4.3.1). Condensation of halo gas on galactic fountains (e.g., Fraternali 2017) might be an important source of gas accretion onto the inner galactic disk.
5. Discussion
5.1. Low cosmic ray ionization rates ζCR
As discussed in Sect. 4.3.2, our model requires particularly low ionization rates to reproduce the observed HCO+ radial profiles. Our initial assumption of ζCR = 10−17 s−1 corresponds already to the lower limit suggested by Dalgarno (2006). In general, lower cosmic ray ionization rates are derived in gas of higher densities (Padovani et al. 2009; Neufeld & Wolfire 2017). For four out of six EMPIRE galaxies (NGC 628, NGC 3184, NGC 5055, and NGC 5194) the lowest cosmic ray ionization rate of ζCR = 10−18 s−1 is required. The first two galaxies have particularly low gas surface densities below 20 M⊙ pc−2. We can only speculate that these galaxies have a low magnetic field strength and a significant fraction of the ionizing cosmic ray particles escape from the galactic gas disk in the vertical direction. Energy equipartition between the cosmic ray particles and the magnetic field is commonly assumed in spiral galaxies (e.g., Beck & Krause 2005). Cosmic ray particles and magnetic fields are supposed to be strongly coupled and to exchange energy until equilibrium is reached. A lower magnetic field can thus confine fewer cosmic ray particles.
5.2. The CO conversion factor of NGC 6946
Bigiel et al. (2020) estimated the αCO conversion factor based on [CII] and CO radial profiles of NGC 6946 using the Accurso et al. (2017) model. They obtained an increasing trend for αCO with galactocentric radius, in broad agreement with the metallicity gradient. This behavior is consistent with prior observational works based on a combination of HI, CO, and infrared data involving the GDR (e.g., Sodroski et al. 1995; Braine et al. 1997; Sandstrom et al. 2013). Our radial profile of αCO has approximately the same shape as that of Bigiel et al. (2020) but is about a factor of two higher. Sandstrom et al. (2013) determined the CO conversion factor via
simultaneously solving for αCO and the GDR by assuming that the GDR is approximately constant on kiloparsec scales. With our inferred GDR of ∼200 for NGC 6946 (see Table 5), the CO conversion factor of Sandstrom et al. (2013) would increase to a value close to the Galactic conversion factor. We conclude that our radial profile of the CO conversion factor is consistent within a factor of two with that of Sandstrom et al. (2013) and independent of the GDR.
5.3. The effects of CO photodissociation in low-mass galaxies
In an externally irradiated gas cloud, a significant H2 mass may lie outside the CO region, which is dark in CO in the outer regions of the cloud where the gas phase carbon resides in C or C+. In this region, H2 self-shields or is shielded by dust from UV photodissociation, whereas CO is photo-dissociated. Following Wolfire et al. (2010), the dark gas mass fraction for a cloud of constant density is
with
and AV = 2 (Z/Z⊙)Ncl/(1.9 × 1021 cm−2), where Ncl is the H2 column density. The mass fraction of CO-emitting gas is then
We tested the influence of the CO photodissociation on the observed CO brightness temperature for the low-mass galaxies where the effect is expected to be important (Fig. 10). In these galaxies we detected no significant effect. This is consistent with the fact that most of these galaxies are relatively CO-bright, meaning that CO emission is detected beyond R ∼ 2 Rd. Even in the CO-dim galaxy NGC 7793 CO photodissociation only leads to a decrease in the CO emission by ∼50% in the inner disk and by a factor of about two in the outer disk. This translates into an increase in the CO flux by a factor of 1.7 in the absence of CO photodissociation.
 |
Fig. 10. Influence of the CO photo-dissociation in low-mass galaxies. Upper panels: integrated CO line intensity as a function of density for the four low-mass galaxies. Dotted lines indicate with photodissociation CO and solid lines without. Lower panels: mass fraction of CO-emitting gas as a function of density in the presence of CO photodissociation (Eq. (9)). |
5.4. Anomalous gas in NGC 2403
Vollmer & Leroy (2011) suggested that only low-mass galaxies (M* < 1010 M⊙) can sustain their SFR through radial gas accretion within the galactic disk. Within the framework of our model, this is only possible within R ∼ 2 Rd (Sect. 4.3.5 and Fig. 9). In order to sustain star formation through radial gas accretion within the thin gas disk, the gas mass has to be transported in a different way from large radii to R ∼ 2 Rd. In NGC 2403, Fraternali et al. (2002a) found a faint extended and kinematically anomalous gas component. The cold HI disk is surrounded by a thick and clumpy HI layer characterized by slow rotation and infall motion (10−20 km s−1) toward the center. The gas surface density of the anomalous component is about 1 M⊙ pc−2. The mass accretion rate is given by
where ν is the gas viscosity (Eq. (A.9)) and vR the radial velocity (see also Fraternali et al. 2002b). This is exactly the radial mass accretion rate found by our model at R ∼ 2 Rd (Fig. B.13). Therefore, we suggest that the fuel for star formation reaches this radius from outside via a thick disk component. From R ∼ 2 Rd inward the gas is transported radially through turbulent gas viscosity, fully sustaining star formation. We can only speculate that a comparable mechanism acts in the other low-mass galaxies in our sample.
6. Conclusions
The Vollmer et al. (2017) model of a turbulent clumpy gas accretion disk was used to calculate the SFR, HI, CO(1−0), CO(2−1), HCN(1−0), and HCN+ radial profiles of a sample of 17 nearby spiral galaxies observed by the THINGS and HERACLES surveys. A subsample of six galaxies was observed by the EMPIRE survey. The large-scale properties of the model are the gas surface density, density, disk height, turbulent driving length scale, velocity dispersion, gas viscosity, volume filling factor, and molecular fraction. Small-scale properties are the mass, size, and density of clouds, the associated timescales (the crossing, the free-fall and the H2 formation timescales) of the most massive self-gravitating gas clouds. These quantities depend on the stellar surface density, the angular velocity Ω, the disk radius R, and three free parameters, which are the Toomre parameter Q of the gas, the mass accretion rate Ṁ, and the ratio δ between the driving length scale of turbulence and the cloud size. In addition, Galactic scaling laws for the dependence of the gas density and velocity dispersion on the cloud size were included in the model. The gas temperature was calculated through the equilibrium between turbulent mechanical heating and molecular line cooling. The molecular abundances were determined via NAUTILUS (Hersant et al. 2009) and the molecular line emission via RADEX (van der Tak et al. 2007).
For different values of δ we determined the free parameters Q and Ṁ at each galactic radius using three independent measurements: the neutral gas (HI), molecular gas (CO), and SFR (FUV + 24 μm). We did not consider gas disks that are unstable to fragmentation (Q < 1). The model also yields the far-infrared radial profiles, which can be directly compared to Herschel data as a validation of our SFR recipe based on FUV and 24 μm data. Furthermore, we determined the cosmic ray ionization rate by comparing the model HCN and HCO+(1−0) emission to EMPIRE observations (Jiménez-Donaire et al. 2019).
Based on the model fitting of the radial profiles of the total SFR, HI, CO, HCN, and HCO+, we conclude that:
The Toomre parameter Qtot exceeds unity in the inner disk of a significant number of galaxies (Fig. 3). In two galaxies, Qtot also exceeds unity in the outer disk. Thus, in spirals galaxies Qtot = 1 is not ubiquitous.
The finite lifetime of molecular clouds (
 ) has to be taken into account for the molecular gas fraction (Sect. 4.3.1).
The model gas velocity dispersions are consistent with the observed HI velocity dispersions (Fig. 4).
In all but one of the six galaxies observed by the EMPIRE survey, the model cosmic ray ionization rate is found to be significantly smaller than ζCR = 10−17 s−1 (Table 6). For four out of six galaxies, we find ζCR = 10−18 s−1.
Within our model, HCN and HCO+ are already detectable in relatively low-density gas (∼1000 cm−3; Fig. 7). The model HCN(1–0) and HCO+(1–0) line emission traces densities of several 103 cm−3 (Table 7).
The derived CO conversion factor of most of the massive galaxies (M* > 1010 M⊙) is close to the Galactic value and increases slightly with galactic radius (Fig. 8).
In low-mass galaxies (M* < 1010 M⊙) the CO conversion factor can increase steeply with radius (Fig. 8).
The CO-dark gas mass is not relevant in the CO-bright low-mass galaxies (Fig. 10). In the CO-dim galaxy NGC 7793, the inclusion of CO photodissociation leads to CO emission that is lower by ∼50% in the inner disk and ∼200% in the outer disk.
The derived HCN conversion factors are consistent within a factor of two with the αHCN = 10 M⊙ pc−2 (K km s−1)−1 from Gao & Solomon (2004) and increase with galactic radius (Fig. 8).
In all galaxies the molecular gas depletion timescale ranges between 1 and 5 Gyr (Fig. 9).
In almost all massive galaxies the viscous timescale greatly exceeds the star-formation timescale (Fig. 9). In the absence of gas accretion from the galactic halo, the galaxies will undergo starvation (Larson et al. 1980), where the cold gas is exhausted by the star-formation activity of the galaxy. This naturally leads to Qtot > 1.
In the low-mass galaxies the viscous timescale is smaller than the star-formation timescale for R ≲ 2 Rd. Thus, the SFR can be sustained by radial mass inflow within the galactic disk within R ∼ 2 Rd (Fig. 9).
We suggest that the fuel for star formation reaches R ∼ 2 Rd from the outskirts of the galaxy via a thick gas disk component as in NGC 2403 (Sect. 5.4).
The combination of the large-scale model of a turbulent clumpy star-forming galactic gas disk together with a local scaling relation based on Galactic observations is thus able to simultaneously reproduce SFR, infrared, HI, CO, HCN, and HCO+ radial profiles of local spiral galaxies. The resulting gas velocity dispersions and CO and HCN conversion factors are in agreement with those found in the literature. As a potential next step, the model can be applied to high-resolution observations of ULIRGs and high-z star-forming galaxies.
Acknowledgments
We would like to thank Adam Leroy for his comments, which helped to improve the article and J. den Brok for making the PHANGS CO(2−1) radial profiles of NGC 3627 and NGC 5194 available to us. We also thank the anonymous referee for their useful comments, which helped to significantly improve the article.
References
- Accurso, G., Saintonge, A., Catinella, B., et al. 2017, MNRAS, 470, 4750 [NASA ADS] [Google Scholar]
- Battisti, A. J., & Heyer, M. H. 2014, ApJ, 780, 173 [Google Scholar]
- Beck, R., & Krause, M. 2005, Astron. Nachr., 326, 414 [Google Scholar]
- Berg, D. A., Pogge, R. W., Skillman, E. D., et al. 2020, ApJ, 893, 96 [NASA ADS] [CrossRef] [Google Scholar]
- Bešlić, I., Barnes, A. T., Bigiel, F., et al. 2021, MNRAS, 506, 963 [CrossRef] [Google Scholar]
- Bigiel, F., Leroy, A., Walter, F., et al. 2008, AJ, 136, 2846 [NASA ADS] [CrossRef] [Google Scholar]
- Bigiel, F., Leroy, A., & Walter, F. 2011, in Computational Star Formation, eds. J. Alves, B. G. Elmegreen, J. M. Girart, & V. Trimble, 270, 327 [NASA ADS] [Google Scholar]
- Bigiel, F., de Looze, I., Krabbe, A., et al. 2020, ApJ, 903, 30 [CrossRef] [Google Scholar]
- Boissier, S., Prantzos, N., Boselli, A., & Gavazzi, G. 2003, MNRAS, 346, 1215 [NASA ADS] [CrossRef] [Google Scholar]
- Bolatto, A. D., Wolfire, M., & Leroy, A. K. 2013, ARA&A, 51, 207 [CrossRef] [Google Scholar]
- Braine, J., Guelin, M., Dumke, M., et al. 1997, A&A, 326, 963 [NASA ADS] [Google Scholar]
- Caldú-Primo, A., Schruba, A., Walter, F., et al. 2013, AJ, 146, 150 [CrossRef] [Google Scholar]
- da Cunha, E., Groves, B., Walter, F., et al. 2013, ApJ, 766, 13 [Google Scholar]
- Dale, D. A., Aniano, G., Engelbracht, C. W., et al. 2012, ApJ, 745, 95 [NASA ADS] [CrossRef] [Google Scholar]
- Dalgarno, A. 2006, Proc. Natl. Acad. Sci., 103, 12269 [NASA ADS] [CrossRef] [Google Scholar]
- den Brok, J. S., Chatzigiannakis, D., Bigiel, F., et al. 2021, MNRAS, 504, 3221 [NASA ADS] [CrossRef] [Google Scholar]
- Díaz, Á. I., Terlevich, E., Castellanos, M., & Hägele, G. F. 2007, MNRAS, 382, 251 [CrossRef] [Google Scholar]
- Di Teodoro, E. M., & Peek, J. E. G. 2021, ApJ, 923, 220 [NASA ADS] [CrossRef] [Google Scholar]
- Draine, B. T., & Bertoldi, F. 1996, ApJ, 468, 269 [Google Scholar]
- Draine, B. T., & Li, A. 2007, ApJ, 657, 810 [CrossRef] [Google Scholar]
- Dumouchel, F., Faure, A., & Lique, F. 2010, MNRAS, 406, 2488 [NASA ADS] [CrossRef] [Google Scholar]
- Ellison, S. L., Lin, L., Thorp, M. D., et al. 2021, MNRAS, 501, 4777 [NASA ADS] [CrossRef] [Google Scholar]
- Elmegreen, B. G. 1989, ApJ, 338, 178 [NASA ADS] [CrossRef] [Google Scholar]
- Elmegreen, B. G., & Scalo, J. 2004, ARA&A, 42, 211 [Google Scholar]
- Flower, D. R. 1999, MNRAS, 305, 651 [Google Scholar]
- Fraternali, F. 2017, in Gas Accretion onto Galaxies, eds. A. Fox, & R. Davé, Astrophys. Space Sci. Lib., 430, 323 [NASA ADS] [CrossRef] [Google Scholar]
- Fraternali, F., van Moorsel, G., Sancisi, R., & Oosterloo, T. 2002a, AJ, 123, 3124 [CrossRef] [Google Scholar]
- Fraternali, F., Cappi, M., Sancisi, R., & Oosterloo, T. 2002b, ApJ, 578, 109 [NASA ADS] [CrossRef] [Google Scholar]
- Gao, Y., & Solomon, P. M. 2004, ApJ, 606, 271 [NASA ADS] [CrossRef] [Google Scholar]
- Gil de Paz, A., Boissier, S., Madore, B. F., et al. 2007, ApJS, 173, 185 [Google Scholar]
- Goldsmith, P. F. 2001, ApJ, 557, 736 [Google Scholar]
- Gordon, K. D., Roman-Duval, J., Bot, C., et al. 2014, ApJ, 797, 85 [NASA ADS] [CrossRef] [Google Scholar]
- Green, S., & Thaddeus, P. 1976, ApJ, 205, 766 [NASA ADS] [CrossRef] [Google Scholar]
- Heiderman, A., Evans, N. J., II, Allen, L. E., Huard, T., & Heyer, M. 2010, ApJ, 723, 1019 [Google Scholar]
- Hersant, F., Wakelam, V., Dutrey, A., Guilloteau, S., & Herbst, E. 2009, A&A, 493, L49 [NASA ADS] [CrossRef] [EDP Sciences] [Google Scholar]
- Heyer, M., Krawczyk, C., Duval, J., & Jackson, J. M. 2009, ApJ, 699, 1092 [Google Scholar]
- Hollenbach, D. J., & Tielens, A. G. G. M. 1997, ARA&A, 35, 179 [NASA ADS] [CrossRef] [Google Scholar]
- Hunt, L. K., Draine, B. T., Bianchi, S., et al. 2015, A&A, 576, A33 [NASA ADS] [CrossRef] [EDP Sciences] [Google Scholar]
- Ianjamasimanana, R., de Blok, W. J. G., Walter, F., et al. 2015, AJ, 150, 47 [NASA ADS] [CrossRef] [Google Scholar]
- Indriolo, N., & McCall, B. J. 2012, ApJ, 745, 91 [NASA ADS] [CrossRef] [Google Scholar]
- Indriolo, N., Geballe, T. R., Oka, T., & McCall, B. J. 2007, ApJ, 671, 1736 [NASA ADS] [CrossRef] [Google Scholar]
- Jiménez-Donaire, M. J., Bigiel, F., Leroy, A. K., et al. 2019, ApJ, 880, 127 [CrossRef] [Google Scholar]
- Kauffmann, J., Goldsmith, P. F., Melnick, G., et al. 2017, A&A, 605, L5 [NASA ADS] [CrossRef] [EDP Sciences] [Google Scholar]
- Kennicutt, R. C., Jr. 1998a, ApJ, 498, 541 [Google Scholar]
- Kennicutt, R. C., Jr. 1998b, ARA&A, 36, 189 [Google Scholar]
- Kennicutt, R. C., Jr., Armus, L., Bendo, G., et al. 2003, PASP, 115, 928 [NASA ADS] [CrossRef] [Google Scholar]
- Kreckel, K., Ho, I. T., Blanc, G. A., et al. 2019, ApJ, 887, 80 [NASA ADS] [CrossRef] [Google Scholar]
- Kregel, M., van der Kruit, P. C., de Blok, W. J. G., & Freeman, K. C. 2002, in Disks of Galaxies: Kinematics, Dynamics and Peturbations, eds. E. Athanassoula, A. Bosma, & R. Mujica, ASP Conf. Ser., 275, 47 [NASA ADS] [Google Scholar]
- Kruijssen, J. M. D., & Longmore, S. N. 2014, MNRAS, 439, 3239 [NASA ADS] [CrossRef] [Google Scholar]
- Krumholz, M. R., & Burkhart, B. 2016, MNRAS, 458, 1671 [NASA ADS] [CrossRef] [Google Scholar]
- Krumholz, M. R., McKee, C. F., & Tumlinson, J. 2008, ApJ, 689, 865 [NASA ADS] [CrossRef] [Google Scholar]
- Krumholz, M. R., McKee, C. F., & Tumlinson, J. 2009, ApJ, 693, 216 [NASA ADS] [CrossRef] [Google Scholar]
- Krumholz, M. R., Dekel, A., & McKee, C. F. 2012, ApJ, 745, 69 [Google Scholar]
- Larson, R. B. 1979, MNRAS, 186, 479 [NASA ADS] [CrossRef] [Google Scholar]
- Larson, R. B. 1981, MNRAS, 194, 809 [Google Scholar]
- Larson, R. B., Tinsley, B. M., & Caldwell, C. N. 1980, ApJ, 237, 692 [Google Scholar]
- Leroy, A. K., Walter, F., Brinks, E., et al. 2008, AJ, 136, 2782 [Google Scholar]
- Leroy, A. K., Walter, F., Bigiel, F., et al. 2009, AJ, 137, 4670 [Google Scholar]
- Leroy, A. K., Usero, A., Schruba, A., et al. 2017, ApJ, 835, 217 [NASA ADS] [CrossRef] [Google Scholar]
- Leroy, A. K., Hughes, A., Liu, D., et al. 2021, ApJS, 255, 19 [NASA ADS] [CrossRef] [Google Scholar]
- Li, A., & Draine, B. T. 2001, ApJ, 554, 778 [Google Scholar]
- Licquia, T. C., & Newman, J. A. 2015, ApJ, 806, 96 [NASA ADS] [CrossRef] [Google Scholar]
- Liszt, H. S., & Pety, J. 2016, ApJ, 823, 124 [NASA ADS] [CrossRef] [Google Scholar]
- Lizée, T., Vollmer, B., Braine, J., & Nehlig, F. 2021, A&A, 645, A111 [NASA ADS] [CrossRef] [EDP Sciences] [Google Scholar]
- Lombardi, M., Alves, J., & Lada, C. J. 2010, A&A, 519, L7 [NASA ADS] [CrossRef] [EDP Sciences] [Google Scholar]
- Mac Low, M.-M., & Klessen, R. S. 2004, Rev. Mod. Phys., 76, 125 [Google Scholar]
- Mangum, J. G., & Shirley, Y. L. 2015, PASP, 127, 266 [Google Scholar]
- Moustakas, J., Kennicutt, R. C., Jr., Tremonti, C. A., et al. 2010, ApJS, 190, 233 [Google Scholar]
- Neufeld, D. A., & Wolfire, M. G. 2017, ApJ, 845, 163 [Google Scholar]
- Onus, A., Krumholz, M. R., & Federrath, C. 2018, MNRAS, 479, 1702 [NASA ADS] [CrossRef] [Google Scholar]
- Padoan, P., Nordlund, A., & Jones, B. J. T. 1997, MNRAS, 288, 145 [NASA ADS] [CrossRef] [Google Scholar]
- Padovani, M., Galli, D., & Glassgold, A. E. 2009, A&A, 501, 619 [NASA ADS] [CrossRef] [EDP Sciences] [Google Scholar]
- Pety, J., Guzmán, V. V., Orkisz, J. H., et al. 2017, A&A, 599, A98 [NASA ADS] [CrossRef] [EDP Sciences] [Google Scholar]
- Quiroga, R. J. 1983, Ap&SS, 93, 37 [NASA ADS] [CrossRef] [Google Scholar]
- Retes-Romero, R., Mayya, Y. D., Luna, A., & Carrasco, L. 2017, ApJ, 839, 113 [NASA ADS] [CrossRef] [Google Scholar]
- Rozwadowska, K., Vissani, F., & Cappellaro, E. 2021, New Astron., 83, 101498 [NASA ADS] [CrossRef] [Google Scholar]
- Sandstrom, K. M., Leroy, A. K., Walter, F., et al. 2013, ApJ, 777, 5 [Google Scholar]
- Schinnerer, E., Hughes, A., Leroy, A., et al. 2019, ApJ, 887, 49 [NASA ADS] [CrossRef] [Google Scholar]
- Schmidt, M. 1959, ApJ, 129, 243 [NASA ADS] [CrossRef] [Google Scholar]
- Schmidt, T. M., Bigiel, F., Klessen, R. S., & de Blok, W. J. G. 2016, MNRAS, 457, 2642 [NASA ADS] [CrossRef] [Google Scholar]
- Schoeier, F. L., van der Tak, F. F. S., van Dishoeck, E. F., & Black, J. H. 2005, VizieR Online Data Catalog: J/A+A/432/369 [Google Scholar]
- Sodroski, T. J., Odegard, N., Dwek, E., et al. 1995, ApJ, 452, 262 [Google Scholar]
- Solomon, P. M., Rivolo, A. R., Barrett, J., & Yahil, A. 1987, ApJ, 319, 730 [Google Scholar]
- Spitzer, L., Jr., & Tomasko, M. G. 1968, ApJ, 152, 971 [NASA ADS] [CrossRef] [Google Scholar]
- Stanghellini, L., Magrini, L., & Casasola, V. 2015, ApJ, 812, 39 [NASA ADS] [CrossRef] [Google Scholar]
- Tamburro, D., Rix, H. W., Leroy, A. K., et al. 2009, AJ, 137, 4424 [Google Scholar]
- Teng, Y.-H., Sandstrom, K. M., Sun, J., et al. 2022, ApJ, 925, 72 [NASA ADS] [CrossRef] [Google Scholar]
- Thornton, K., Gaudlitz, M., Janka, H. T., & Steinmetz, M. 1998, ApJ, 500, 95 [CrossRef] [Google Scholar]
- Toomre, A. 1964, ApJ, 139, 1217 [Google Scholar]
- Utomo, D., Sun, J., Leroy, A. K., et al. 2018, ApJ, 861, L18 [NASA ADS] [CrossRef] [Google Scholar]
- van der Tak, F. F. S., Black, J. H., Schöier, F. L., Jansen, D. J., & van Dishoeck, E. F. 2007, A&A, 468, 627 [NASA ADS] [CrossRef] [EDP Sciences] [Google Scholar]
- van Dishoeck, E. F., & Black, J. H. 1986, ApJS, 62, 109 [Google Scholar]
- Vollmer, B., & Beckert, T. 2003, A&A, 404, 21 [NASA ADS] [CrossRef] [EDP Sciences] [Google Scholar]
- Vollmer, B., & Leroy, A. K. 2011, AJ, 141, 24 [Google Scholar]
- Vollmer, B., Gratier, P., Braine, J., & Bot, C. 2017, A&A, 602, A51 [NASA ADS] [CrossRef] [EDP Sciences] [Google Scholar]
- Vollmer, B., Fossati, M., Boselli, A., et al. 2021, A&A, 645, A121 [EDP Sciences] [Google Scholar]
- Walter, F., Brinks, E., de Blok, W. J. G., et al. 2008, AJ, 136, 2563 [Google Scholar]
- Weingartner, J. C., & Draine, B. T. 2001, ApJ, 548, 296 [Google Scholar]
- Wolfire, M. G., McKee, C. F., Hollenbach, D., & Tielens, A. G. G. M. 2003, ApJ, 587, 278 [Google Scholar]
- Wolfire, M. G., Hollenbach, D., & McKee, C. F. 2010, ApJ, 716, 1191 [Google Scholar]
- Wu, J., Evans, N. J., II, Shirley, Y. L., & Knez, C. 2010, ApJS, 188, 313 [NASA ADS] [CrossRef] [Google Scholar]
- Yang, B., Stancil, P. C., Balakrishnan, N., & Forrey, R. C. 2010, ApJ, 718, 1062 [Google Scholar]
- Zubko, V., Dwek, E., & Arendt, R. G. 2004, ApJS, 152, 211 [NASA ADS] [CrossRef] [Google Scholar]
Appendix A: Detailed description of the model
The analytical model of a turbulent clumpy star-forming galactic disk has a large-scale and a small-scale part.
A.1. Large-scale part
In this subsection we describe in detail the physics that govern the large-scale part of the model.
A.1.1. Hydrostatic equilibrium
Within the model the ISM is considered as a single turbulent gas in vertical hydrostatic equilibrium. The turbulent pressure is defined as  , where σdisp is the total velocity dispersion that takes into account both, the velocity dispersion caused by turbulence vturb and a constant thermal velocity vtherm = cs = 6 km s−1 such as
  . Following Elmegreen (1989), we can establish the first main equation of the model:
where ρ is the midplane density, Σ is the total gas surface density, Σ⋆ is the stellar surface density,  is the vertical stellar velocity dispersion, and γ is a fudge factor. Given the stellar surface density and the stellar length scale of the disk l⋆, the vertical stellar velocity dispersion can be computed following Kregel et al. (2002):
A.1.2. Energy transfer by turbulence
In galaxies ISM turbulence is mainly maintained by stellar feedback such as SN explosions, ionizing radiation, or stellar winds (Mac Low & Klessen 2004; Elmegreen & Scalo 2004). Within the framework of our model we consider SN explosions as the dominant source of energy. Turbulence is expected to form eddies with a typical size ldriv (the turbulent driving length scale) at the origin of the formation of the densest gas clouds. The SNe energy is cascaded from the largest to the smallest scales. The energy per unit time, which is carried by turbulence, is
where ν is the viscosity of the gas defined as ν = vturb, 3Dldriv with the 3D turbulent velocity dispersion  . If we define the surface density of the gas as Σ = ρH and assume the integration over the volume ∫dV = V = AH, we can connect the energy input into the ISM by SNe directly to the SFR with the assumption of a constant initial mass function as
where  is the energy injected by the SN explosions, ΔA is the unit area, and
  is the SFR. The factor ξ relates the energy injection by SN explosions to the SFR. It is considered as constant and its canonical value was estimated from observations in the Milky Way, given ξ = 4.6 × 10⁻⁸ pc2/yr2 (Vollmer & Beckert 2003). In the presence of high disk mass accretion rates, the energy injection through the gain of potential energy can be important. In this case, Eq. A.4 becomes
where Ṁ is the mass accretion rate and Ω is the angular velocity.
A.1.3. Viscosity and accretion
The model is based on the assumption that turbulence redistributes the angular momentum within the disk via gas viscosity. The galactic gas disk is treated as a turbulent clumpy accretion disk, where angular momentum is transported outward, permitting the gas to move inward. Assuming a continuous and nonzero external gas mass accretion  , the simplified time evolution of the disk surface density is given by
The mass accretion rate within the disk is
With the approximation ∂/∂R ∼ R and vrot = ΩR, one obtains
where the viscosity of the gas ν is defined as
Contrary to Vollmer & Leroy (2011), where it was assumed that  and thus ∂Ω/∂t = 0, and Ṁ = cte, the mass accretion derived from the observational radial profiles varies with radius. We are mostly interested in the viscous timescale tvis ∼ R2/ν (see Sect. 4.1).
A.1.4. Self-gravitating clouds and star-formation
The clumpiness of the model gas disk implies that the density of a single gas cloud ρcl depends directly on the average density of the disk ρ. In the model, these two quantities are linked by the volume filling factor ϕv, such that  . Following Vollmer & Leroy (2011) and Vollmer et al. (2021), the SFR per unit volume is given by
For self-gravitating clouds with a virial parameter of unity, the turbulent crossing time tturb, cl equals twice the free-fall time tturb, cl (Vollmer et al. 2021):
where lcl and vturb, cl are the size and the turbulent 3D velocity dispersion of a single gas cloud, respectively. Following Larson’s law (Larson 1981), we can simplify the expression of the turbulent crossing time:
where δ is the scaling between the driving length scale and the size of the largest self-gravitating structures, such as δ = ldriv/lcl. All these considerations lead us to the second expression of the SFR in the model:
and  . This SFR recipe is close to the prescription suggested by Krumholz et al. (2012):
where ϵff is the star-formation efficiency per free-fall time. The relevant size scale for the density entering tff is that corresponding to the outer scale of the turbulence that regulates the SFR, which corresponds to ldriv in our model. For a consistency check we directly compared the two SFR prescriptions and found that both have comparable slopes and normalizations (Fig. A.1).
 |
Fig. A.1. Star-formation rate per unit area as a function of galactic radius. Upper panel: Massive galaxies with EMPIRE data. Middle panel: Massive galaxies without EMPIRE data. Lower panel: Low-mass galaxies. Solid lines show our model SFR prescription (Eq. A.10) and dashed lines Krumholz et al. 2012 SFR prescription (Eq. A.14). |
We calculated the star-formation efficiency per free-fall time by injecting our model SFR into Eq. A.14 for each galaxy and found ⟨ϵff⟩=0.8% for our sample, which is consistent with the values measured by Utomo et al. (2018) and Jiménez-Donaire et al. (2019).
A.1.5. Metallicity
One of the main assumptions of the model is that molecular clouds are relatively short-lived, appearing and disappearing in a cloud crossing time. They might not reach chemical equilibrium within their lifetime, which is about the free-fall time. We defined the characteristic time of H2 formation as
where α is the constant of molecule formation that depends on the gas metallicity and temperature (Draine & Bertoldi 1996). The metallicity of the model is estimated using a leaky box model with an effective yield based on the gas fraction
where α0 = 3.6 × 10⁷ yr M⊙ pc−3. The relation between the metallicity and the constant of molecule formation is the following:
where α⊙ = 2.2 × 10⁷ yr M⊙ pc−3 (Hollenbach & Tielens 1997). The metallicity can be linked to the effective yield yeff defined as yeff = Z/ln(1/fgas), where fgas is the gas fraction. Vollmer & Leroy (2011) showed that these metallicities are consistent with those measured by Moustakas et al. (2010).
A.1.6. Gas fragmentation and Toomre parameter Q
One of the main parameters of the model is the Toomre parameter Q (Toomre 1964). It describes the stability of the gas disk regarding radial gas fragmentation:
where κ is the epicyclic frequency,
The Toomre Q parameter is also used as a measure of the gas content of the disk, with Q = 1 for the maximum disk gas mass.
A.2. Small-scale part
In this subsection the physics that govern the small-scale part of the model are described. This involves scaling relations for the density and velocity dispersion of the gas clouds.
A.2.1. Mass fraction
The small-scale part is divided into two distinct subscales, non-self-gravitating and self-gravitating gas clouds of density ρcl. For each density, the mass fraction of the gas is determined by a lognormal probability distribution function (Padoan et al. 1997):
where x = ρcl/ρ is the overdensity and the standard deviation σ is determined by the Mach number ℳ:
The mass fraction of gas with overdensities exceeding x is thus defined as
Based on the results of Battisti & Heyer (2014), who found that the fraction of the GMC mass residing within regions with densities higher than n ∼ 103 cm−3 is about 10%, and following Pety et al. (2017), the mass fraction of self-gravitating cloud was decreased by a constant factor of 0.6. The inclusion of this factor was necessary to fit the observed integrated CO, HCN and HCO+ line fluxes (Vollmer et al. 2017).
A.2.2. ISM scaling relations
We assumed different scaling relations for the two density regimes: (i) for non-self-gravitating clouds, we adopted the scaling relations found for galactic HI by Quiroga (1983): ρcl ∝ l−2, vturb, cl ∝ l1/3, and thus vturb, cl = vturb(ρcl/ρ)−1/6, where vturb and ρ are the turbulent velocity and the density of the disk, respectively. Since the minimum density considered in this work is ∼100 cm−2, the maximum turbulent velocity of diffuse clouds is ∼vturb/2 ∼ 5 km s−1. (ii) For self-gravitating clouds, we adopt the scaling relations of Lombardi et al. (2010): ρcl ∝ l−1.4, vturb, cl ∝ l1/2. As described in Sect. A.1.4, the scale of the largest self-gravitating clouds lcl is smaller than the turbulent driving length scale ldriv by a factor δ = ldriv/lcl. We assume that the turbulent velocity dispersion of the largest self-gravitating clouds of density ρsg is  , where vturb is the velocity dispersion of the disk. Furthermore, we assume ρcl ∝ l−1 and
  (Solomon et al. 1987).
A.2.3. Molecule abundances from chemical network
For the determination of the H2 column density of a gas cloud, we take into account (i) the photodissociation of H2 molecules and (ii) the influence of the finite cloud lifetime on the H2 formation. For the photodissociation of H2 molecules, we follow the approach of Krumholz et al. (2008) and Krumholz et al. (2009). In a second step, we take into account the molecular fraction due to the finite lifetime of the gas cloud,
If the H2 formation timescale tmol is longer than the free-fall timescale, the gas cloud will be mainly atomic during its lifetime. The inclusion of the cloud lifetime decreases the molecular gas surface density and thus the CO emission in the outer disks. The best fit to the CO data then leads to a lower Q and/or Ṁ resulting in a lower gas velocity dispersion compared to the model without the inclusion of the cloud lifetime. The total molecular fraction of a cloud is  . The molecular fraction due to the finite lifetime
  has the highest influence on fmol at large galactic radii.
The abundances of the different molecules are determined using the gas-grain code NAUTILUS presented in Hersant et al. (2009). This code computes the abundances of chemical species as a function of time by solving the rate equations for a network of reactions. The input parameters are the crossing time, density, gas temperature, UV flux, cosmic ray ionization rate, and the initial elemental abundances of the model gas clouds. We assume a UV flux that is proportional to the large-scale SFR and a constant cosmic ray ionization rate. The gas temperature of the clouds is calculated by the equilibrium between gas heating and cooling (Sect. A.2.4).
A.2.4. Heating and cooling mechanisms
Gas heating is provided via two distinct mechanisms: (i) turbulent mechanical heating and (ii) radiation heating via cosmic rays ionization. The main mechanisms for gas cooling are CO and H2 line emission.
The thermal balance of gas and dust is determined by gas-dust collisions in the model. To determine this balance, we simultaneously solved the following equations:
and
where Λd is the dust cooling rate, Λg corresponds to the molecular line cooling, Γd is the radiative heating of dust grains, Γg the heating via turbulence and cosmic rays, and Λgd the dust cooling energy transfer between dust and gas due to collisions.
A.2.5. Brightness temperatures and molecular line emission
The molecular line emission is computed using the brightness temperature formalism. The difference in brightness temperature between on- and off- positions is given by
where τ is the optical depth of the line, ν the frequency of the observations, h and h the Planck and Boltzmann constants, and Tex and Tbg the excitation and background brightness temperatures.
For simplicity only a single collider (H2) is considered. The excitation temperature is
where T* = hνul/k, n is the gas density, nqul the collisional de-excitation rate, and Aul the Einstein coefficients of the transition ul. The background brightness temperature Tbg is the sum of the effective emission temperatures of the galaxy’s dust Teff dust and the cosmic background at the galaxy redshift TCMB (see Eq. (17) of da Cunha et al. 2013). For optically thin transitions, the ratio of the radiative and collisional rates is the ratio of the density to the critical density for a given transition:
We consider two-level molecular systems, in which the level populations are determined by a balance of collisions with H2, spontaneous decay and line photon absorption, and stimulated emission with τ > 1. The molecular abundances were calculated by NAUTILUS (see Sect. A.2.3). For simplicity, we neglected the hyperfine structure of HCN.
The rotation constants, Einstein coefficients, and collision rates were taken from the Leiden Atomic and Molecular DAtabase (LAMDA; Schoeier et al. 2005). The CO collision rates were provided by Yang et al. (2010). The HCN collision rates were taken from the He–HCN rate coefficients calculated by Dumouchel et al. (2010), scaled by a factor of 1.36 to go to HCN–H2 (see Green & Thaddeus 1976). The HCO+ collision rates were taken from Flower (1999).
We compared the brightness temperatures obtained by our approximate recipe to those calculated with the statistical equilibrium radiative transfer code RADEX from van der Tak et al. (2007). RADEX is a 1D nonlocal thermodynamic equilibrium radiative transfer code that uses the escape probability formulation assuming an isothermal and homogeneous medium without large-scale velocity fields. We systematically specify when the results presented were obtained using RADEX.
The integrated line emission, in K km s−1, is computed using the following expression:
where  is the brightness temperature, ϕA is the surface filling factor,
  is the mass fraction as defined in Eq. A.22, and vturb, cl is the turbulent velocity of the cloud at a given density. The factor 2.35 links the turbulent velocity to the linewidth. CO photodissociation is taken into account following Wolfire et al. (2010).
A.2.6. Interstellar radiation field and cosmic ray ionization
The stellar radiation field is set by the SFR (Sect. 2.4) and stellar mass radial profiles Σ*:
where F0 = 5.3 × 10⁻³ ergs cm−2 s−1 (Goldsmith 2001). The constant cosmic ray ionization rate is constrained by the observed HCO+(1–0) emission. In practice, we calculated models with different ionization rates and chose the value that yielded the best fit to the HCO+(1–0) radial profile.
A.2.7. Thermal dust emission
The dust temperature Td of a gas cloud of a given density and size illuminated by a local mean radiation field is calculated by solving Eq. A.25. With the dust mass absorption coefficient of κ(λ)=κ0(λ0/λ)β, the dust optical depth is
where Σcl is the cloud surface density in g/cm2. We used κ0(250 μm)=4.8 cm2 g−1 (Li & Draine 2001; Dale et al. 2012) and β = 1.5. The absorption coefficient at 160 μm is κ0(160 μm)=9.4 cm2 g−1. This value is consistent with but at the lower end of the range found in the literature κ0(160 μm)=10 − 15 cm2 g−1 (Weingartner & Draine 2001; Zubko et al. 2004; Draine & Li 2007; Gordon et al. 2014).
The infrared emission at a given wavelength at a given galactic radius R is calculated in the following way:
where B(λ, Td) is the Planck function and ΦA = 1.5 (ΔM/M) (Σ/Σcl) the area filling factor. The factor 1.5 takes into account that the mean cloud surface density is 1.5 times lower than the surface density in the cloud center Σcl = ρcllcl.
Appendix B: Best-fit models
The model and observed HI, SFR, and molecular line and infrared emission radial profiles are presented in the upper part of each figure for the different galaxies of our sample. The model parameters and derived physical quantities are shown in the lower parts of the figures.
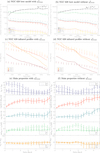 |
Fig. B.1. NGC 628 best-fit models, infrared profiles, and radial profiles of main physical quantities. See Figs. 1 and 2 for explanations. |
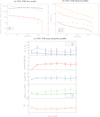 |
Fig. B.10. Same as Fig. B.1 but for NGC 4736. |
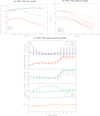 |
Fig. B.11. Same as Fig. B.1 but for NGC 7331. |
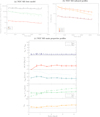 |
Fig. B.12. Same as Fig. B.1 but for NGC 925. |
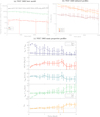 |
Fig. B.13. Same as Fig. B.1 but for NGC 2403. |
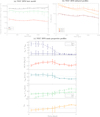 |
Fig. B.14. Same as Fig. B.1 but for NGC 2976. |
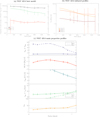 |
Fig. B.15. Same as Fig. B.1 but for NGC 4214. |
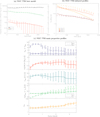 |
Fig. B.16. Same as Fig. B.1 but for NGC 7793. |
Appendix C: Emission from dense gas
The fractions of total flux emitted by gas with densities higher than n = 103, 103.5, 104, and 104.5 cm−3 are presented in Table C.1.
Fraction of the total flux.
All Tables
Determination of the HCN and HCO+ best-fit models for different cosmic ray ionization rates ζCR.
Percentage of total flux originating from dense clouds (n > 7.3 × 103 cm−3; Pety et al. 2017).
All Figures
 |
Fig. 1. NGC 6946. Errors bars correspond to the observations. Solid lines correspond the median results of the best-fit models and thin gray lines to the best-fit models. The values of the secondary parameters for these best-fit models are given in the lower-left corner of the middle panels. (a) Best-fit model including |
| In the text | |
 |
Fig. 2. NGC 6946: radial profiles of the main physical quantities with and without |
| In the text | |
 |
Fig. 3. Toomre parameter Q (solid: Qtot; dashed: Qgas) and mass accretion rate Ṁ of the high-mass galaxies with EMPIRE data (upper panel), high-mass galaxies without EMPIRE data (middle panel), and low-mass galaxies (lower panel; M* < 1010 M⊙). |
| In the text | |
 |
Fig. 4. Gas velocity dispersion profiles |
| In the text | |
 |
Fig. 5. NGC 628: best-fit models of HCN and HCO+ integrated line emission with different cosmic ray ionization rates ζCR. |
| In the text | |
 |
Fig. 6. CO(2−1), HCN(1−0), and HCO+(1−0) brightness temperature as a function of gas density. From left to right, the panels correspond to one to three times the characteristic length scale of the stellar disk Rd. |
| In the text | |
 |
Fig. 7. CO(2−1), HCN(1−0), and HCO+(1−0) integrated line intensity as a function of gas density. From left to right, panels correspond to one to three times the characteristic length scale of the disk Rd. |
| In the text | |
 |
Fig. 8. CO-to-H2 (αCO) and HCN-to-dense gas (αHCN) conversion factors of the high-mass galaxies with EMPIRE data (upper panel), high-mass galaxies without EMPIRE data (middle panel), and low-mass galaxies (lower panel; M* < 1010 M⊙). Dense gas corresponds to n > 3 × 104 cm−3. |
| In the text | |
 |
Fig. 9. Gas depletion (solid lines) and viscous timescale (dashed lines) of the high-mass galaxies with EMPIRE data (upper panel), high-mass galaxies without EMPIRE data (middle panel), and low-mass galaxies (lower panel; M* < 1010 M⊙). |
| In the text | |
 |
Fig. 10. Influence of the CO photo-dissociation in low-mass galaxies. Upper panels: integrated CO line intensity as a function of density for the four low-mass galaxies. Dotted lines indicate with photodissociation CO and solid lines without. Lower panels: mass fraction of CO-emitting gas as a function of density in the presence of CO photodissociation (Eq. (9)). |
| In the text | |
 |
Fig. A.1. Star-formation rate per unit area as a function of galactic radius. Upper panel: Massive galaxies with EMPIRE data. Middle panel: Massive galaxies without EMPIRE data. Lower panel: Low-mass galaxies. Solid lines show our model SFR prescription (Eq. A.10) and dashed lines Krumholz et al. 2012 SFR prescription (Eq. A.14). |
| In the text | |
 |
Fig. B.1. NGC 628 best-fit models, infrared profiles, and radial profiles of main physical quantities. See Figs. 1 and 2 for explanations. |
| In the text | |
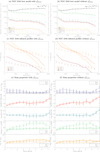 |
Fig. B.2. Same as Fig. B.1 but for NGC 3184. |
| In the text | |
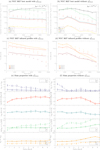 |
Fig. B.3. Same as Fig. B.1 but for NGC 3627. |
| In the text | |
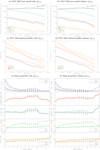 |
Fig. B.4. Same as Fig. B.1 but for NGC 5055. |
| In the text | |
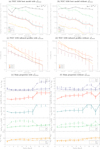 |
Fig. B.5. Same as Fig. B.1 but for NGC 5194. |
| In the text | |
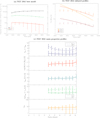 |
Fig. B.6. Same as Fig. B.1 but for NGC 2841. |
| In the text | |
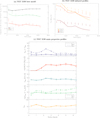 |
Fig. B.7. Same as Fig. B.1 but for NGC 3198. |
| In the text | |
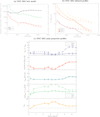 |
Fig. B.8. Same as Fig. B.1 but for NGC 3351. |
| In the text | |
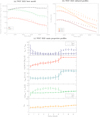 |
Fig. B.9. Same as Fig. B.1 but for NGC 3521. |
| In the text | |
 |
Fig. B.10. Same as Fig. B.1 but for NGC 4736. |
| In the text | |
 |
Fig. B.11. Same as Fig. B.1 but for NGC 7331. |
| In the text | |
 |
Fig. B.12. Same as Fig. B.1 but for NGC 925. |
| In the text | |
 |
Fig. B.13. Same as Fig. B.1 but for NGC 2403. |
| In the text | |
 |
Fig. B.14. Same as Fig. B.1 but for NGC 2976. |
| In the text | |
 |
Fig. B.15. Same as Fig. B.1 but for NGC 4214. |
| In the text | |
 |
Fig. B.16. Same as Fig. B.1 but for NGC 7793. |
| In the text | |
Current usage metrics show cumulative count of Article Views (full-text article views including HTML views, PDF and ePub downloads, according to the available data) and Abstracts Views on Vision4Press platform.
Data correspond to usage on the plateform after 2015. The current usage metrics is available 48-96 hours after online publication and is updated daily on week days.
Initial download of the metrics may take a while.


