Open Access
Fig. 7.
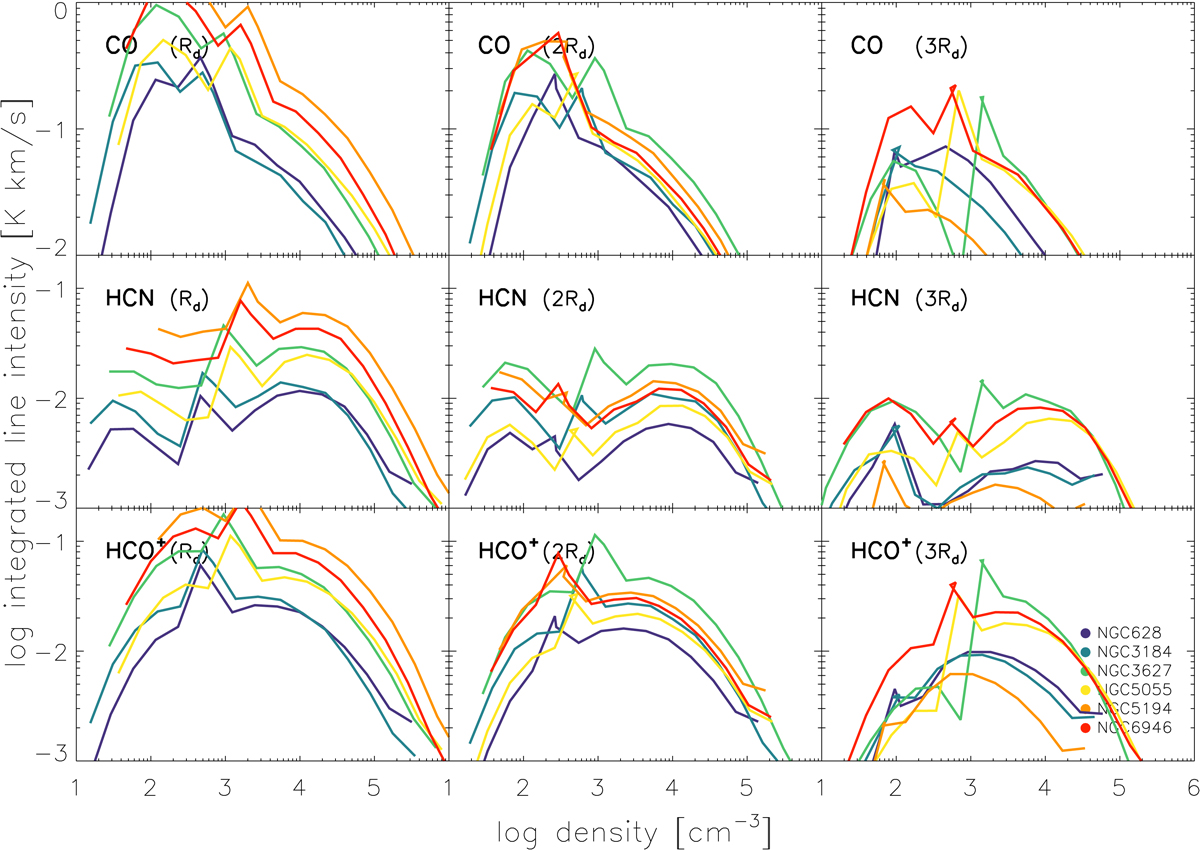
Download original image
CO(2−1), HCN(1−0), and HCO+(1−0) integrated line intensity as a function of gas density. From left to right, panels correspond to one to three times the characteristic length scale of the disk Rd.
Current usage metrics show cumulative count of Article Views (full-text article views including HTML views, PDF and ePub downloads, according to the available data) and Abstracts Views on Vision4Press platform.
Data correspond to usage on the plateform after 2015. The current usage metrics is available 48-96 hours after online publication and is updated daily on week days.
Initial download of the metrics may take a while.