Fig. 1.
Download original image
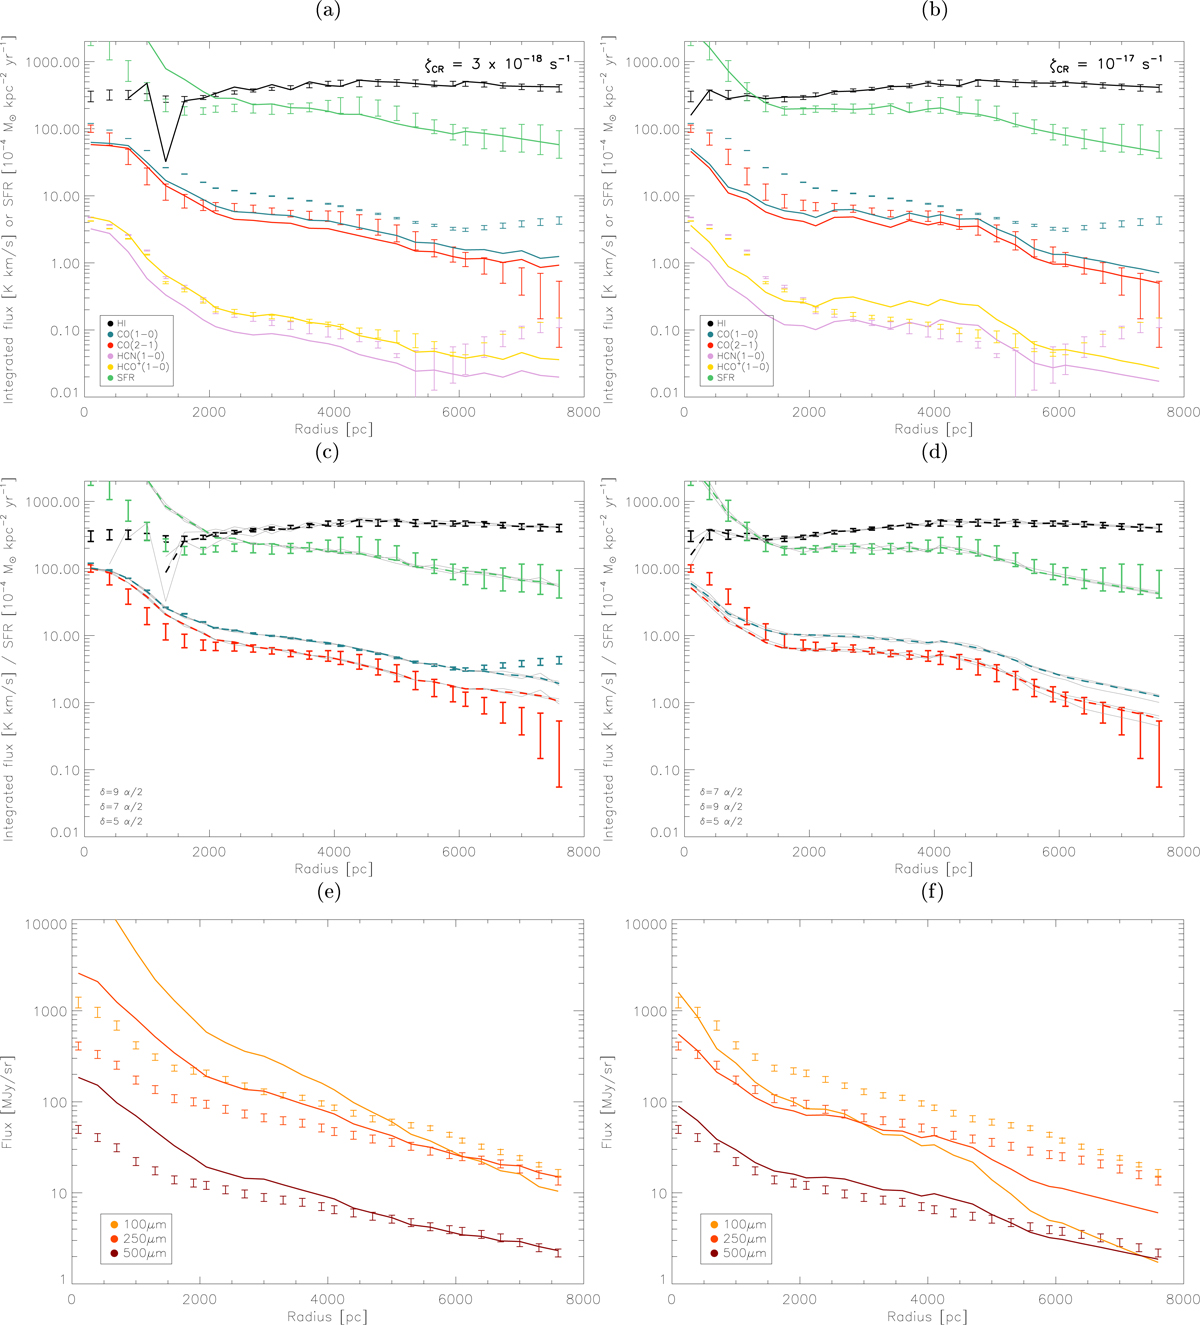
NGC 6946. Errors bars correspond to the observations. Solid lines correspond the median results of the best-fit models and thin gray lines to the best-fit models. The values of the secondary parameters for these best-fit models are given in the lower-left corner of the middle panels. (a) Best-fit model including ![]() using RADEX. (b) Best-fit model without
using RADEX. (b) Best-fit model without ![]() using RADEX. (c) Best-fit models including
using RADEX. (c) Best-fit models including ![]() . (d) Best-fit models without
. (d) Best-fit models without ![]() . (e) Infrared profiles of the best-fit model including
. (e) Infrared profiles of the best-fit model including ![]() . (f) Infrared profiles of the best-fit model without
. (f) Infrared profiles of the best-fit model without ![]() . The cosmic ray ionization rate ζCR is given for each model in the upper panels.
. The cosmic ray ionization rate ζCR is given for each model in the upper panels.
Current usage metrics show cumulative count of Article Views (full-text article views including HTML views, PDF and ePub downloads, according to the available data) and Abstracts Views on Vision4Press platform.
Data correspond to usage on the plateform after 2015. The current usage metrics is available 48-96 hours after online publication and is updated daily on week days.
Initial download of the metrics may take a while.