Open Access
Fig. A.1.
Download original image
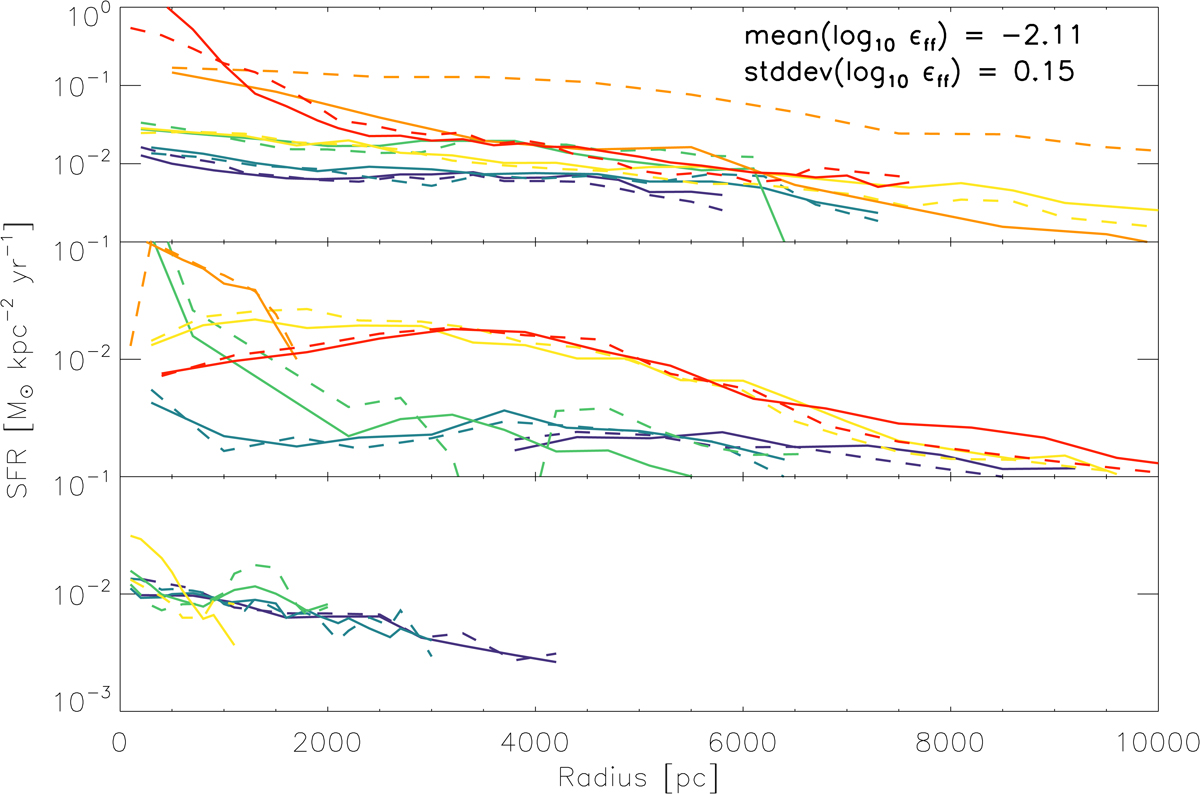
Star-formation rate per unit area as a function of galactic radius. Upper panel: Massive galaxies with EMPIRE data. Middle panel: Massive galaxies without EMPIRE data. Lower panel: Low-mass galaxies. Solid lines show our model SFR prescription (Eq. A.10) and dashed lines Krumholz et al. 2012 SFR prescription (Eq. A.14).
Current usage metrics show cumulative count of Article Views (full-text article views including HTML views, PDF and ePub downloads, according to the available data) and Abstracts Views on Vision4Press platform.
Data correspond to usage on the plateform after 2015. The current usage metrics is available 48-96 hours after online publication and is updated daily on week days.
Initial download of the metrics may take a while.