| Issue |
A&A
Volume 663, July 2022
|
|
|---|---|---|
| Article Number | A26 | |
| Number of page(s) | 17 | |
| Section | Stellar structure and evolution | |
| DOI | https://doi.org/10.1051/0004-6361/202141849 | |
| Published online | 08 July 2022 | |
The origin of close massive binaries in the M17 star-forming region
1
Institute of Astronomy, KU Leuven, Celestijnenlaan 200D, 3001 Leuven, Belgium
e-mail: This email address is being protected from spambots. You need JavaScript enabled to view it.
2
European Southern Observatory (ESO), Alonso de Cordova 3107, Vitacura, Santiago, Chile
3
European Southern Observatory (ESO), Karl-Schwarzschild-Str. 2, Garching, Germany
4
Max Planck Institute for Astronomy, Königstuhl 17, 69117 Heidelberg, Germany
Received:
22
July
2021
Accepted:
24
February
2022
Abstract
Context. Spectroscopic multiplicity surveys of O stars in young clusters and OB associations have revealed that a large portion (∼70%) of these massive stars (Mi > 15 M⊙) belong to close and short-period binaries (with a physical separation of less than a few astronomical units). Follow-up VLT(I) high-angular-resolution observations led to the detection of wider companions (up to d ∼ 500 au), increasing the average companion fraction to > 2. Despite the recent and significant progress, the formation mechanisms leading to such close massive multiple systems remain to be elucidated. As a result, young massive close binaries (or higher-order multiple systems) are unique laboratories for determining the pairing mechanism of high-mass stars.
Aims. We present the first VLTI/GRAVITY observations of six young O stars in the M17 star-forming region (≲1 Myr) and two additional foreground stars. VLTI/GRAVITY provides the K-band high-angular-resolution observations needed to explore the close environment of young O-type stars, and, as such, offers an excellent opportunity to characterise the multiplicity properties of the immediate outcome of the massive star formation process.
Methods. From the interferometric model fitting of visibility amplitudes and closure phases, we search for companions and measure their positions and flux ratios. Combining the resulting magnitude difference with atmosphere models and evolutionary tracks, we further constrain the masses of the individual components.
Results. All six high-mass stars are in multiple systems, leading to a multiplicity fraction of 100% and yielding a 68% confidence interval of 94–100%. We detect a total of nine companions with separations of up to 120 au. Including previously identified spectroscopic companions, the companion fraction of the young O stars in our sample reaches 2.3 ± 0.6. The derived masses span a wide range, from 2.5 to 50 M⊙, with a great tendency towards high-mass companions. However, we do not find a significant correlation between the mass of the companions and their separation.
Conclusions. While based on a modest sample, our results clearly indicate that the origin of the high degree of multiplicity is rooted in the star formation mechanism of the sample stars. No clear evidence for one of the competing concepts of massive star formation (core accretion or competitive accretion) could be found. However, given that we find all of the companions within ∼120 au, our results are compatible with migration as a scenario for the formation of close massive binaries.
Key words: stars: massive / stars: early-type / binaries: close / stars: formation / techniques: interferometric
© ESO 2022
1. Introduction
From their births to their explosive deaths, massive stars (those with initial masses higher than 8 M⊙) are known to play a key role in our Universe. As the main producers of alpha elements and through their strong stellar winds and dramatic end-of-life explosions, they heat and enrich the interstellar medium, increasing the metallicity of the primordial gas and driving the chemical evolution of their host galaxy (Bromm et al. 2009).
The evolution of massive stars strongly depends on their multiplicity properties at birth (Langer 2012). Observationally, it is established that at least 90% of massive stars are found within a binary or higher-order multiple system (de Wit et al. 2005; Sana et al. 2014). Most of them have at least one companion with an orbital period of the order of two months or shorter, which is close enough for the two stars to interact during their lifetime (Sana et al. 2012, 2013). These interactions are efficiently detected by spectroscopy through the periodic Doppler shifts of their spectral lines. Such interactions are of paramount importance as they dramatically impact the evolution of the stars involved.
Thus far, multiplicity surveys have been dedicated to fully formed stars drawn from massive star populations with estimated ages of typically 2–8 Myr. Such stars do not necessarily reflect the primordial binary properties. To date, two main surveys targeting the multiplicity of pre-main-sequence (PMS) stars have been conducted. Pomohaci et al. (2019) surveyed 32 massive young stellar objects (MYSOs) with the Nasmyth Adaptive Optics System (NACO)/Very Large Telescope (VLT), probing for wide binary companions (> 600 au). They reported that 31±8% of the surveyed MYSOs belong to multiple systems, with mass ratios exceeding 0.5. They also claim that under basic considerations, MYSOs might have a multiplicity fraction close to 100%. More recently, Koumpia et al. (2021) reported a binary fraction of 17–25% at 2–300 au scales, among a population of six MYSOs observed with the Very Large Telescope Interferometer (VLTI; GRAVITY and AMBER). Single-object studies also contribute to this growing number of exciting results: Kraus et al. (2017) outlined the discovery of a high-mass protobinary system (20 + 18 M⊙, d ∼ 170 au), with each star surrounded by a circumstellar accretion disk and a circumbinary disk. Zhang et al. (2019) recently published the results of a similar object: a massive protobinary with an apparent separation of 180 ± 11 au and a mass of about 18 M⊙ residing at the centre of the IRAS 07299-1651 star-forming region is fed by two circumstellar disks around each protostar. Such results raise the question of high-mass star formation and multiplicity properties at birth.
Unlike the case for low- and intermediate-mass stars, a definitive observational sequence for massive star formation is yet to be obtained. From the theoretical point of view, several formation scenarios have been proposed, such as formation through stellar collisions and merging (Bonnell et al. 1998), competitive accretion (Bonnell et al. 2001; Bonnell & Bate 2006), fragmentation-induced starvation (Peters et al. 2010), and monolithic collapse (McKee & Tan 2003; Krumholz et al. 2009). Except for the merger process, the scenarios share the need for dense and massive accretion disks to overcome the radiation pressure barrier. Such disks are prone to gravitational instabilities (Kratter et al. 2010), leading to predictions of companions at much larger separations than typically observed among massive spectroscopic binaries. Circumstellar disk sizes are of great interest for spotting the formation of potential companions in the neighbourhood of the central star. Over the past decade an increasing number of disks have been detected around high-mass protostars, for which estimations of the inner (from tens to hundreds of astronomical units; Kraus et al. 2010, 2017; Frost et al. 2021) and outer radii (hundreds to thousands of astronomical units; Johnston et al. 2015; Beltrán & de Wit 2016) have been derived.
Testing different formation mechanisms of MYSO binaries requires observing them during or just after the formation process. Massive stars spend a significant part of their adolescence hidden within their dusty cocoon and gas clouds. While embedded in their envelope (resulting in a large extinction), some critical but short-lived evolutionary processes are difficult to observe (Zinnecker & Yorke 2007; Tan et al. 2014; Motte et al. 2018). Combined with the rarity of such objects, obtaining high quality observational constraints remains challenging.
The giant H II region M17, also known as the Omega Nebula, is one of the youngest (≲1 MyrHanson et al. 1997), closest (∼1.7 kpc, Kuhn et al. 2019), and most luminous (L = 3.6 × 10⁶ L⊙, Povich et al. 2007) H IIregions in the Milky Way. In a previous spectroscopic study that probed the multiplicity of the youngest stars in the superbubble, Ramírez-Tannus et al. (2017) showed that the observed radial velocity (RV) dispersion in M17 is very low (σRV ≈ 5 km s−1). This is not compatible with the presence of short-period binary systems that are typically found in OB star populations (Sana et al. 2006, 2012, 2013; Kiminki & Kobulnicky 2012; Dunstall et al. 2015). This suggests either that the outcome of massive star formation in M17 has resulted in a significantly lower binary population or that massive binaries are originally formed at larger separations (100 R⊙ or more; Sana et al. 2017). Sana et al. (2017) argue that the first explanation is unlikely and propose that the newly born long-period binary systems should migrate on a timescale of the order of ∼2 Myr or less to match the observational properties of main-sequence massive star populations of only a few megayears in age. In the context of disk fragmentation theories, such an inward migration process may be driven by the interaction with the remnant of the accretion disk or with other protostellar bodies of the cluster. The effects of migration on the binary period distribution will halt when the sinks of angular momentum disappear, via the dissipation of the disk or dispersal of the cluster, or as other protostellar bodies are pushed far out or are ejected. Additional evidence for this migration scenario was found by Ramírez-Tannus et al. (2021), who show that the observed RV dispersion of stellar clusters positively correlates with their age.
As the Sana et al. (2017) scenario presumes that binaries are formed at large separations and then migrate, a strong test is determining the presence of a significant number of relatively massive companions at separations corresponding to the expected size of the accretion disk (10–1000 au, corresponding to 6–600 mas given the 1.7 kpc distance to M17). Such separations lie beyond the detection capabilities of spectroscopic campaigns but can be probed with high-angular-resolution observations (Sana 2017). In addition, the youngest massive stars are strongly reddened, and their spectral energy distribution (SED) peaks in the mid- to far-infrared. Fortunately, the advent of the GRAVITY instrument (GRAVITY Collaboration 2017) and the large collective areas of the 8.2m Unit Telescopes (UTs) at the European Southern Observatory (ESO) VLTI offer sufficient angular resolution and sensitivity to probe part of the M17 massive star population. In this paper, we present GRAVITY observations of a small sample of presumably single massive stars in M17 and show that all the objects are indeed part of a multiple system.
This paper is organised as follows. Section 2 presents the observations and interferometric modelling. Section 3 describe the multiplicity status of each object in the sample. We discuss our results in Sect. 4 and conclude in Sect. 5.
2. Observations and data analysis
2.1. Target sample and GRAVITY observations
We used the VLTI/GRAVITY K-band interferometric instrument and the 8.2m UTs to obtain high-angular-resolution data of young massive stars in the M17 region. Our sample was designed based on the spectroscopic study of Ramírez-Tannus et al. (2017), complemented with additional known O stars in the region, such as the Kleinmann Star at M17’s core (Kleinmann 1973). We applied a strict magnitude cut at K < 10 given GRAVITY’s advertised limiting magnitude in ESO period 101. This resulted in a sample of 21 objects that comprised 11 highly reddened sources. Less than half of the original sample, and none of the highly reddened targets, was observed as a result of technical problems and poor weather conditions. This paper presents GRAVITY observations of eight optically visible targets that were successfully observed between May 1, 2018, and July 19, 2019, using the optical MACAO system for adaptive optics correction in order to optimise the fibre injection. The observations were made in single-field on-axis mode: the light from the same star is split 50%–50% into the fringe tracker (FT) channel and science (SC) channel.
The four-UT configuration (U1-U2-U3-U4) delivers baselines ranging from ∼50 to ∼130 m (Fig. 1). The projected baseline lengths are equivalent to a resolution ranging from ∼1.6 to 4.3 mas at the wavelength of 2.16 μm. GRAVITY coherently interferes the collected light with double-mode fibres for fringe tracking on one side and observing science targets on the other side; this essentially means that GRAVITY is both an FT and SC instrument combined into one. The observations were carried out at medium spectral resolving power (λ/Δλ ∼ 500) with individual integration times of 5–30 s, providing a sufficient resolution to perform a basic spectral analysis of the observed systems, for instance deriving the stellar parameters as explained in Sect. 4. Table 1 provides the journal of our observations.
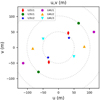 |
Fig. 1. Example of projected baselines (the so-called uv plane) of the VLTI/GRAVITY+UT observations towards NGC 6618-B189SW. The uv coverage differs slightly for the other sources but remains roughly the same due to close sky positions. |
Journal of GRAVITY observations.
We reduced the data using the standard GRAVITY pipeline (Lapeyrere et al. 2014) and the Python reduction tools from the GRAVITY consortium. To correctly remove the atmospheric effects and the instrumental instabilities during the processing, standard calibrators were observed concurrently. Calibrating the visibilities in order to get the intrinsic visibility of the scientific target is crucial. The choice of the most suitable calibrator was made using the Jean-Marie Mariotti Center (JMMC) SearchCal tool (Bonneau et al. 2011). These calibrators are early-KIII stars, the known diameters (< 0.4 mas) of which indicate that they can be considered as unresolved, single stars. The visibility calibration was done using the viscal pipeline available to the GRAVITY user community via the EsoReflex1 environment. The entire reduced dataset is available in the Optical interferometry DataBase (OiDB)2 under the collection name M17 young O-stars.
2.2. Distance considerations
The distance towards M17 has a linear influence on the derived physical separations. Literature estimates vary from 1.3 to 2.9 kpc. Using the photometric multi-colour UBVRI bands, Chini et al. (1980) derived a photometric distance of 2.2 ± 0.2 kpc. Nielbock et al. (2001) used the same UBV photometry method as Chini et al. (1980) but reconsidered the extinction law and eliminated the objects with infrared excess, yielding 1.6 ± 0.3 kpc. By reconstructing the SED of M17 from the near-infrared to the radio continuum, Povich et al. (2007) used the integrated flux to derive a bolometric luminosity of 2.4 × 10⁶ L⊙ and thus a luminosity distance of  kpc, in excellent agreement with Nielbock et al. (2001). Yet, the proper motion of methanol masers in the region provided a slightly larger distance of
  kpc (Xu et al. 2011). Maser distances are usually considered very robust, and the value of ∼2 kpc was therefore adopted in earlier papers by our team (Ramírez-Tannus et al. 2017; Sana et al. 2017).
As an independent check, we used the Gaia Data Release 2 (DR2) catalogue of distances provided by Bailer-Jones et al. (2018) and built the distance-generalised histogram of all Gaia sources within a 5′ radius of M17’s centre. We repeated the same experiment while restraining the sample to the initial target list described in Sect. 2.1. In both cases, the histograms peak at distances of about 1.5 and 1.6 kpc, respectively. The latest release of Gaia, the early third data release (eDR3), gives us an equivalent distance of 1.59 kpc. Both are in good agreement with the more careful work of Kuhn et al. (2019), whose method supersedes ours and whose paper is fully dedicated to the measurement of distances. The authors used the weighted median of individual stellar parallax measurements to estimate the overall system parallax. Field-star contaminants were discarded, and a total of 82 stars served for the calculation of the M17 distance. The uncertainties were evaluated using bootstrap analysis, to which the authors added a systematic uncertainty that accounts for a noise floor. In the following, we adopt the results of Kuhn et al. (2019) and hence a distance of  kpc.
kpc.
2.3. Interferometric modelling
From the reduced data, we determined the binary parameters by fitting two main types of observables: the visibility amplitude (hereafter |V|) and the closure phase (CP). The modelling functions and tools used for data analysis are described in this section.
From the |V| and CP, we can derive the variable parameters of flux ratio (f) and the source positions (Δα, Δβ) by performing binary model fitting. Two main tools were used to analyse the data: LITpro (Tallon-Bosc et al. 2008) and PMOIRED3, which were developed by the JMMC4 collaboration and Antoine Mérand, respectively. Based on a Levenberg-Marquardt algorithm, LITpro is a useful tool for searching for the geometrical functions that best model our observations. In the fitting process, we iteratively selected one (single star), two (a binary), or three (a triple) unresolved sources. In order to slightly adjust or improve the fit, we used additional model complexity, such as a background flux or a circumstellar disk. The flux weights of the primary star and the companion were free parameters. The position of the primary star was set to (0, 0) at the centre, and the position of the secondary and other components were left free. LITpro computes χ2 maps to accurately set the parameters and then performs a χ2 minimisation to find the best fitting parameter set.
LITpro allowed us to obtain good estimates of the binary position and average flux ratio but did not allow us to explore the values of parameters using a grid nor to handle the spectroscopic aspect of the GRAVITY data. We therefore used PMOIRED, a Python 3 module, which extends the fitting in the spectral dimension and does a telluric correction of the spectrum. The best-fit model is found via a comprehensive fitting process. First, we checked the relevance of a single star model, and we iteratively added complexity (binary, triple, resolved component). The uniform diameters of the two (or three) stars were fixed to 0.2 mas so that they are unresolved in our GRAVITY data. Similarly, the x and y spatial positions of the primary star were fixed at coordinates (0, 0). For each star the basic morphology of the source was identified with LITpro. As such, these parameters were used as first guesses for flux and position (x, y). As we wish to characterise any circumstellar emission, we also allowed the algorithm to account for a fully resolved emission component, as a fraction of the total flux. We fitted geometric models to the |V| and CP over the entire wavelength range (∼2.05 to 2.45 μm). To precisely determine the binary astrometry, we made use of a 2D search grid of global minima. As estimated parameters for the companion position, we used the starting point of the fit grid to ascertain the most suitable binary vector. We systematically explored the parameter space over a given pattern (x, ymin; x, ymax; x, ystep) to find the global minimum. The choice of spatial step for the first guesses grid was chosen in such a way that the global χ2 minimum within the explored range is not missed. This method was tested and has proven its efficiency for the CANDID code (Gallenne et al. 2015). A considerable advantage of PMOIRED is the possibility of refining the estimation of the parameters by using bootstrapping. This method usually led to larger but more realistic uncertainties because bootstrapping mitigates the effects of correlated data.
We explored a second approach that consists in modelling the |V|, CP, and normalised flux. The module extracts the continuum and uses it to compute the differential phase and normalised spectrum. We selected a wavelength range of 2.15–2.18 μm, centred on the Brγ line (2.166 μm). Additional parameters were added, such as the flux, central wavelength, and width of the line, using a Lorentzian profile. The output value of the flux of the line indicates whether the line is in absorption or emission. In all cases, centring the fit on the Brγ line did not significantly change the previously found flux ratio, positions, or χ2.
The goodness of fit of the models in both LITpro and PMOIRED was quantified through the use of reduced chi-squares ( ). Increasing the number of parameters in the model can improve the
  value, so we performed an F-test to assess whether adding complexity (i.e. adding circumstellar or interstellar components) did significantly improve the fit. The p-value for the F-test was compared to the 5% significance level. For example, the fit of the |V| and CP for B189NE is noticeably improved by adding a fully resolved component to the model (see Appendix B). The binary parameters used in the rest of the paper, and their respective bootstrapped uncertainties, are derived over 2.05 − 2.45 μm.
2.4. Spectral fitting and mass estimations
The flux spectrum of each object was computed by averaging the four medium-resolution UT spectra stored in the dataset. The absorption telluric features were corrected on both the target and its calibrator using the appropriate module in PMOIRED. The spectrum of the calibrator was used to correct the target for the instrumental response, and a K0III standard star allowed the target spectrum to be scaled. The 2MASS K-band magnitude of each star was adopted to flux-calibrate the final spectrum. To retrieve the stellar parameters of the binary components, the flux ratios derived for each system were applied to the spectrum.
In order to constrain the stellar parameters of the targets and their companions, we used the observed calibrated spectra and compared them to a family of atmosphere models and evolutionary tracks. We combined local thermodynamic equilibrium (LTE) PHOENIX models (≤3500 K) and ATLAS9 (3500–15 000 K) and TLUSTY (≥25 000 K) models to cover the entire range from 2300 to 50 000 K (Castelli & Kurucz 2003; Lanz & Hubeny 2003, 2007).
We further adopted the (pre-)main-sequence evolutionary tracks of Siess et al. (2000) up to 7 M⊙. Above 7 M⊙, we consider the stars to have reached the main sequence, and we used the galactic grid of evolutionary tracks and isochrones from Brott et al. (2011). For each mass and age value in the tracks, we linearly interpolated over the atmosphere model grids to calculate the corresponding atmospheric model. We re-binned it to the wavelength range and convolved it to the spectral resolution of our GRAVITY data. We then reddened it according to the measured values of extinction for each object (Hanson et al. 1997; Hoffmeister et al. 2008; Ramírez-Tannus et al. 2017) and the Fitzpatrick et al. (2019) reddening law. Finally, we compared models and data through a χ2 metric, taking the uncertainty on the observed spectrum into account. An example of a spectrum fit is shown in Fig. 2.
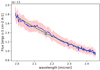 |
Fig. 2. Calibrated spectrum of the B189 SW primary star (blue), with errors in red. The best fit using Brott et al. (2011) evolutionary tracks is plotted in green. |
Within the 68% confidence interval, several combinations of stellar parameters are consistent with the observations. For our best fits, we chose those with effective temperatures that best match the known spectral type of the primary. Ages were also taken into account given the young age of M17 (≲1 Myr). Once the mass of the primary was determined, the magnitude contrast helped to gauge the difference in the sub-spectral type between a star and its companion, and hence its approximate mass. The same process was then iteratively used to look for the best-fit model of the companion. Ultimately, in view of the derived interferometric parameters, all systems appear to be massive. In this context, fits combining the ATLAS or TLUSTY atmospheric models with the Brott et al. (2011) evolutionary tracks are the most relevant. All the masses, for both central objects and companions, are displayed in Appendix C.
3. Multiplicity result
We summarise below the interferometric results for each target in our sample. In this section, we first concentrate on the six stars that belong to the NGC6618 complex (Fig. 3). At the end of this section we present two more systems that are present in our data but, after checking their distance (Gaia Collaboration 2018), proved to be foreground stars. With long-baseline interferometry we reveal companions at relatively small angular separations, ranging from ∼2 au to 100 au given a typical distance of 1.7 kpc to M17. For reference, these angular separations correspond to intermediate orbital periods of about 2.3 ≲ log P(days) ≲ 4.3. This is a rough estimation of the period, and it strongly depends on the eccentricity, which we cannot derive from our single-epoch GRAVITY data. In the following, we summarise our results for each object. The best-fit models and a table with the fitted parameters are respectively presented in Appendices A and B. Appendix B also shows how the  varies with respect to the models.
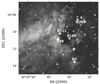 |
Fig. 3. Digitized Sky Survey (DSS) image of NGC 6618, on which we labelled our M17 GRAVITY sources in white. |
3.1. NGC6618-B189
Also known as Kleinmann’s Anonymous Star (not to be confused with the Kleinmann Star), NGC 6618-B189 (Kleinmann 1973; Chini et al. 1980, hereafter B189) is a massive visual binary in the centre of NGC 6618 and the most luminous object in M17. It was thought to be composed of two highly reddened O4 stars with a separation of ∼1.8″ (AV = 10 and 13 mag; Hoffmeister et al. 2008). The two components, which are major ionising sources in the region, were resolved by Chandra and XMM-Newton as bright X-ray sources with a hard thermal plasma emission (Broos et al. 2007; Mernier & Rauw 2013). As a result, Broos et al. (2007) and Mernier & Rauw (2013) suggested that the O4-plus-O4 system actually consists of four massive stars: two pairs of spectroscopic binaries that feature strong colliding winds or magnetic properties. Broos et al. (2007) reported a total mass of ∼140 M⊙ for the combined O4-plus-O4 system. The Kleinmann Star has also been observed in the radio regime. Rodríguez et al. (2009) outlined the presence of two radio sources that match the optical binary CEN 1. The radio emission likely originates from synchrotron emission produced by a relativistic population of electrons accelerated by shocks in the vicinity of the wind-wind collision regime.
Our interferometric observations demonstrate that NGC 6618-B189 is a binary-plus-triple system. We discuss the results for each component separately as the GRAVITY observations of B189 were split into two different pointings in order to characterise each component individually: NGC 6618-B189NE (also known as B189NE or CEN1a; Hoffmeister et al. 2008) and NGC 6618-B189SW (also known as B189SW or CEN1b; Hoffmeister et al. 2008) were observed one year apart, in June 2018 and July 2019, respectively.
B189SW is also reported as an O4 object. This system is intriguing due to the unusual shapes of the visibilities and CPs, as shown in Fig. 4. The system is characterised by a high-frequency sinusoidal shape in the visibilities, which indicates multiple stars at large separations. Similarly, the CPs oscillate with non-constant amplitudes, between −60 and +60 degrees at the most, which shows the high asymmetry of the system. B189SW consists of at least three hierarchical components (see Fig. 5). The shapes of the |V| and CPs are best reproduced using a triple system. In addition, the visibilities do not reach 1 when extrapolating to B = 0, indicating the probable presence of a resolved component. In order to better recreate the visibility modulation and obtain the correct amplitude on some baselines, the farthest companion was set as a deformed stretched Gaussian whose direction is characterised by two additional parameters, the projection angle and the inclination. The first detected companion is described as a resolved object with a flux of 44 ± 4% and a spectral index of −2.4 ± 0.5, a Gaussian full width at half maximum (FWHM) of 3.97 ± 0.41 mas oriented along a projection angle of −42.8 ± 3.6°, and an inclination of 77.7 ± 5.9°, and it has an angular separation of ρ = 71.95 ± 2.49 mas ( ) au; Hummel et al. 2016).
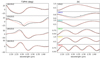 |
Fig. 4. Measured |V| and CPs for B189SW, plotted as a function of wavelength for each baseline. The overlaid red lines are the best-fit model from PMOIRED. The most suitable model for this source is a triple system with most likely a disk around the farthest component. A full description of the model geometry is given in Appendix B.1. |
The second detected companion is closer (ρ = 4.40 ± 0.82 mas;  au) and is much fainter than the central object, F3 = 0.09 ± 0.02F1. The complex geometry of the system is presented in Appendix B.
With differences of almost two magnitudes in the K band between the brightest object of the system and the other two companions, the latter are likely late-O or early-B stars. In such circumstances, and given the large separations involved, it is more difficult to justify the high X-ray luminosity and hard spectrum of B189SW from wind-wind collision. Indeed, the late-O or early-B stars have much weaker winds than the O4 star; as such, either the wind collision occurs close to the surface and wraps around the weaker wind stars or it collapses onto the stars’ surfaces (Usov 1992; Sana et al. 2005). In either case, the geometrical cross-section will be small and hence should not lead to strong X-ray emission over luminosity. Alternative explanations may be that yet another massive companion exists near the brightest component that cannot be resolved by the ∼2 mas angular resolution of our GRAVITY data, or that the X-ray emission from B189SW has a magnetic origin (Usov & Melrose 1992).
B189NE is known as an O4 star and one of the brightest and most massive members of M17 (mK = 5.8). The visibility and the CP pattern are in good agreement with a binary model and a fully resolved component that is likely a disk. As we do not probe sufficiently short baselines, the exact nature and geometry of the resolved component cannot be determined. However, the parameters of the binary do not depend on the choice of the resolved component, although they did change when we introduced the resolved component. Omitting a resolved component biases the astrometry and flux ratio of the binary, independently of its nature. We detect an interferometric companion at a separation of ρ = 1.26 ± 0.02 mas, corresponding to a projected distance (d) of  ) au, where the first uncertainty is that of the interferometric measurements and the second corresponds to that on the distance. Our best-fit model attributes 15% of the total emission to the fully resolved component. We measure a K-band flux ratio of f = F2/F1 = 0.75 ± 0.01 between the two stars, which, according to the calibrations of Martins & Plez (2006), translates to a difference of about one spectral sub-type between the two components of B189NE. Such a pair of early-O stars would have strong stellar winds and indeed is expected to generate a large amount of X-ray emission through wind-wind collision (Usov 1992; Stevens et al. 1992; Sana et al. 2004, 2006).
3.2. NGC 6618-B111
NGC 6618-B111 (also known as B111, CEN 2, or OI 337) has been reported to be an O5 V source and has a K-band magnitude of mK = 7.47 (Hoffmeister et al. 2008). The spectral type of B111 has recently been revised thanks to an X-Shooter campaign. Referring to the strong He II lines, Ramírez-Tannus et al. (2017) classified B111 as an O4.5 V star. Despite the young age of B111, Hanson et al. (1997) did not report any disk signature nor any near-infrared excess.
Based on the non-LTE stellar model FASTWIND (Puls et al. 2005; Rivero González et al. 2012), Ramírez-Tannus et al. (2017) derived stellar properties such as the effective temperature ( K) and the spectroscopic mass (
 M⊙). Such a small flux ratio probably only has a limited impact on the spectroscopic results of Ramírez-Tannus et al. (2017).
With GRAVITY, we detect a companion with a flux ratio f = 0.03 ± 0.01 at a separation of 17.26 ± 0.97 mas ( au). The data are best fitted by adding a resolved flux component that contributes 5.0 ± 0.1% to the total flux.
3.3. NGC 6618-B98
NGC 6618-B98 (otherwise known as CEN3 and referred to hereafter as B98) is an O9V-type source with a K-band magnitude mK = 7.58. Using JHK imaging at 1.1″ angular resolution, Hoffmeister et al. (2008) barely resolved B98 into two equally bright components in the K band. They also reported a third, very red companion at 2.5″ in the south-eastern direction. This third companion is 0.7 mag fainter than the central binary. Povich et al. (2009) note the low X-ray emission of B98 and pointed out the possibility of a companion. We used GRAVITY to further investigate the close environment of B98. Using our GRAVITY data, we detect a new companion at 1.01 ± 0.03 mas ( au), with an average flux ratio f = 0.31 ± 0.03.
3.4. NGC 6618-B0
NGC 6618-B0 (otherwise known as B0 or OI 345) is an O6 V source (Hoffmeister et al. 2008) with a K-band magnitude of 7.48. No companion has been reported in the literature. With the GRAVITY snapshot, we can fit either a binary or a triple model, with an equivalent  of respectively 1.75 and 1.63 (see Appendix B). The first resolved companion lies at a separation of 20.85 ± 1.25 mas (
 au) with a flux ratio f = 0.04 ± 0.01. We eventually detected a second companion with a flux ratio f = 0.010 ± 0.005 at a separation of 6.50 ± 0.75 mas (
 au). Given its flux ratio, the second companion is likely an early B-type star and the first is a less massive object, probably still on a PMS track given the young age of M17. The slight difference in the
  and in the number of degrees of freedom means that the nature of the system cannot be accurately determined. By performing an F-test with a significance level fixed at 5%, we derive a p−value of 0.0199, which is evidence of a triple system. However, this is not further confirmed if we lower the significance level to 1%. In the following discussion, we treat B0 as a triple system (as represented in Fig. 5), but we clarify in Sect. 4 how this choice affects the companion fraction (CF). However, getting additional interferometric data and performing image reconstruction may help us to image the close environment of B0, and as such, better constrain the multiplicity of this object.
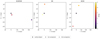 |
Fig. 5. Configuration of the three triple systems B189SW (MJD: 58295.295), B0 (MJD: 58237.405), and B260 (MJD: 58239.336). The companion stars are colour scaled according to their respective flux ratio (in delta magnitude scale). The flux of the central object is set to 1 by default. |
3.5. NGC 6618-B260
NGC 6618-B260 (or CEN 18, hereafter B260) is an O6 V source with a K-band magnitude of mK = 5.8. Displaying double absorption lines, in particular showing equally bright double Pa-11 lines, B260 is a candidate double-lined spectroscopic binary (Hoffmeister et al. 2008). The GRAVITY |V| and CPs reveal two faint companions (see Fig. 5) as well as the presence of a resolved component; this component, the exact nature of which we cannot constrain, accounts for 9.0 ± 0.1% of the total flux. The first companion is detected at a separation of 32.55 ± 2.45 mas ( au) with a flux ratio f = 0.07 ± 0.01. The second, closer companion orbits at 20.70 ± 4.76 mas (
 au) from the inner star and has a flux ratio f = 0.02 ± 0.01. Given the measured brightness ratio, these stars are unlikely the same companions as those detected in spectroscopy, making B260 a candidate hierarchical quadruple systems. The inner SB2 pair is likely separated by less than 1 mas as otherwise we would have detected its signature; this suggests probable orbital periods of several months or less.
3.6. Nearby stars in the line of sight towards M17
NGC 6618-B293 and TYC6265-1977-1 are F8- and G-type stars, respectively. They belong to neither the NGC 6618 cluster nor M17. Broos et al. (2007) suggested they could be two foreground stars, but we still included them in our magnitude-limited sample as they met our selection criteria (see Sect. 2.1) and because Gaia DR1 was not sufficiently robust at the time we selected the targets and built the sample.
3.6.1. NGC 6618-B293
NGC 6618-B293 (or CEN 7) is an F8 V type star with mK = 9.35. With a Gaia DR2 distance of 238 ± 4 pc (Bailer-Jones et al. 2018) (Gaia eDR3: 240 ± 1 pc), it is much closer than the 1.7 kpc expected for the distance of M17 and a clear foreground star. Given a flat visibility at ∼1, we conclude that the object is a single star within the sensitivities of our observations.
3.6.2. TYC 6265-1977-1
TYC 6265-1977-1 (hereafter TYC6265) was claimed to be a G-type star (Broos et al. 2007) with a K-band magnitude of 8.28. TYC6265 is located at 375 ± 6 pc from the Solar System (Bailer-Jones et al. 2018). Gaia eDR3 measurements are of the same order of magnitude (379 ± 3 pc) and further confirm that TYC6265 does not belong to M17. The interferometric data reveal the presence of a binary system. A companion with almost the same brightness as the primary is detected at 1.23 ± 0.04 mas (d = 0.46 ± 0.01 au) from the central star, with a flux ratio f = 1.04 ± 0.02. TYC6265 is therefore one of the 50% of Sun-like stars in the solar neighbourhood that are part of a multiple system (Raghavan et al. 2010). In the present case, the situation is rarer as the expected period is only a few months.
4. Discussion
Excluding B293 and TYC6265, our M17 sample comprises six objects. With up to three companions found per system, detected by spectroscopy or interferometry, all of the objects are multiple systems. In this section we present the relevant binary parameters, such as the multiplicity fraction (MF) and the CF, the flux, and mass ratios, that allow the multiplicity population in the NGC 6618 complex to be better understood. We also discuss the implication for binary star formation models that could apply to this young star-forming region.
4.1. Multiplicity and companion fraction
The immediate quantifiable multiplicity parameters that can be derived from our sample are the frequency of multiple systems – the MF – and the CF (Duchêne & Kraus 2013; Sana et al. 2014).
The multiplicity frequency is the ratio of multiple systems to the total number of systems. We derived the uncertainties on the multiplicity frequency using binomial statistics (Sana et al. 2014). Given the small sample size and the fact that MF≃100%, the 68% confidence interval is better estimated using Monte Carlo simulations than by using the binomial formula. We generated about 100 000 systems, where each system has a binary fraction of 0.9 (Sana et al. 2012). We summed the simulated results with 100% success and divided them by the number of trials. We repeated the process for a growing binary fraction from 0.9 to 1. For the young O-type stars in M17, we obtain an MF of 100%, with MF > 94% at the 68% confidence interval.
We compared this result with various studies, including those of Duchêne & Kraus (2013), Sana et al. (2014), and GRAVITY Collaboration (2018). In their review, Duchêne & Kraus (2013) present the stellar multiplicity from very low-mass to high-mass stars among main-sequence and PMS populations. Based on different observational techniques, the authors provide the statistics for more than 200 objects in the field from 0.01 to 28 M⊙, with the exception of the high-mass stars (> 16 M⊙) that are most likely members of open clusters or OB associations. Indeed, only 20% of the Galactic massive stars are known to be isolated, most of which are runaways (de Wit et al. 2004). The SMaSH+ survey (Sana et al. 2014) obtained high-angular-resolution observations of nearly 100 O-type stars spanning different luminosity classes (I–V). It covers separations of up to 16 000 au assuming a typical distance of 2 kpc. The vast majority of these stars are found in clusters or associations. For the purposes of this study and to provide a more accurate comparison among O main-sequence stars, we restricted the SMaSH+ database to dwarfs, those of luminosity class V (matching that of our sources). This leads to a sub-sample of 24 O dwarfs. GRAVITY Collaboration (2018) explored the MF of 16 stars (mainly O and B spectral type) in the young Orion Trapezium cluster, with separations of up to 600 au and mass ratios of about 0.3 on average.
With stars spanning different mass ranges, GRAVITY Collaboration (2018) opted for a different strategy, grouping stars according to their mass. In Fig. 6, for the mass range > 16 M⊙, GRAVITY Collaboration (2018) counts four sources in the Orion Nebula and obtains an MF of  , in agreement with what we derive. Our results also follow those of Sana et al. (2014): within the sub-sample of O dwarfs described above, they resolved 19 stars with at least one companion closer than 45 mas (i.e. 79% of the 24 O dwarfs). However, including previously detected spectroscopic companions, this rate rises to
  of multiple systems. Figure 6 shows a clear trend towards multiple systems for high-mass stars. The six systems observed in the M17 star-forming region further attest to the accuracy of the MFs measured in other galactic regions. Based on the MF parameter, and despite its youth, M17 appears to present a regular massive star population with a 100% incidence of multiple systems for stars with M > 20 M⊙.
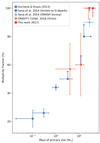 |
Fig. 6. MF of stars in various systems as a function of the primary mass. For reference, values from Duchêne & Kraus (2013) (dark blue), GRAVITY Collaboration (2018) (orange), and Sana et al. (2014) (light blue) are also presented for different mass regimes. |
The CF is the average number of companions per system and can thus reach values greater than 1. It was set as the number of companions divided by the total number of systems, including multiple and single stars. We derived the uncertainties on the companion rate using Poisson statistics (Sana et al. 2014). With nine companions detected with GRAVITY at separation ranges of 1–100 au, we get a CF of 1.5 ± 0.5. The number of companions per central object can vary from one to three if we add the spectroscopic companions reported in the literature. With 14 companions for a total of six systems, the derived CF reaches 2.3 ± 0.6 (Fig. 7), assuming that B0 is a triple. This number lowers somewhat, to 2.2 ± 0.6, if we assume B0 to be a binary. The overall conclusion is unaffected given that both CFs are within the error bars.
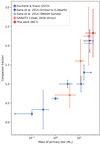 |
Fig. 7. CF of stars in different systems as a function of the primary mass. For reference, values from Duchêne & Kraus (2013), GRAVITY Collaboration (2018), and Sana et al. (2014) are also presented for different mass ranges. The results from Sana et al. (2014) (SMaSH+ Survey) presented here are those that include companions separated by up to 16 000 au. Unresolved and resolved companions are taken into account in the final derived companion rate. |
For the group of stars with M > 16 M⊙ (i.e. four systems), GRAVITY Collaboration (2018) observed a CF of 2.3 ± 0.8. This result includes both spectroscopic and interferometric companions. The results for the two other mass ranges (1 ≲ M ≲ 7 M⊙ and 7 ≲ M ≲ 11 M⊙) are shown in Fig. 7. Also considering only stars with mass > 16 M⊙, Duchêne & Kraus (2013) noted a CF of 1.3 ± 0.2, which is lower than the other results by almost a factor of 2. The CF derived by Sana et al. (2014) depends on the assumed separation range for companions. The full SMaSH+ survey can detect companions separated by up to 16 000 au, yielding a CF of 2.06 ± 0.15 regardless of the luminosity class. In the case of the restricted selection of SMaSH+ O dwarfs, the total number of companions is 51 within 600 au, yielding an average CF of 2.13 ± 0.30 (Sana et al. 2014). As we cannot probe for such wide companions here, we restricted the SMaSH+ database even more. We picked O dwarfs observed with PIONIER in the H band, ensuring the detection of companions within 100 au. The new sub-sample comprises 15 systems, for which a total of 35 companions have been reported. Figure 8 shows the results in a more homogeneous way: all CFs are derived within 100 au. We notice that the three data points corresponding to O stars show a similar CF despite large error bars. Based on Poisson statistics, the error bars could be reduced with an increasing sample size and a more accurate estimation of the spectroscopic companions (some information is missing for M17 sources). As for the MF, M17 is no exception in terms of CF. The young age of M17 tends to show that massive star formation results in a multiple system with at least two companions.
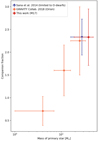 |
Fig. 8. CF within 100 au in different systems as a function of the primary mass. For reference, values from GRAVITY Collaboration (2018) and Sana et al. (2014) (sub-sample limited to PIONIER observations) are also displayed for different mass ranges. |
4.2. Flux ratios and mass ratios
We compared flux ratios, mass ratios, and the separations of companions by plotting different quantities. In Fig. 9 we display the resulting brightness contrast as a function of the companion separation in mas, assuming a distance of 1.7 kpc to M17, as described in Sect. 2.2. Results from other interferometric binary search campaigns have been overlaid, those of Sana et al. (2014) and GRAVITY Collaboration (2018). Only interferometric companions around O-type stars detected by GRAVITY in the K band (Orion and M17) or PIONIER in the H band (SMaSH+, O dwarfs) are displayed. Only one detection per system has been reported for Orion and SMaSH+ objects. Overall, this plot exhibits the wide range of companion properties that constitute the multiple systems around O-type stars within a few hundred milliarcseconds. No significant relation between the magnitude difference and separation is noticed. There is a clear lack of detection below Δmag ∼ 2 and companions located within 3 mas, which are difficult to reach with the PIONIER and GRAVITY sensitivity. SMaSH+ looks at sources with typical distances of 2 kpc, whereas M17 sources are 1.7 kpc and Orion sources 414 pc from Earth. Binaries of similar brightnesses observed with PIONIER, for which most of the Δmag are larger than one, lack GRAVITY data. The exception is B189NE, whose companion orbits at 2.1 au, which is 75% as bright as the primary. However, looking at M17 companions, we observe a larger magnitude difference for companions around 10 mas. The companion of B189SW, which lies at around 120 au from its host star, is significantly bright, with about 44% of the brightness of the central star. We notice the presence of a companion with similar characteristics (around 50 mas, Δmag ∼ 1.4) found in the Orion Nebula.
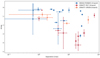 |
Fig. 9. Magnitude difference (Δmag) per angular separation in mas. For reference, the 19 detected companions around O dwarfs as part of the SMaSH+ survey (blue; Sana et al. 2014) and the four resolved companions around high-mass stars in Orion (orange; GRAVITY Collaboration 2018) have been plotted. |
Figure 10 shows the mass of the companions with respect to their separation. Mass ratios were calculated from the best-fit values retrieved after modelling the calibrated spectra (see Sect. 2.4). All the masses, for both central objects and companions, are displayed in Appendix C. We point out that the mass of the farthest component of B189SW has not been derived as its nature may likely involve a disk. As such, the flux ratio might include the contribution of the resolved component and cannot simply be modelled by a low-mass stellar atmosphere model. Consequently, only eight companions will appear in the following plots (out of the nine found). The colours indicate the order of the companion, from innermost (blue) to outermost (orange). There is no clear trend for the companion mass according to the separation. We notice that relatively massive companions are found around the primary stars, reaching up to 49 M⊙, regardless of their proximity to the host star. For five companions, the derived masses reach the limits fixed by the limited number of evolutionary tracks in the model. This is notably the case for the closest companion (∼1.7 au) and the farthest companion (∼120 au).
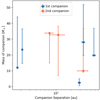 |
Fig. 10. Mass of the companions per companion separation (in au). In blue, the first companion refers to the closest companion. In orange, the second companion refers to the second closest, which was found with GRAVITY. |
In Fig. 11 we display the resulting mass ratios (Mcomp/Mprim) with the corresponding companion separation. Again, no clear correlation or significant trend is found between the mass ratio and separation, mainly due to the large error bars involved in the appreciation of the data. In general, the calculated mass ratios indicate massive systems, regardless of their separation. The only systems in M17 with mass ratios close to 1 have either a small separation of ∼2.3 au or a large separation of ∼120 au. Intermediate mass ratios, from ∼0.05 to ∼0.75, are found for separation ranges from 1.7 to 30 au. Comparing this to Fig. 9, we cannot certify a correlation between the flux ratio and mass ratio, as some sources may be more extincted than others, depending on their position within the cluster. Extinction is an important parameter that needs to be taken into account when retrieving the mass of the components from their spectra (see Sect. 2.4).
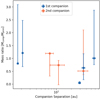 |
Fig. 11. Mass ratio per companion separation (in au). The blue data points refer to the mass ratio calculated with the closest companion. The mass ratios in orange have been calculated with the second-closest companion found with GRAVITY. |
An aside can be made concerning one of the sources for which VLT/X-SHOOTER spectroscopic data are available: B111. Despite the high uncertainty in log(g), Ramírez-Tannus et al. (2017) derived a spectroscopic mass of  M⊙ by using the stellar properties derived from best-fit FASTWIND parameters and the SED fitting. The mass of the primary derived in this study is 48 ± 1 M⊙, and the companion has a mass of 3 ± 2 M⊙. The overall mass of the system shows consistency with the spectroscopic mass derived by Ramírez-Tannus et al. (2017).
4.3. Connection with star formation models
We obtained the first constraints on the multiplicity properties of young massive stars in the star-forming region of M17. These stars are suspected to have already reached the zero-age main sequence. The system multiplicity will no longer be impacted by formation nor accretion mechanisms. Only the effects from stellar and cluster evolution will have the most significant effects on the binary statistics. Here, we compare our results with predicted star formation scenarios. With nine companions resolved by GRAVITY within 70 mas and a physical distance to M17 estimated at 1.7 kpc with Gaia eDR3, every star in our sample has at least one companion at a physical distance of less than 120 au. This is in agreement with Sana et al. (2014), who found that 100% of dwarfs in cluster or OB associations have a companion within 100 au. It seems clear that high-mass stars predominantly form in stellar clusters, as opposed to in isolation. This raises questions about the origin of such a multiplicity and the formation of close binary stars in situ.
There is no consensus on the formation of high-mass binaries nor their characteristics at birth. To date, the most prominent theories of binary formation involve stellar migration or capture, core accretion, and fragmentation or disk fragmentation. Most massive star formation scenarios agree on the need for a dense and massive primordial cloud to overcome the radiative forces generated by the newborn star (Zinnecker & Yorke 2007). High infall rates lead to massive and gravitationally unstable disks. Rapid accretion coupled with high angular momentum causes these disks to fragment (Kratter & Matzner 2006), possibly producing low-mass companions at 100–1000 au (Krumholz 2016). While taking radiative heating into account, Krumholz (2006) suggests that high temperatures stabilise the massive core, reducing the fragmentation and leading to small multiple systems with high-mass components. As a large volume is needed to form such a massive core fragment, one would expect a correlation between system mass and separation.
As shown earlier (see Sect. 4), the multiplicity properties across the main sequence are not uniform. Unlike the standard formation models that result in the formation of single solar-type stars, the multiplicity rate is key to discriminating between massive star formation theories. Three main competing theories of massive star formation are under active scrutiny: stellar collisions and mergers, monolithic collapse in isolated cores, and competitive accretion (Zinnecker & Yorke 2007).
Stellar collisions could create a very small fraction of high-mass stars but require extremely dense young clusters (> 106 stars pc−3; Krumholz & Bonnell 2007; Zinnecker & Yorke 2007). With only several thousand sources located in the massive stellar cluster (Broos et al. 2007; Hoffmeister et al. 2008), stellar collisions and mergers cannot be a dominant formation pathway in M17 nor in most galactic clusters and OB associations and will thus be discarded in the following discussion.
The competitive accretion scenario, as developed by Bonnell & Bate (2005), predicts that the forming star accretes material that was not initially gravitationally bound to the stellar seed (in contrast to the monolithic collapse model. The stellar seed competes for the mass available in the clump and grows via Bondi-Hoyle accretion (Bonnell et al. 2001; McKee & Tan 2003). Under this framework, Bonnell (2005a,b) predicts the formation of close binary systems through three-body capture: a massive primary star bounded with a lower-mass star interacts with a massive wide companion. During close approaches, huge amounts of energy are exchanged, resulting in the ejection of the lowest-mass star and a remaining central massive binary system. Accretion from a turbulent medium onto a binary can significantly tighten the system at the same time as it increases its mass ( ), meaning that a low-mass wide binary (∼100 au; Krumholz & Bonnell 2007) is likely to turn into a high-mass close binary. This is driven by continuous accretion that hardens binaries while increasing the masses of the components (Krumholz & Bonnell 2007). The dependence of the separation on the system mass results in clusters, with high-mass stars located in the cluster centre with close massive companions. Gas accretion shrinks the orbits, and the newborn system is composed of a high-mass close binary surrounded by a third, low-mass component at larger distances (Bate et al. 2002). Yet, three-body interactions tend to preferentially keep more massive stars in binaries, thus favouring equal mass ratios (Krumholz 2016). In our sample, the formation of tight binaries (B189NE,B98) and the presence of high-mass systems in the cluster core (the B189 complex) favour competitive accretion. However, we do not observe massive twin binaries, and we detect companions that span a wide range of separations, from 1.7 to ∼120 au. As such, there is no preference for close massive systems: some massive stars have close companions (within 5 au), but others have wider companions (up to ∼120 au). In addition, no correlation between mass and separation is found. We observe both massive close companions and massive wide components. All of the stars in our sample are early-type, limiting our study to massive components, as opposed to the sample of GRAVITY Collaboration (2018) in Orion, which probes a large variety of masses. A large spectrum of stars within the cluster is indeed expected by the competitive accretion scenario. The lack of observations of equal mass systems and the lack of a relation between binary separation and system mass (
 ) are in conflict with competitive accretion as the dominant formation channel.
Regarding monolithic collapse models (extended versions of standard low-mass star formation theory), McKee & Tan (2002, 2003) theorise that a massive star (either an individual or part of a future system) originates from the collapse of a dense and massive core that contains a mass reservoir sufficient to form the star (Krumholz & Bonnell 2007). During the collapse, a protostellar disk is naturally formed around the core, with typical sizes of 1000 au. These disks have strong spiral arms and are subject to fragmentation; some survive and end up as a companion star (Krumholz & Bonnell 2007). Such fragments tend to migrate inwards as the disk accretes. However, unlike the competitive accretion models, core accretion provides a framework in which protostars gain mass without tightening the binary separation (Zinnecker & Yorke 2007).
Due to the high luminosity of the forming massive star, in both scenarios high accretion rates are needed to prevent the radiation pressure and the ionisation from restraining mass infall onto the central star (McKee & Tan 2003). High infall rates lead to the formation of gravitationally unstable circumstellar disks with polar collimated outflows, overcoming the radiation pressure and allowing the growth of the central star. These disks are eventually prone to fragmentation (Kratter & Matzner 2006) and possibly produce low-mass companions at 100–1000 au (Krumholz 2016). Suspecting a scaled-up version for massive stars that grow via disk accretion, Oliva & Kuiper (2020) studied the formation of companions from spectroscopic regimes to 2000 au based on simulations. A growing accretion zone is formed around the massive newborn star, then forms spiral arms, and fragments shortly afterwards. These fragments are highly dynamic structures that interact with other fragments, the disk itself, and spiral arms. Continuously interacting with their environment, most of the fragments are likely destroyed. However, a few of them grow in mass over time, form second Larson cores, and yield companions in the middle or outer regions of the disk. The separation of the newborn companions should be comparable to disk sizes, which are typically hundreds to thousands of astronomical units, at the latest stages of the star formation process. Such protostars are prone to inward or outward migration in the long term (Meyer et al. 2018). In the context of disk fragmentation theories, such an inward migration process may be driven by the interaction with the remnant of the accretion disk or with protostellar bodies of the cluster.
Due to the wide range of properties obtained among the M17 population in terms of separations and masses, we are not able to identify a single (or mostly dominant) formation mechanism. Our results agree with different formation scenarios with respect to different separation ranges. While tight massive binaries could be explained with failed (migration-induced) mergers, by accretion onto protobinaries, or induced by the evolution of wider systems, massive wide binaries could be the product of fragmentation and disk-assisted capture (Zinnecker & Yorke 2007).
Nonetheless, it is worth mentioning that, given the young age of M17 (< 1 Myr), some dynamic processes may still be undergoing and that the final stellar content and structure of M17 is not set yet. In both accretion scenarios, competitive or core accretion, wide binaries are initially formed at large distances and eventually harden over time. Observing companions close to the primary star could also indicate that protostellar cores that were formed at the edges of the accretion disk migrated over time, as suggested by Oliva & Kuiper (2020) and Ramírez-Tannus et al. (2021). This hardening process that may occur on timescales of the order of 2 Myr (Ramírez-Tannus et al. 2021) might be driven by the interaction with the remnant of the accretion disk, in the context of disk fragmentation theories, or with other protostellar bodies present in the cluster. Radial velocity examinations in M17 have suggested that there is a lack of short-period binaries (close companions) in the cluster. To account for this, Sana et al. (2017) proposed that the migration scenario, as the main process for shrinking binary periods, might harmonise observational results in M17 and multiplicity properties observed in OB-star populations with ages of a few million years. In fact, being about ∼1 Myr-old, the migration process inside M17 is likely underway: the wide range of separations and mass ratios might illustrate that the stellar population did not reach the expected time to form the final structures. A combination of mechanisms is at play, and further investigations of the youngest objects are crucial. If the migration scenario is correct, we indeed expect that most of the objects have at least one detectable companion within the expected size of the accretion disk. A non-detection of companions within ∼200 au would invalidate the proposed scenario.
We note that not all objects need to undergo migration. The spectroscopic binary fraction reaches ∼50% for B stars and up to ∼70% for O stars, meaning that long-period massive binaries also exist. Indeed, the period distribution of massive binaries with ages of a few megayears follows a well-defined power law, ranging from about 1 d to at least 10 years (Fryer et al. 2012; Sana et al. 2012, 2014; Kobulnicky et al. 2014; Almeida et al. 2015; Banyard et al. 2021; Villaseñor et al. 2021). A migration affecting about half to two-thirds of all OB stars is therefore probably sufficient to explain the wide variety of separation observed.
5. Conclusions
In our quest to understand the origin of close massive stars, we performed VLTI/GRAVITY observations of six young O stars in the NGC6618 cluster inside M17. The high angular resolution reached by the VLTI allowed us to fill the gap of the unexplored range, 1–100 mas, between spectroscopic campaigns and imaging techniques. As the sources are all O-type objects of luminosity class V, they have already reached the main sequence. We used PMOIRED to model the |V| and CPs of each object in order to derive their multiplicity parameters. We identified the presence of binaries and triples with companions orbiting within ∼120 au.
-
All of the objects in M17 appear to be multiple systems. Hence, we measure an MF of 100%, with MF > 94% at the 68% confidence interval.
-
We detect a total of nine interferometric companions: we resolve two companions each around B189SW, B0, and B260, with magnitude differences of up to 4, and one companion each around B189NE, B98, and B111 at relatively close distances from their host stars (within ∼30 au).
-
Combined with the companions reported in the literature, which were based on spectroscopic surveys, a total of 14 companions are found. As such, we derive a CF of 2.3 ± 0.6 for our complete sample.
-
By comparing our data to atmosphere models and evolutionary tracks, we derived some stellar parameters, such as log(T), age and mass of each star. A large range of masses have been derived, from 3 to 50 M⊙.
-
The MF and CF derived in this region of M17, together with the mass estimations, further confirm that the first two quantities exhibited a rise with primary mass. Despite its young age, M17 shows consistency with previous studies (Sana et al. 2014; GRAVITY Collaboration 2018).
-
Finally, our observational results are compared to the expected properties of star formation predictions. Neither core accretion nor competitive accretion can fully reproduce our observations. A combination of processes may better explain the variety of separations and masses found in M17 among the population of young O-type stars. The picture will become more complete with the observation of the youngest stars in the cluster (i.e. the most embedded sources), the ones expected to better represent the outcome of star formation for high-mass stars.
This study addresses the multiplicity of PMS O-type stars, in milli-arcsecond scales, in the young M17 star-forming region. Multiwavelength observations combined with different techniques (high-contrast imaging, spectroscopy, interferometry) will be of great use to fully determine the properties of the companions and close the parameter space between innermost and outermost companions.
Accessible at http://oidb.jmmc.fr
Acknowledgments
This research has received funding from the European Research Council (ERC) under the European Union’s Horizon 2020 research and innovation programme (grant agreement number 772225: MULTIPLES). Based on observations collected at the European Southern Observatory under ESO programme 0101.C-0305(A) and 0101.C-0305(B). This work has made use of data from the European Space Agency (ESA) mission Gaia (https://www.cosmos.esa.int/gaia). This research has made use of the Jean-Marie Mariotti Center SearchCal (available at http://www.jmmc.fr/searchcal), OIFits Explorer (Available at http://www.jmmc.fr/oifitsexplorer) service, LITpro (LITprosoftware available at http://www.jmmc.fr/litpro) and OiDB service (Available at http://oidb.jmmc.fr) service co-developped by CRAL, IPAG and LAGRANGE. This research has made use of the SIMBAD database, operated at CDS, Strasbourg, France. This research made use of Astropy, (http://www.astropy.org) a community-developed core Python package for Astronomy (Astropy Collaboration 2013); astropy:2018 and of PMOIRED (https://github.com/amerand/PMOIRED), developed by Antoine Mérand. We used the internet-based NASA Astrophysics Data System for bibliographic purposes.
References
- Almeida, L. A., Sana, H., de Mink, S. E., et al. 2015, ApJ, 812, 102 [Google Scholar]
- Astropy Collaboration (Robitaille, T. P., et al.) 2013, A&A, 558, A33 [NASA ADS] [CrossRef] [EDP Sciences] [Google Scholar]
- Astropy Collaboration (Price-Whelan, A. M., et al.) 2018, AJ, 156, 123 [Google Scholar]
- Bailer-Jones, C. A. L., Rybizki, J., Fouesneau, M., Mantelet, G., & Andrae, R. 2018, AJ, 156, 58 [Google Scholar]
- Banyard, G., Sana, H., Mahy, L., et al. 2021, The observed multiplicity properties of B-type stars in the Galactic young open cluster NGC 6231 [Google Scholar]
- Bate, M. R., Bonnell, I. A., & Bromm, V. 2002, MNRAS, 336, 705 [Google Scholar]
- Beltrán, M. T., & de Wit, W. J. 2016, A&ARv, 24, 6 [Google Scholar]
- Bonneau, D., Delfosse, X., Mourard, D., et al. 2011, A&A, 535, A53 [NASA ADS] [CrossRef] [EDP Sciences] [Google Scholar]
- Bonnell, I. A. 2005a, in Competitive Accretion and the IMF, eds. E. Corbelli, F. Palla, & H. Zinnecker, 327, 425 [NASA ADS] [Google Scholar]
- Bonnell, I. A. 2005b, in Massive Star Birth: A Crossroads of Astrophysics, eds. R. Cesaroni, M. Felli, E. Churchwell, & M. Walmsley, 227, 266 [NASA ADS] [Google Scholar]
- Bonnell, I. A., & Bate, M. R. 2005, MNRAS, 362, 915 [NASA ADS] [CrossRef] [Google Scholar]
- Bonnell, I. A., & Bate, M. R. 2006, MNRAS, 370, 488 [NASA ADS] [CrossRef] [Google Scholar]
- Bonnell, I. A., Bate, M. R., & Zinnecker, H. 1998, MNRAS, 298, 93 [Google Scholar]
- Bonnell, I. A., Bate, M. R., Clarke, C. J., & Pringle, J. E. 2001, MNRAS, 323, 785 [Google Scholar]
- Bromm, V., Yoshida, N., Hernquist, L., & McKee, C. F. 2009, Nature, 459, 49 [NASA ADS] [CrossRef] [Google Scholar]
- Broos, P. S., Feigelson, E. D., Townsley, L. K., et al. 2007, ApJS, 169, 353 [Google Scholar]
- Brott, I., de Mink, S. E., Cantiello, M., et al. 2011, A&A, 530, A115 [NASA ADS] [CrossRef] [EDP Sciences] [Google Scholar]
- Bumgardner, T. E. 1992, Master’s Thesis, Ohio State Univ.,Columbus [Google Scholar]
- Castelli, F., & Kurucz, R. L. 2003, in Modelling of Stellar Atmospheres, eds. N. Piskunov, W. W. Weiss, & D. F. Gray, 210, A20 [Google Scholar]
- Chini, R., Elsaesser, H., & Neckel, T. 1980, A&A, 91, 186 [NASA ADS] [Google Scholar]
- de Wit, W. J., Testi, L., Palla, F., Vanzi, L., & Zinnecker, H. 2004, A&A, 425, 937 [NASA ADS] [CrossRef] [EDP Sciences] [Google Scholar]
- de Wit, W. J., Testi, L., Palla, F., & Zinnecker, H. 2005, A&A, 437, 247 [NASA ADS] [CrossRef] [EDP Sciences] [Google Scholar]
- Duchêne, G., & Kraus, A. 2013, ARA&A, 51, 269 [Google Scholar]
- Dunstall, P. R., Dufton, P. L., Sana, H., et al. 2015, A&A, 580, A93 [NASA ADS] [CrossRef] [EDP Sciences] [Google Scholar]
- Fitzpatrick, E. L., Massa, D., Gordon, K. D., Bohlin, R., & Clayton, G. C. 2019, ApJ, 886, 108 [Google Scholar]
- Frost, A. J., Oudmaijer, R. D., de Wit, W. J., & Lumsden, S. L. 2021, A&A, 648, A62 [NASA ADS] [CrossRef] [EDP Sciences] [Google Scholar]
- Fryer, C. L., Belczynski, K., Wiktorowicz, G., et al. 2012, ApJ, 749, 91 [Google Scholar]
- Gaia Collaboration (Brown, A. G. A., et al.) 2018, A&A, 616, A1 [NASA ADS] [CrossRef] [EDP Sciences] [Google Scholar]
- Gallenne, A., Mérand, A., Kervella, P., et al. 2015, A&A, 579, A68 [NASA ADS] [CrossRef] [EDP Sciences] [Google Scholar]
- GRAVITY Collaboration (Abuter, R., et al.) 2017, A&A, 602, A94 [NASA ADS] [CrossRef] [EDP Sciences] [Google Scholar]
- GRAVITY Collaboration (Karl, M., et al.) 2018, A&A, 620, A116 [NASA ADS] [CrossRef] [EDP Sciences] [Google Scholar]
- Hanson, M. M., Howarth, I. D., & Conti, P. S. 1997, ApJ, 489, 698 [NASA ADS] [CrossRef] [Google Scholar]
- Hoffmeister, V. H., Chini, R., Scheyda, C. M., et al. 2008, ApJ, 686, 310 [NASA ADS] [CrossRef] [Google Scholar]
- Hummel, C. A., Le Bouquin, J. B., & Merand, A. 2016, in Optical and Infrared Interferometry and Imaging V, eds. F. Malbet, M. J. Creech-Eakman, & P. G. Tuthill, SPIE Conf. Ser., 9907, 99073B [Google Scholar]
- Johnston, K. G., Robitaille, T. P., Beuther, H., et al. 2015, ApJ, 813, L19 [Google Scholar]
- Kiminki, D. C., & Kobulnicky, H. A. 2012, ApJ, 751, 4 [NASA ADS] [CrossRef] [Google Scholar]
- Kleinmann, D. E. 1973, App. Lett., 13, 49 [NASA ADS] [Google Scholar]
- Kobulnicky, H. A., Kiminki, D. C., Lundquist, M. J., et al. 2014, ApJS, 213, 34 [Google Scholar]
- Koumpia, E., de Wit, W. J., Oudmaijer, R. D., et al. 2021, A&A, 654, A109 [NASA ADS] [CrossRef] [EDP Sciences] [Google Scholar]
- Kratter, K. M., & Matzner, C. D. 2006, MNRAS, 373, 1563 [NASA ADS] [CrossRef] [Google Scholar]
- Kratter, K. M., Matzner, C. D., Krumholz, M. R., & Klein, R. I. 2010, ApJ, 708, 1585 [NASA ADS] [CrossRef] [Google Scholar]
- Kraus, S., Hofmann, K.-H., Menten, K. M., et al. 2010, Nature, 466, 339 [Google Scholar]
- Kraus, S., Kluska, J., Kreplin, A., et al. 2017, ApJ, 835, L5 [Google Scholar]
- Krumholz, M. R. 2006, ApJ, 641, L45 [NASA ADS] [CrossRef] [Google Scholar]
- Krumholz, M. R. 2016, ApJ, submitted [arXiv:1511.03457] [Google Scholar]
- Krumholz, M. R., & Bonnell, I. A. 2007, ApJ, submitted [arXiv:0712.0828] [Google Scholar]
- Krumholz, M. R., Klein, R. I., McKee, C. F., Offner, S. S. R., & Cunningham, A. J. 2009, Science, 323, 754 [Google Scholar]
- Kuhn, M. A., Hillenbrand, L. A., Sills, A., Feigelson, E. D., & Getman, K. V. 2019, ApJ, 870, 32 [CrossRef] [Google Scholar]
- Langer, N. 2012, ARA&A, 50, 107 [CrossRef] [Google Scholar]
- Lanz, T., & Hubeny, I. 2003, ApJS, 146, 417 [NASA ADS] [CrossRef] [Google Scholar]
- Lanz, T., & Hubeny, I. 2007, ApJS, 169, 83 [CrossRef] [Google Scholar]
- Lapeyrere, V., Kervella, P., Lacour, S., et al. 2014, in Optical and Infrared Interferometry IV, eds. J. K. Rajagopal, M. J. Creech-Eakman, & F. Malbet, SPIE Conf. Ser., 9146, 91462D [NASA ADS] [Google Scholar]
- Martins, F., & Plez, B. 2006, A&A, 457, 637 [NASA ADS] [CrossRef] [EDP Sciences] [Google Scholar]
- McKee, C. F., & Tan, J. C. 2002, Nature, 416, 59 [CrossRef] [Google Scholar]
- McKee, C. F., & Tan, J. C. 2003, ApJ, 585, 850 [Google Scholar]
- Mernier, F., & Rauw, G. 2013, New Astron., 20, 42 [NASA ADS] [CrossRef] [Google Scholar]
- Meyer, D. M. A., Kuiper, R., Kley, W., Johnston, K. G., & Vorobyov, E. 2018, MNRAS, 473, 3615 [NASA ADS] [CrossRef] [Google Scholar]
- Motte, F., Bontemps, S., & Louvet, F. 2018, ARA&A, 56, 41 [NASA ADS] [CrossRef] [Google Scholar]
- Nielbock, M., Chini, R., Jütte, M., & Manthey, E. 2001, A&A, 377, 273 [NASA ADS] [CrossRef] [EDP Sciences] [Google Scholar]
- Oliva, G. A., & Kuiper, R. 2020, A&A, 644, A41 [NASA ADS] [CrossRef] [EDP Sciences] [Google Scholar]
- Peters, T., Klessen, R. S., Mac Low, M.-M., & Banerjee, R. 2010, ApJ, 725, 134 [Google Scholar]
- Pomohaci, R., Oudmaijer, R. D., & Goodwin, S. P. 2019, MNRAS, 484, 226 [Google Scholar]
- Povich, M. S., Stone, J. M., Churchwell, E., et al. 2007, ApJ, 660, 346 [Google Scholar]
- Povich, M. S., Churchwell, E., Bieging, J. H., et al. 2009, ApJ, 696, 1278 [NASA ADS] [CrossRef] [Google Scholar]
- Puls, J., Urbaneja, M. A., Venero, R., et al. 2005, A&A, 435, 669 [NASA ADS] [CrossRef] [EDP Sciences] [Google Scholar]
- Raghavan, D., McAlister, H. A., Henry, T. J., et al. 2010, ApJS, 190, 1 [Google Scholar]
- Ramírez-Tannus, M. C., Kaper, L., de Koter, A., et al. 2017, A&A, 604, A78 [NASA ADS] [CrossRef] [EDP Sciences] [Google Scholar]
- Ramírez-Tannus, M. C., Backs, F., de Koter, A., et al. 2021, A&A, 645, L10 [NASA ADS] [CrossRef] [EDP Sciences] [Google Scholar]
- Rivero González, J. G., Puls, J., Najarro, F., & Brott, I. 2012, A&A, 537, A79 [NASA ADS] [CrossRef] [EDP Sciences] [Google Scholar]
- Rodríguez, L. F., González, R. F., & Montes, G. 2009, Rev. Mex. Astron. Atronomia, 45, 273 [Google Scholar]
- Sana, H. 2017, in The Lives and Death-Throes of Massive Stars, eds. J. J. Eldridge, J. C. Bray, L. A. S. McClelland, & L. Xiao, 329, 110 [Google Scholar]
- Sana, H., Stevens, I. R., Gosset, E., Rauw, G., & Vreux, J. M. 2004, MNRAS, 350, 809 [NASA ADS] [CrossRef] [Google Scholar]
- Sana, H., Antokhina, E., Royer, P., et al. 2005, A&A, 441, 213 [NASA ADS] [CrossRef] [EDP Sciences] [Google Scholar]
- Sana, H., Rauw, G., Nazé, Y., Gosset, E., & Vreux, J. M. 2006, MNRAS, 372, 661 [NASA ADS] [CrossRef] [Google Scholar]
- Sana, H., de Mink, S. E., de Koter, A., et al. 2012, Science, 337, 444 [Google Scholar]
- Sana, H., de Koter, A., de Mink, S. E., et al. 2013, A&A, 550, A107 [NASA ADS] [CrossRef] [EDP Sciences] [Google Scholar]
- Sana, H., Le Bouquin, J. B., Lacour, S., et al. 2014, ApJS, 215, 15 [Google Scholar]
- Sana, H., Ramírez-Tannus, M. C., de Koter, A., et al. 2017, A&A, 599, L9 [NASA ADS] [CrossRef] [EDP Sciences] [Google Scholar]
- Siess, L., Dufour, E., & Forestini, M. 2000, A&A, 358, 593 [Google Scholar]
- Stevens, I. R., Blondin, J. M., & Pollock, A. M. T. 1992, ApJ, 386, 265 [Google Scholar]
- Tallon-Bosc, I., Tallon, M., Thiébaut, E., et al. 2008, in Optical and Infrared Interferometry, eds. M. Schöller, W. C. Danchi, & F. Delplancke, SPIE Conf. Ser., 7013, 70131J [CrossRef] [Google Scholar]
- Tan, J. C., Beltrán, M. T., Caselli, P., et al. 2014, in Protostars and Planets VI, eds. H. Beuther, R. S. Klessen, C. P. Dullemond, & T. Henning, 149 [Google Scholar]
- Usov, V. V. 1992, ApJ, 389, 635 [Google Scholar]
- Usov, V. V., & Melrose, D. B. 1992, ApJ, 395, 575 [NASA ADS] [CrossRef] [Google Scholar]
- Villaseñor, J. I., Taylor, W. D., Evans, C. J., et al. 2021, MNRAS, 507, 5348 [CrossRef] [Google Scholar]
- Xu, Y., Moscadelli, L., Reid, M. J., et al. 2011, ApJ, 733, 25 [NASA ADS] [CrossRef] [Google Scholar]
- Zhang, Y., Tan, J. C., Tanaka, K. E. I., et al. 2019, Nat. Astron., 3, 517 [NASA ADS] [CrossRef] [Google Scholar]
- Zinnecker, H., & Yorke, H. W. 2007, ARA&A, 45, 481 [Google Scholar]
Appendix A: GRAVITY observations and best-fit model for each source
We present single-epoch GRAVITY observations of the six young O stars in the M17 region and the two foreground stars (which were part of the initial sample). The visibilities and CPs are plotted as a function of the interferometric baselines. Some of the sources (B189NE, B111, and B260) show a remaining signal in the residuals when the visibilities are modelled. Although the residuals are mainly centred around 0, this shape might be the result of instrumental biases or the lack of geometric complexity while performing the fit. Multiple tests that included more complex models with asymmetric or slanted disks (instead of a regular, fully resolved component) were applied in an attempt to correct these residuals. None of these trials were conclusive, in particular because they did not improve the quality of the Chi2. If we were to obtain more than one snapshot per target with an enhanced (u,v) coverage, we could perform image reconstruction, which would help in understanding whether these residuals are instrumental or involve a more complex interferometric signal.
For B189SW, we also display the model image that shows the disk around the second companion at ∼120 au. The best-fit model for each source is the one highlighted in bold in Table B.2; for all except B189SW, the overlaid fit is the one presented in Table B.1.
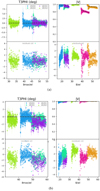 |
Fig. A.1. Summary plot of the GRAVITY observations for the two foreground stars, overplotted with the best-fit model in dark grey lines. The fit is performed over a restricted wavelength range from 2.05 to 2.45 μm. The colours code the baseline for visibilities, and the triangle for the CPs. (a) TYC-6265-1977-1. (b) NGC6618-B293. |
 |
Fig. A.2. Summary plot of the GRAVITY observations for the six young O stars in M17, overplotted with the best-fit model in dark grey lines. The fit is performed over a restricted wavelength range from 2.05 to 2.45 μm. The colours code the baseline for visibilities, and the triangle for the CPs. (a) NGC6618-B189SW. (b) NGC6618-B189NE. (c) NGC6618-B111. (d) NGC6618-B98. (e) NGC6618-B0. (f) NGC6618-B260. |
Appendix B: Best-fit parameters and  progression
We present here the results of the fitting process for the GRAVITY data of the M17 sources and the two foreground stars TYC6265 and B293 (see Table B.2). After testing the single star model on each source, we further investigated the morphology of the source with the goal of determining the presence of one or multiple companion(s). The best binary astrometry was found by searching for the global minimum in a 2D grid of positions (as explained in Sect. 2.3). We iteratively repeated the process while searching for a putative second companion. Our algorithm also allows the attribution of a fraction of the total flux to a fully resolved emission component. The model-fitting result retained for B189SW, which involves a more complex geometry, is presented in Table B.1 and Fig. B.1.
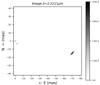 |
Fig. B.1. Illustration of the three components involved in the B189SW system, based on the best fitting geometric model to the GRAVITY data presented in Table B.1. |
Model-fitting result for B189SW, including two unresolved components and an inclined Gaussian. The central component, set as an unresolved punct at the coordinates (0, 0), is used as the phase and flux reference (Fcs).
Models and  progression for each source.
Appendix C: Master table
We present an overview of the six observed stars in the M17 region. We display the results of the best fits and the mass estimations.
Overview of the six young O stars observed in M17.
All Tables
Model-fitting result for B189SW, including two unresolved components and an inclined Gaussian. The central component, set as an unresolved punct at the coordinates (0, 0), is used as the phase and flux reference (Fcs).
All Figures
|
Fig. 1. Example of projected baselines (the so-called uv plane) of the VLTI/GRAVITY+UT observations towards NGC 6618-B189SW. The uv coverage differs slightly for the other sources but remains roughly the same due to close sky positions. |
| In the text | |
|
Fig. 2. Calibrated spectrum of the B189 SW primary star (blue), with errors in red. The best fit using Brott et al. (2011) evolutionary tracks is plotted in green. |
| In the text | |
|
Fig. 3. Digitized Sky Survey (DSS) image of NGC 6618, on which we labelled our M17 GRAVITY sources in white. |
| In the text | |
|
Fig. 4. Measured |V| and CPs for B189SW, plotted as a function of wavelength for each baseline. The overlaid red lines are the best-fit model from PMOIRED. The most suitable model for this source is a triple system with most likely a disk around the farthest component. A full description of the model geometry is given in Appendix B.1. |
| In the text | |
|
Fig. 5. Configuration of the three triple systems B189SW (MJD: 58295.295), B0 (MJD: 58237.405), and B260 (MJD: 58239.336). The companion stars are colour scaled according to their respective flux ratio (in delta magnitude scale). The flux of the central object is set to 1 by default. |
| In the text | |
|
Fig. 6. MF of stars in various systems as a function of the primary mass. For reference, values from Duchêne & Kraus (2013) (dark blue), GRAVITY Collaboration (2018) (orange), and Sana et al. (2014) (light blue) are also presented for different mass regimes. |
| In the text | |
|
Fig. 7. CF of stars in different systems as a function of the primary mass. For reference, values from Duchêne & Kraus (2013), GRAVITY Collaboration (2018), and Sana et al. (2014) are also presented for different mass ranges. The results from Sana et al. (2014) (SMaSH+ Survey) presented here are those that include companions separated by up to 16 000 au. Unresolved and resolved companions are taken into account in the final derived companion rate. |
| In the text | |
|
Fig. 8. CF within 100 au in different systems as a function of the primary mass. For reference, values from GRAVITY Collaboration (2018) and Sana et al. (2014) (sub-sample limited to PIONIER observations) are also displayed for different mass ranges. |
| In the text | |
|
Fig. 9. Magnitude difference (Δmag) per angular separation in mas. For reference, the 19 detected companions around O dwarfs as part of the SMaSH+ survey (blue; Sana et al. 2014) and the four resolved companions around high-mass stars in Orion (orange; GRAVITY Collaboration 2018) have been plotted. |
| In the text | |
|
Fig. 10. Mass of the companions per companion separation (in au). In blue, the first companion refers to the closest companion. In orange, the second companion refers to the second closest, which was found with GRAVITY. |
| In the text | |
|
Fig. 11. Mass ratio per companion separation (in au). The blue data points refer to the mass ratio calculated with the closest companion. The mass ratios in orange have been calculated with the second-closest companion found with GRAVITY. |
| In the text | |
|
Fig. A.1. Summary plot of the GRAVITY observations for the two foreground stars, overplotted with the best-fit model in dark grey lines. The fit is performed over a restricted wavelength range from 2.05 to 2.45 μm. The colours code the baseline for visibilities, and the triangle for the CPs. (a) TYC-6265-1977-1. (b) NGC6618-B293. |
| In the text | |
|
Fig. A.2. Summary plot of the GRAVITY observations for the six young O stars in M17, overplotted with the best-fit model in dark grey lines. The fit is performed over a restricted wavelength range from 2.05 to 2.45 μm. The colours code the baseline for visibilities, and the triangle for the CPs. (a) NGC6618-B189SW. (b) NGC6618-B189NE. (c) NGC6618-B111. (d) NGC6618-B98. (e) NGC6618-B0. (f) NGC6618-B260. |
| In the text | |
|
Fig. B.1. Illustration of the three components involved in the B189SW system, based on the best fitting geometric model to the GRAVITY data presented in Table B.1. |
| In the text | |
Current usage metrics show cumulative count of Article Views (full-text article views including HTML views, PDF and ePub downloads, according to the available data) and Abstracts Views on Vision4Press platform.
Data correspond to usage on the plateform after 2015. The current usage metrics is available 48-96 hours after online publication and is updated daily on week days.
Initial download of the metrics may take a while.