Fig. 4.
Download original image
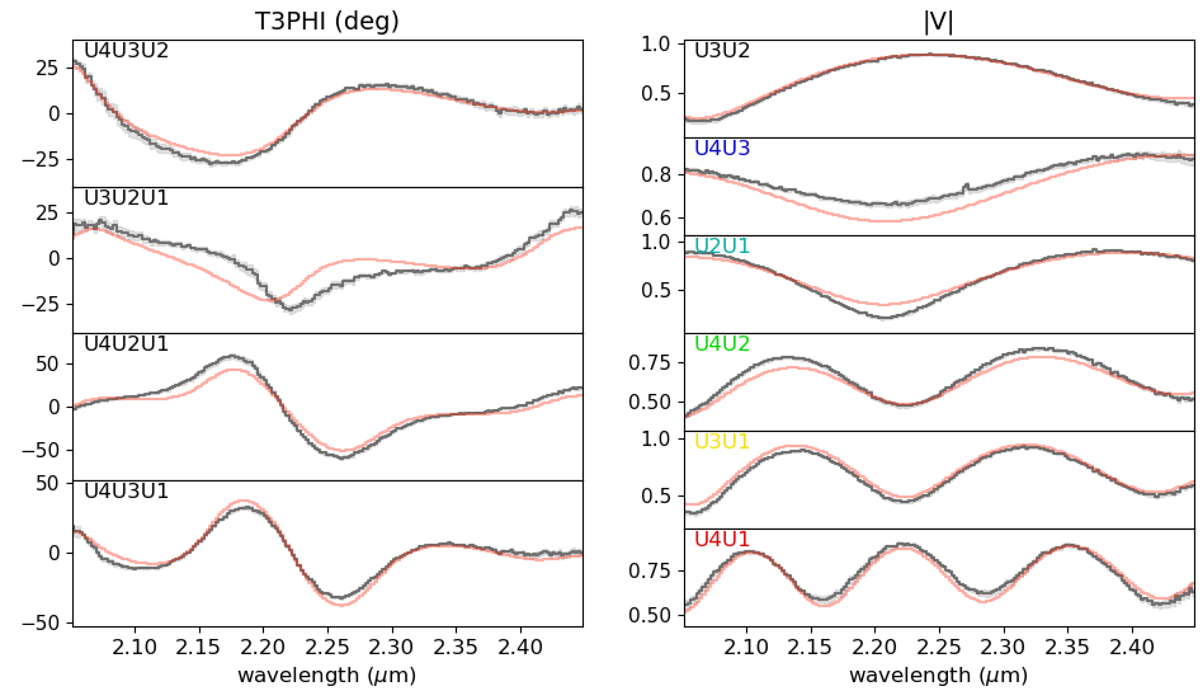
Measured |V| and CPs for B189SW, plotted as a function of wavelength for each baseline. The overlaid red lines are the best-fit model from PMOIRED. The most suitable model for this source is a triple system with most likely a disk around the farthest component. A full description of the model geometry is given in Appendix B.1.
Current usage metrics show cumulative count of Article Views (full-text article views including HTML views, PDF and ePub downloads, according to the available data) and Abstracts Views on Vision4Press platform.
Data correspond to usage on the plateform after 2015. The current usage metrics is available 48-96 hours after online publication and is updated daily on week days.
Initial download of the metrics may take a while.