Free Access
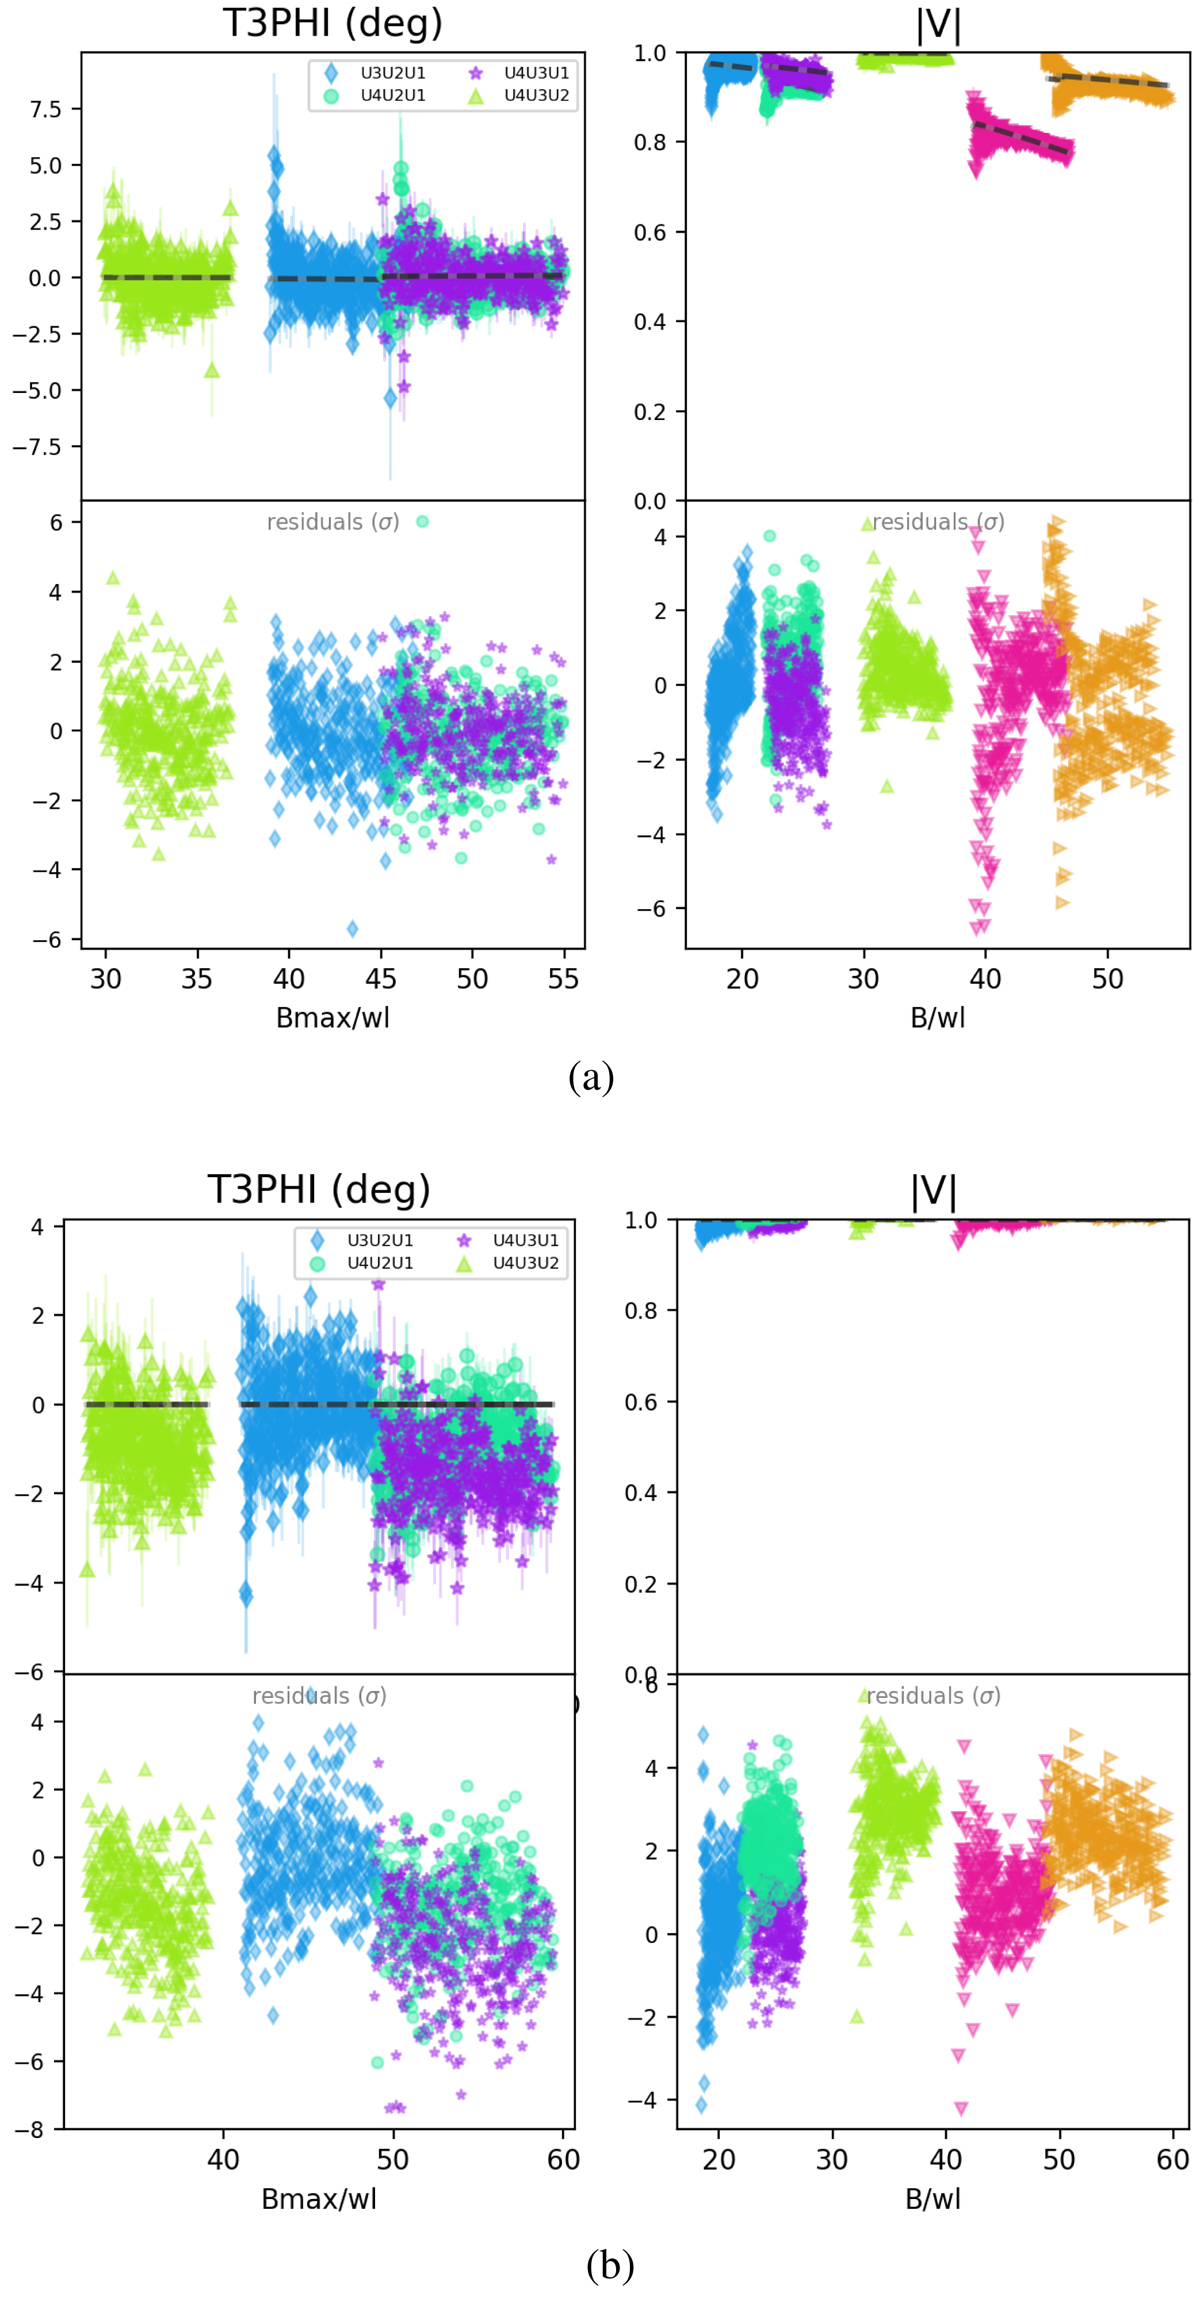
Fig. A.1.
Download original image
Summary plot of the GRAVITY observations for the two foreground stars, overplotted with the best-fit model in dark grey lines. The fit is performed over a restricted wavelength range from 2.05 to 2.45 μm. The colours code the baseline for visibilities, and the triangle for the CPs. (a) TYC-6265-1977-1. (b) NGC6618-B293.
Current usage metrics show cumulative count of Article Views (full-text article views including HTML views, PDF and ePub downloads, according to the available data) and Abstracts Views on Vision4Press platform.
Data correspond to usage on the plateform after 2015. The current usage metrics is available 48-96 hours after online publication and is updated daily on week days.
Initial download of the metrics may take a while.