| Issue |
A&A
Volume 662, June 2022
|
|
|---|---|---|
| Article Number | A22 | |
| Number of page(s) | 14 | |
| Section | Stellar structure and evolution | |
| DOI | https://doi.org/10.1051/0004-6361/202243301 | |
| Published online | 03 June 2022 | |
Three new high-mass X-ray binaries in the Large Magellanic Cloud
1
Max-Planck-Institut für extraterrestrische Physik, Gießenbachstraße 1, 85748 Garching, Germany
e-mail: This email address is being protected from spambots. You need JavaScript enabled to view it.
2
Université de Strasbourg, CNRS, Observatoire astronomique de Strasbourg, UMR 7550, 67000 Strasbourg, France
3
Astronomical Observatory, University of Warsaw, Al. Ujazdowskie 4, 00-478 Warszawa, Poland
4
South African Astronomical Observatory, PO Box 9, Observatory, Cape Town 7935, South Africa
5
Department of Astronomy, University of Cape Town, Private Bag X3, 7701 Rondebosch, South Africa
Received:
9
February
2022
Accepted:
1
March
2022
Abstract
Context. The Magellanic Clouds host a large population of high-mass X-ray binary (HMXB) systems, and although the Large Magellanic Cloud (LMC) is an order of magnitude more massive than the Small Magellanic Cloud, there are significantly fewer known HMXBs in the former.
Aims. We conducted a search for new HMXBs in XMM-Newton observations that were performed with the aim of investigating supernova remnant candidates in the supergiant shells LMC5 and LMC7. The three observed fields are located in regions that have not been widely explored in the X-ray band.
Methods. We analysed the XMM-Newton data to look for sources with hard X-ray spectrum and their counterparts with optical colours and brightness values that are typical of HMXBs.
Results. We report the discovery of three new Be/X-ray binaries, two of them showing pulsations in their X-ray flux. With a luminosity of 6.5 × 1034 erg s−1, we see that XMMU J045315.1−693242 in LMC7 was relatively X-ray faint. The long-term OGLE I-band light curve of the V = 15.5 mag counterpart suggests a 49.6 day or 24.8 day orbital period for the binary system. Then, XMMU J045736.9−692727, which is also located in LMC7, was brighter, with a luminosity of 5.6 × 1035 erg s−1 and hard spectrum with a power-law photon index of 0.63. The X-ray flux revealed clear pulsations with a period of 317.7 s. We obtained optical high resolution spectra from the V = 14.2 mag counterpart using the SALT-HRS spectrograph. Hα and Hβ were observed in emission with complex line profiles and equivalent widths of −8.0 Å and −1.3 Å, respectively. The I-band light curve obtained from OGLE shows a series of four strong outbursts followed by a sudden drop in brightness by more than 1 mag within 73–165 days and a recovery to the level from before the outbursts. RX J0524.2−6620, previously classified as X-ray binary candidate, is located at the eastern part of LMC5. We report the discovery of 360.7 s pulsations. During the XMM-Newton observation the luminosity was at ∼4 × 1035 erg s−1 and the source showed a hard spectrum with a power-law photon index of 0.78. The Hα emission line profile obtained from SALT-HRS is characterised by two broad peaks with a separation corresponding to ∼178 km s−1, along with an equivalent width of −4.2 Å. The long-term OGLE I-band light curve of the V = 14.9 mag counterpart reveals a quasi-periodic flaring activity while the colour evolution during the flares follows a hysteresis loop with redder colour during the rise. Based on the modelling the Hα line profiles measured from XMMU J045736.9−692727 and RX J0524.2−6620, we derived constraints on the size of the Be disks.
Conclusions. Our discovery of two pulsars among three new Be/X-ray binaries increases the number of known HMXB pulsars in the LMC to 25.
Key words: stars: emission-line / Be / stars: neutron / galaxies: individual: LMC / X-rays: binaries
© F. Haberl et al. 2022
 Open Access article, published by EDP Sciences, under the terms of the Creative Commons Attribution License (https://creativecommons.org/licenses/by/4.0), which permits unrestricted use, distribution, and reproduction in any medium, provided the original work is properly cited.
Open Access funding provided by Max Planck Society.
1. Introduction
The Magellanic Clouds are well known for their large number of high-mass X-ray binaries (HMXBs). In particular, the Small Magellanic Cloud (SMC) hosts more than 120 of these systems, nearly all of type Be/X-ray binary (BeXRBs; see Reig 2011, for a review), in which a compact object orbits a Be star. In most cases the compact object is a magnetised neutron star (NS), which accretes matter from the circumstellar disk of the Be star and powers the X-ray emission. For about half of the BeXRBs in the SMC pulsations in the X-ray flux were detected, which indicate the spin period of the NS (Haberl & Sturm 2016). The number of HMXBs known in the Large Magellanic Cloud (LMC) is smaller than in the SMC. With the recent discoveries of a 570 s BeXRB pulsar likely associated with a supernova remnant (Maitra et al. 2021a) and 40.6 s from the new BeXRB eRASSU J050810.4−660653 (Haberl et al. 2021), the number of published LMC HMXB pulsars increased to 23, while an additional ∼35 candidate HMXBs are known. The star formation histories of LMC (Antoniou & Zezas 2016) and SMC (Antoniou et al. 2010) play an important role with regard to the different number of active HMXBs that we see today. The BeXRBs in the SMC have been predominantly observed in regions that have experienced star formation bursts about 25–60 Myr ago – a timescale that is consistent with the evolutionary age of the Be phenomenon (Antoniou et al. 2010). Another reason for the lower number of HMXBs in the LMC is an observational bias attributed to the broad extent of the galaxy on the sky, which has restricted the deep mapping with sensitive X-ray instruments to the more central regions (Maggi et al. 2016).
We performed XMM-Newton programmes (PI Maggi) to observe the hot interstellar medium, supernova remnant candidates, and HMXB candidates in the supergiant shells (SGSs) LMC5 (near the rim to LMC4), and LMC7 (Meaburn 1980). These fields with young stellar populations have not been widely explored and new HMXBs are expected to be found among them. To look for new HMXBs, we investigated the detected X-ray point sources with hard X-ray spectrum. Many HMXB pulsars in the LMC are known in or near the rim of LMC4 (see e.g. Haberl et al. 2003). The SGS LMC4 hosts the supergiant system LMC X-4 and six BeXRB pulsars. Two BeXRBs in LMC7 were found in the past, the 187 s pulsar Swift J045106.8−694803 by Klus et al. (2013) and 4XMM J045546.0−695717 (Be cand 1 in van Jaarsveld et al. 2018). Here, we present the discovery of a BeXRB pulsar with 360.7 s period in LMC5 that is likely associated with RX J0524.2−6620, which was proposed to be an X-ray binary by Kahabka (2002). We also report two new BeXRBs located in the SGS LMC7, one of which is a 317.7 s pulsar. In Sect. 2, we describe the analysis of the XMM-Newton observations, the high-resolution optical spectra obtained at the Southern African Large Telescope (SALT, Buckley et al. 2006), and the archival monitoring data from the Optical Gravitational Lensing Experiment (OGLE; Udalski et al. 2008, 2015). We discuss our results in Sect. 3.
2. Observational data
The two new HMXBs that are located in the supergiant shell LMC7 were covered by two XMM-Newton observations from our project labelled with the proposal ID 080455 (PI Maggi). An additional, more recent serendipitous observation (0841660301) is available in the XMM-Newton archive, however, it was highly affected by background flaring activity. Because of the ∼50% lower EPIC-pn exposure and the lower source flux (see below), we did not use this observation to determine the source position. Our third new HMXB was found in the data of the observation 0841320201 (MCSNR J0524-6624, PI Maggi). Table 1 summarises all the observations.
XMM-Newton observations of XMMU J045315.1−693242, XMMU J045736.9−692727, and RX J0524.2−6620.
2.1. X-ray positions and optical counterparts
Following Sturm et al. (2013), we processed the data from the European Photon Imaging Camera (EPIC), which is equipped with pn- (Strüder et al. 2001) and MOS-type (Turner et al. 2001) charge-coupled device (CCD) detectors. We used the XMM-Newton Science Analysis Software (SAS) 19.1.01 package and performed source detection simultaneously on the 15 images from the three EPIC instruments in five energy bands (0.2–0.5 keV, 0.5–1 keV, 1–2 keV, 2–4.5 keV, 4.5–12 keV). This resulted in the X-ray source positions of RA (2000) = 73.31102°, Dec = −69.54548° for XMMU J045315.1−693242 (J0453 for short), RA (2000) = 74.40351°, Dec = −69.45837° for XMMU J045736.9−692727 (J0457), and RA (2000) = 81.04925°, Dec = −66.34743° for RX J0524.2−6620 (J0524). Using background quasars located in the field of view (FoV) of the two XMM-Newton observations of LMC7, we derived astrometric corrections of 2.7″–2.9″. No significant correction was required for J0524. The final X-ray coordinates are listed in Table 1 and are used for the source names. The position of our third source is 6.3″ from a hard ROSAT source (hardness ratio HR1 = 1.00 ± 0.09) at RA = 05h24m12.8s and Dec = −66°20′53″ (J2000) with a 90% confidence error of 12.6″, classified by Kahabka (2002) as X-ray binary. Hence, we identified the XMM-Newton source with J0524 and use the ROSAT name.
We found likely optical counterparts in the catalogues of the Magellanic Clouds Photometric Survey (Zaritsky et al. 2004) and the Two Micron All Sky Survey (2MASS, Cutri et al. 2003). The magnitudes and colours are consistent with early type stars, suggesting a BeXRB nature for all three sources. Table 2 details some properties of the optical counterparts.
Optical counterparts of XMMU J045315.1−693242, XMMU J045736.9−692727, and RX J0524.2−6620.
2.2. X-ray spectral analysis
We removed the times of increased flaring activity when the background was above a threshold of 8 counts ks−1 arcmin−2 for EPIC-pn and 2.5 counts ks−1 arcmin−2 for EPIC-MOS (7.0–15.0 keV bands) and we extracted the EPIC X-ray spectra from circular regions around the source positions and nearby blank-sky areas for the background. The region sizes were adjusted to source brightness and off-axis angle. From the EPIC-pn data single- and double-pixel events (PATTERN 0–4) were selected, excluding known bad CCD pixels and columns (FLAG 0). Similarly, the filters PATTERN 0–12 and FLAG 0 were used for EPIC-MOS. The spectra were re-binned to have at least twenty counts per bin, and χ2 statistic was used. The SAS tasks arfgen and rmfgen were used to generate the corresponding detector response files. The X-ray spectra were analysed with the spectral fitting package XSPEC 12.11.0k2 (Arnaud 1996). Errors are specified for 90% confidence, unless otherwise stated. A simple absorbed power-law model yielded acceptable spectral fits for J0453 and J0457, while for J0524 a more complex model was required. For the absorption, we used two column densities along the line of sight. One accounts for the Galactic foreground with solar abundances according to Wilms et al. (2000) and was fixed at the value obtained from H I measurements (Dickey & Lockman 1990)3; the other (free in the fit), with metal abundances set to 0.49 (Rolleston et al. 2002), reflects the absorption by the interstellar medium of the LMC and local to the source.
2.2.1. XMMU J045315.1–693242
J0453 was located on a chip gap of EPIC-pn, which significantly reduced the number of counts available for the analysis, moreover, no MOS1 data are available. We extracted counts within a circle around the source with radius 24″, while the background was taken from a nearby source-free region with radius of 42″. The EPIC-pn and -MOS2 spectra (118 and 167 net source counts, respectively) were fitted simultaneously with the same power-law model with all parameters linked, except a normalisation factor to allow for first-order cross calibration uncertainties between the EPIC instruments. The spectra are shown in Fig. 1 together with the best-fit model. The model parameters, observed fluxes and source luminosities are summarised in Table 3.
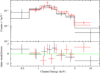 |
Fig. 1. EPIC spectra of J0453 together with the best-fit absorbed power-law model (histograms). The EPIC-pn count rate (data and model shown in black) is reduced due to the source location on a chip gap. No MOS1 data are available, MOS2 data are marked in red. |
X-ray spectral fit results.
2.2.2. XMMU J045736.9–692727
The position of J0457 was covered by all three EPIC instruments during both available XMM-Newton observations, which allowed us to extract spectra with 4100 (1410), 1740 (1100), and 1685 (1270) source counts within a circle with radius 37″ (30″) from the pn, MOS1 and MOS2 data of observation 0804550101 (0841660301), respectively. The background was taken from a nearby source-free region with radius of 44″ for both observations. We again fitted the spectra from the three instruments simultaneously with a power law with individual normalisation factors, first keeping the two observations separately. The best-fit parameters (Table 3) agree within their uncertainties. Hence, we combined in a second step all six spectra, which are presented in Fig. 2, together with the best-fit absorbed power-law model. Observed fluxes and source luminosities inferred from the individual observations are also listed in Table 3.
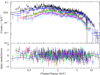 |
Fig. 2. EPIC spectra of J0457 from the two XMM-Newton observations (Table 1) together with the best-fit absorbed power law. The EPIC-pn, MOS1 and MOS2 data and best-fit model are shown in black (blue), green (light blue), and red (magenta) for obsID 0804550101 (0841660301), respectively. |
2.2.3. RX J0524.2–6620
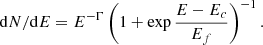
The position of J0524 was also covered by all EPIC instruments during the XMM-Newton observation (obsID 0841320201, see Table 1). We extracted source (background) events from circular regions with radius 30″ (50″). We fitted the spectra (2800, 1430 and 1550 net source counts from pn, MOS1 and MOS2, respectively) from the three instruments simultaneously with individual normalisation factors. In contrast to the previous two systems an absorbed single component model (i.e. power law) did not provide a good fit as was evident from the remaining features in the residuals. In particular, the residuals in the high-energy part of the spectrum indicated some curvature. To improve the fit, we attempted to use modified power laws with cutoff or to add a second continuum component. We first applied the standard cutoffpl model in XSPEC, which multiplies an exponential roll-off to the power law, while using one extra free parameter, the folding energy Ef (i.e. E−Γexp( − E/Ef)). This only marginally improved the fit and the residuals at high energies remained. We thus opted for other modified power-law models, which have two additional free parameters. First, the XSPEC model highecut was multiplied to the power law above the cutoff energy Ec (E−Γexp((Ec − E)/Ef)) and second, we used the fdcut model of Tanaka (1986) that was successfully used to model spectra of accreting X-ray pulsars (e.g. Vasilopoulos et al. 2020). The latter model is a power law with smooth cutoff and is expressed analytically as:
 (1)
(1)
The absorbed highecut and fdcut models provide acceptable fits with similar χ2 (Fig. 3, Table 3).
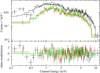 |
Fig. 3. EPIC spectra of J0524 together with the best-fit absorbed power-law model with high-energy cutoff (fdcut, see Table 3) as histograms. The EPIC-pn, MOS1 and MOS2 data and best-fit model are shown in black, green, and red, respectively. |
In terms of models with two components, a low temperature blackbody component that could account for thermal emission from the accretion disk did not improve the fit nor fixed the residuals at higher energies. Amongst two-component models, an acceptable fit was achieved by a combination of a power-law and a hot blackbody component as it offered a better description of the data and reduced the residuals. The goodness of fit as measured by χ2 improved by 55.3 with the addition of two model parameters in comparison to the simple power-law model. The temperature of the blackbody component was found to be 1.95 keV, while the size of the emission region of 460
 m appears to be consistent with a hot spot on the NS surface.
2.3. X-ray timing analysis
After correcting the event arrival times to the solar system barycentre, we created background-subtracted X-ray light curves of J0453, J0457, and J0524 in the 0.2–12 keV band by using the SAS tasks evselect and epiclccorr with an initial binning of 5 s. The same event selection criteria were used as for the spectra. We searched for a periodic signal in the XMM-Newton EPIC light curves using a Lomb–Scargle (LS) periodogram analysis (Lomb 1976; Scargle 1982) in the range of 10–3000 s, which covers typical periods seen from HMXB pulsars.
2.3.1. XMMU J045315.1–693242
The X-ray light curve of J0453 rebinned to 600 s is presented in Fig. 4. Some variations in the flux are visible, but the large errors don’t allow us to draw more quantitative conclusions. Fitting a constant to the light curve yields a reduced χ2 of 1.5 for 50 degrees of freedom.
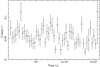 |
Fig. 4. Background-subtracted X-ray light curve of J0453 in the 0.2–12 keV energy band with time bins of 600 s. The light curve is vignetting- and PSF-corrected and it combines EPIC-pn and MOS2 data. Time zero corresponds to MJD 58142.5517 (2018 January 24, 13:19:28.7 UT). |
2.3.2. XMMU J045736.9–692727
The X-ray light curve of J0457 from the November 2017 observation, rebinned to 318 s (the pulse period, see below) using the combined EPIC data shows flux variations by about a factor of two on timescales of typically one hour (Fig. 5). A strong periodic signal is detected with a fundamental frequency corresponding to ∼318 s together with three harmonics as shown in Fig. 6. The fundamental frequency indicates the spin frequency of the accreting NS, while the large number of harmonics suggests a complex pulse profile. In order to determine the pulse period more precisely and its uncertainty, we employed the Bayesian periodic signal detection method described by Gregory & Loredo (1996). The inferred spin period with its associated 1σ error are 317.72 ± 0.05 s. The background-subtracted XMM-Newton EPIC light curves, folded with the best-obtained period, are characterised by a narrow deep dip as shown in Fig. 7.
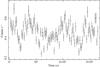 |
Fig. 5. Background-subtracted X-ray light curve of J0457 from observation 0804550101 in the 0.2–12 keV energy band with time bins of 318 s (corresponding to the pulse period). The light curve is vignetting- and PSF-corrected and combines EPIC-pn, MOS1 and MOS2 data. Time zero corresponds to MJD 58063.1707 (2017 November 6, 04:05:50.6 UT). |
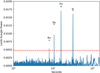 |
Fig. 6. LS periodogram of J0457. Pulsations are clearly detected with a fundamental frequency corresponding to a period of ∼318 s together with signals at three harmonic frequencies. The red dashed line marks the 3σ confidence level. |
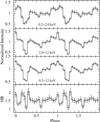 |
Fig. 7. Corrected EPIC-pn light curves folded with 317.72 s showing the pulse profile of J0457 in the energy bands of 0.2–2.0 keV (soft), 2.0–12 keV (hard) and total 0.2–12 keV. The intensity profiles are normalised to their mean count rates, 0.189 cts s−1, 0.268 cts s−1, and 0.457 cts s−1 for the soft, hard, and total energy bands, respectively. For the hardness ratio (HR), the count rate in the hard band was divided by that in the soft band. A deep, sharp dip can be seen, which causes the high number of harmonic frequency peaks in the periodogram (Fig. 6). |
Despite the strong background flaring activity during the April 2020 observation we searched for the pulse period. We used data that is filtered and not filtered for the background flares. Both methods led to a very noisy LS periodogram, either due to the many data gaps or due to the highly variable background. We were able to determine the period with the Bayesian method to 317.08 ± 0.14 s, indicating a small spin-up at ∼4.3σ confidence.
2.3.3. RX J0524.2–6620
To investigate the temporal properties of the system we followed similar procedure as with the other two pulsars. A pulse period of 360.70 ± 0.12 s was determined following the Bayesian periodic signal detection method described by Gregory & Loredo (1996). The X-ray light curve derived from all EPIC cameras is plotted in Fig. 8. No significant variability on timescales larger than the spin period is evident from the data. The pulse profile is double peaked while the major and minor peaks are separated by 0.6 in phase (see Fig. 9).
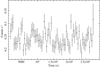 |
Fig. 8. Background-subtracted X-ray light curve of J0524 in the 0.2–12 keV energy band with time bins of 630.7 s (corresponding to the pulse period). The light curve is vignetting- and PSF-corrected and it combines EPIC-pn, MOS1, and MOS2 data. |
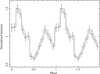 |
Fig. 9. Corrected EPIC-pn light curve folded with 360.7 s showing the pulse profile of J0524 in the energy band of 0.2–12 keV, normalised to the mean count rate of 0.124 cts s−1. |
2.4. Long-term X-ray variability
The regions of the LMC where our new BeXRBs are located were not widely observed in X-rays in the past. We used the HIgh-energy LIght curve GeneraTor (HILIGT; König et al. 2022; Saxton et al. 2022)4 to search for serendipitous observations of the new systems with ROSAT, Swift, and XMM-Newton and to determine upper limits (2σ) when the sources were not detected. We also checked for possible detections in the Chandra source catalogue (Evans et al. 2010) and did not find any X-ray counterpart within 10″ of the corresponding source positions.
2.4.1. XMMU J045315.1–693242
Apart from the detection in the XMM-Newton observation reported here, only upper limits are available for J0453 from ROSAT/PSPC (all-sky survey and three pointed) observations, one Swift/XRT observation and from XMM-Newton, which slewed across the source ten times. All the upper limits are higher than the XMM-Newton flux we measured from the pointed observation in January 2018 and only restrict the maximum 0.2–12 keV flux to less than ∼8.4 × 10⁻¹² erg cm−2 s−1. Hence, no strong outburst was detected that was more luminous than ∼2.5 × 1036 erg s−1 and, thus, the source is likely to be a low-luminosity BeXRB.
2.4.2. XMMU J045736.9–692727
Similarly, the position of J0457 was covered by the same ROSAT observations. The source was detected on 1993 October 14 with a 0.2–2 keV count rate of 0.0154 ± 0.0054 cts s−1, which corresponds to a 0.2–10 keV flux of 2.27 ± 0.80 × 10⁻¹² erg cm−2 s−1, assuming the spectral model inferred from the XMM-Newton observations and using the ROSAT PSPC detector response. The source was also detected during one (of 12) XMM-Newton slews (on 2006 August 5) with a 0.2–12 keV count rate of 0.37 ± 0.19 cts s−1 (Saxton et al. 2008; XMM-SSC 2018), consistent with the fluxes measured during observations 0804550101 (0.456 ± 0.006 cts s−1) and 0841660301 (0.232 ± 0.005 cts s−1). All detections of XMMU J045736.9−692727 indicate long-term flux variations by at most a factor of a few in a range of ∼1–3 × 10⁻¹² erg cm−2 s−1. The corresponding luminosities between ∼3–9 × 1035 erg s−1 suggest a persistent intermediate luminosity BeXRB. No Swift observation covered the position of J0457.
2.4.3. RX J0524.2–6620
This BeXRB was frequently observed by ROSAT, 26 times with the PSPC (including the all-sky survey) and 14 times with the HRI detector. Seven PSPC detections yielded 0.2–2 keV count rates between 0.01 cts s−1 and 0.08 cts s−1, while 19 upper limits are derived with similar count rates of 0.01−0.07 cts s−1. While the PSPC exposure times were short, typically less than 1000 s, the HRI observations were ∼10 times longer. This is reflected in 8 HRI detections of J0524 with count rates between 0.0015 cts s−1 and 0.0060 cts s−1 and upper limits between 0.0016 cts s−1 and 0.0065 cts s−1. To take into account the different sensitivity of the two ROSAT detectors, we converted the count rates into 0.2–12 keV fluxes using the detector response files and assuming the best fit fdcut model parameters from the XMM-Newton observation. The inferred flux to count rate conversion factors are 1.12 × 10⁻¹⁰ erg cm−2 cts−1 and 3.09 × 10⁻¹⁰ erg cm−2 cts−1 for the PSPC and HRI detectors, respectively. The fluxes measured by ROSAT are in the range of 4.6 × 10⁻¹³ erg cm−2 s−1 to 8.9 × 10⁻¹² erg cm−2 s−1, that is, the luminosity was never observed above ∼2.6 × 1036 erg s−1 (very similarly to J0453). No Swift observation covered the position of J0524.
2.5. SALT
Optical spectroscopy of our new HMXBs was undertaken on 11 January 2022 using the High Resolution Spectrograph (HRS, Crause et al. 2014) on SALT under the transient follow-up programme. The HRS is a dual-beam, fibre-fed Echelle spectrograph providing spectra in the 3700–5500 Å and 5500–8900 Å wavelength ranges. The low resolution mode (R ∼ 14 000) of the HRS was used to observe two of the targets, J0457 and J0524, with exposure times of 1200 s. The primary reductions, which include overscan correction, bias subtraction and gain correction, were carried out with the SALT science pipeline (Crawford 2015). The remaining reduction steps which include background subtraction, arc line identification, removal of the blaze function, and merging of orders were performed with the MIDAS FEROS (Stahl et al. 1999) and ECHELLE (Ballester 1992) packages (for a detailed overview of the reduction steps, see Kniazev et al. 2016).
2.5.1. XMMU J045736.9–692727
For J0457, we obtained the red and blue HRS spectra, which cover the Hα and Hβ lines (Fig. 10). Both lines are seen in emission (Fig. 10) and have measured line equivalent widths (EQWs) of −7.99 ± 0.37 Å and −1.29 ± 0.08 Å, respectively. Their complex morphology is characterised by a blue-dominated double-peaked structure. Shoulders on both sides of the line blend suggests more than two emission components. We have modelled the line profiles with a superposition of several Gaussian lines.
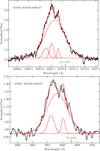 |
Fig. 10. SALT HRS spectra of J0457 around the Hα (top) and Hβ (bottom) lines. Both lines are in emission and highly structured. The spectrum around Hβ is smoothed using a rolling average filter with kernel size of 5. The wavelengths shifted to the rest system of the LMC are indicated by the green vertical lines. |
For the Hα line four Gaussians are required to obtain an acceptable fit, their central wavelengths and the widths are detailed in Table 4. The Hα line complex is dominated by a broad line, while narrower lines are responsible for the two peaks. An additional narrow line contributes on the blue side. We have verified that the faint lines are not caused by an imperfect sky-subtraction. Inspecting the sky-background spectrum shows a weak narrow Hα line, but at a different wavelength, which is properly subtracted. The profile of Hβ is very similar to that of Hα and may be composed by the same number of lines. However, due to the lower signal, three lines are formally sufficient to reproduce the profile (Fig. 10). Again, a broad line is dominant and two narrower lines are responsible for the two peaks.
Emission line profiles.
For the case of Hα, converting the relative wavelength shifts into velocities along the line of sight, the narrower lines correspond to −90.4 km s−1, −31.8 km s−1, and 34.3 km s−1, relative to the centre of the broad line. The dominant broad line is blue-shifted with respect to the LMC rest frame (assuming zLMC = 0.00093) by −109.3 km s−1.
2.5.2. RX J0524.2–6620
The Hα line from J0524 is seen in emission and has a triple-peak structure (Fig. 11), with a measured EQW of −4.20 ± 0.24 Å. We fitted the line profile with three Gauss functions and again list their central wavelengths and widths in Table 4. The blue and red components have similar widths (1.4–1.5 Å) while the central line is significantly narrower (0.24 Å). Inspection of the sky background spectrum reveals a strong narrow Hα line, which leaves some residual after subtraction. The blue and red components are shifted with respect to each other, corresponding to a relative line of sight velocity of −177.6 km s−1.
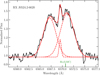 |
Fig. 11. SALT HRS spectrum of J0524 around the Hα line, marked as in Fig. 10. The narrow line is a residual feature from sky background subtraction. The spectrum is smoothed using a rolling average filter with kernel size 5. |
2.6. OGLE
The regions around the three X-ray sources were monitored regularly in the I and V filter bands during phases III and IV of the OGLE project. Images were taken in I and less frequently in V, with the photometric magnitudes calibrated to the standard VI system. OGLE-III and OGLE-IV I-band images were reduced together using the same reference set yielding a homogeneous OGLE-III + OGLE-IV time series.
2.6.1. XMMU J045315.1–693242
From the optical counterpart of J0453 (2MASS 04531503−6932416, OGLE IDs LMC135.1.36 and LMC136.4.180 from two overlapping OGLE-III fields, and LMC531.12.31 from OGLE-IV) 18.5 years of OGLE I-band data are available. The first part of the light curve, which is presented in Fig. 12, is characterised by brightness variations with 0.15–0.25 mag amplitude. However, after mid March 2011, a sudden increase in brightness (by ∼0.3 mag) over a period of about 2.75 years occurred, followed by a more gradual decrease for at least 6.25 years. After this long optical outburst, the brightness reached almost the level the star had before, when the observations ended in March 2020.
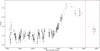 |
Fig. 12. OGLE I-band light curve of J0453 between 2001 September 14 and 2020 March 13. The vertical dashed red line indicates the time of the XMM-Newton observation. |
OGLE V-band observations of J0453 started more than two years later than those of OGLE I, and they provided 17 years and 2 months of monitoring (Fig. 13). To estimate the I-band magnitudes at the times of the V-band measurements, we interpolated the adjacent I-band magnitudes and computed the V − I colour index. The colour index is shown as a function of the I magnitude in Fig. 14. Data taken during the optical outburst are marked in red in Figs. 13 and 14. During the outburst, the BeXRB appears bluer than during the optical low state, independently of the brightness.
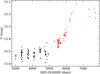 |
Fig. 13. OGLE V-band light curve of J0453 between 2003 December 28 and 2016 December 18. The outburst is marked in red. The XMM-Newton observation was performed after the last V-band observations. See also Fig. 12. |
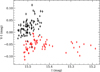 |
Fig. 14. J0453: OGLE V − I colour index vs. I (interpolated linearly to the times of the V-band measurements). As in Fig. 13, the data taken during the outburst are marked in red. |
We searched for periodic variations in the OGLE I-band light curve. To avoid the large brightness variations during the long outburst, we selected the data before HJD of 2456000 days and again we used the LS periodogram analysis for periods between 2 and 110 days. The LS periodogram revealed two highly significant peaks at periods of 24.81 ± 0.05 days and 49.61 ± 0.20 days (see Fig. 15). The errors are conservatively estimated from the width of the peaks. The longer period is consistent with twice the value of the shorter one, which suggests 24.81 days as first harmonic of a fundamental period of 49.61 days. Figure 16 shows the light curve (before the outburst) folded with the period of 49.61 days. It is dominated by a symmetric outburst which lasts for about half the period and also reveals a smaller outburst, shifted by 0.5 in phase, which is responsible for the harmonic signal in the LS periodogram.
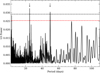 |
Fig. 15. LS periodogram of the OGLE I-band data (before the large outburst, HJD < 2456000 days) of J0453. The arrows mark the highest peaks at 49.61 days and 24.81 days. The red and black dashed lines mark the 95% and 99% confidence levels. |
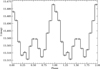 |
Fig. 16. Folded OGLE I-band light curve of J0453 with a period of 49.61 days, repeated for two cycles for clarity. |
2.6.2. XMMU J045736.9–692727
The OGLE I-band light curve of the most likely counterpart of J0457 (2MASS 04573695 − 6927275, OGLE IDs LMC127.8.34098 and LMC531.09.34322 from OGLE-III and OGLE-IV, respectively) over 18.5 years is presented in Fig. 17. Several outbursts are visible, in particular a very strong one, which is followed by a dramatic decrease in brightness by about one magnitude. A similar event was likely largely missed at the beginning of the OGLE monitoring where only part of the recovery from a dip was recorded. The two events were ∼4395 days apart.
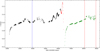 |
Fig. 17. OGLE I-band light curve of J0457 between 2001 September 14 and 2020 March 13. The vertical dashed lines indicate the times of the XMM-Newton slew detection (2006 August 5; blue) and the pointed observations (0804550101 and 0841660301, Table 1; red). |
J0457 was also monitored in the V-band between end of 2003 and February 2020. Unfortunately, during the deep dip only one V-band measurement is available (Fig. 18). The V − I colour index as function of I is presented in Fig. 19. Before the major outburst, the system is characterised by reddening when becoming brighter (black data points in Figs. 17–19). However, during the major outburst, V − I did not increase further (red data points). During the rising part of the light curve after the deep dip, V − I followed the relation from the first part of the light curve and reached maximum values when the pre-outburst level was recovered (green).
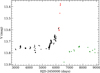 |
Fig. 18. OGLE V-band light curve of J0457 between 2003 December 23 and 2020 February 18. See also Fig. 17. |
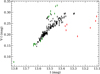 |
Fig. 19. J0457: OGLE V − I colour index vs. I (interpolated linearly to the times of the V-band measurements). |
The three outbursts before the giant one indicate a regular pattern, which might be related to the orbital period of the BeXRB system. To remove the long-term trends, following Maitra et al. (2019), we first subtracted a smoothed light curve (derived by applying a Savitzky–Golay filter with a window length of 401 data points; Savitzky & Golay 1964) from the OGLE I-band light curve. To search for periodic variations, we again applied the LS periodogram analysis. We first used I-band data between 13.2 mag and 13.6 mag to clip the largest variations. The LS periodogram revealed a period of 288 days. However, when marking the times of expected outburst maxima in the light curve, no other peak with the right phase can be recognised. Alternatively, we selected only times between HJD 2455000 and 2456250 (the three strong outbursts) and a period of 273.5 days was found. This fits the three outbursts very well, but again, no other peak in phase could be identified.
2.6.3. RX J0524.2–6620
The position of the most probable counterpart of J0524, namely, 2MASS 05241180 − 6620512, was monitored during the OGLE-IV survey in two overlapping fields. For the I-band light curve, we combined data sets LMC505.26.12019 and LMC519.16.21009; apart from the standard calibration, we identified that photometric magnitudes from the two fields differ by about 0.03 mag, which we subtracted from the second data-set in order to match the photometric values. For the V-band light curve we combined the data sets LMC505.26.16914 and LMC519.16.20240, while a correction of 0.027 mag was added.
The I band is characterised by “outbursts” with patterns that resemble a quasi-periodic behaviour (see Fig. 20). The early light curve (MJD 55200–56500) shows several short flares, with durations of about or less than 100 days. At later times (MJD 56500–59000), the light curve is characterised by four larger events with year-long rise and fall times. To investigate the presence of a periodic signal, we computed the LS periodogram for the complete light curve, but also for two separate intervals: the early part (i.e. before MJD 56800) and the later part. The periodogram revealed significant peaks consistent with quasi-periodic behaviour and in agreement with the flaring periods. Otherwise, apart from some peaks around 1 day, no other periodic signal was evident.
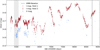 |
Fig. 20. OGLE I and V band light curves of J0524. The vertical dashed red line indicates the time of the XMM-Newton observation. The shaded region marks the period with more dense monitoring in the V filter and can be used to track colour evolution through a “flare”. |
Similarly to the other two systems, we interpolated the I-band magnitudes and computed the V − I colour index (see Fig. 21). There appears to be a general trend of being redder when brighter. Moreover, when focusing on the earlier OGLE epochs and in the range of MJD 55400–55600, where OGLE covered a full “flare”, we studied this evolution in more detail. In doing so, we find a hysteresis loop, showing that as the source becomes brighter it also becomes redder; however, when the maximum is reached, the decay track is much redder than the rise for the same I-band magnitude.
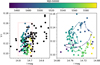 |
Fig. 21. J0524: OGLE V − I colour index vs. I (interpolated linearly to the times of the V-band measurements). Left panel: we plot the complete data set. Right panel: we restrict the times to MJD 55400–55600 (see shaded region in Fig. 20). Apart from a general trend of redder when brighter, smoothing the date reveals a hysteresis loop (see right panel), where the rise of a flare is bluer than the decay. |
3. Discussion
From a search for new HMXBs in our XMM-Newton observations of supernova remnant candidates in the supergiant shells LMC5 and LMC7 in the north and west of the LMC, we report the discovery of three new BeXRBs. Two of them show X-ray pulsations with 317.7 s and 360.7 s.
3.1. XMMU J045315.1–693242
J0453 was detected in an XMM-Newton observation from January 2018. The X-ray spectrum is of low statistical quality and can be modelled with an absorbed power law with a photon index of ∼1.2, consistent with values reported from other BeXRBs in the Magellanic Clouds, but on the steep end of the distribution (90% of the SMC systems show indices between 0.74 and 1.26, Haberl & Pietsch 2004). The inferred X-ray luminosity of 6.5 × 1034 erg s−1 suggests a low-luminosity BeXRB without any detected outburst brighter than ∼2.5 × 1036 erg s−1.
We identify a V = 15.5 mag star as an optical counterpart that exhibits the typical brightness and colours of a Be star in the LMC. Photometric data obtained by OGLE in the I-band (Fig. 12) reveals periodic variations around a mean value of ∼15.6 mag, at least for the first 9.5 years. An LS periodogram of the I-band light curve from this epoch (Fig. 15) shows two significant peaks at periods of 49.6 days and 24.8 days, the shorter being the first harmonic of the longer (fundamental) period. We suggest the 49.6 days as orbital period of the binary system, but cannot rule out 24.8 days completely. If the orbital period is 24.8 days, regularly every second orbit the optical outburst must be weak or often absent, as can be seen from Fig. 16, where the I-band light curve is folded with 49.6 days. On the other hand an orbital period of 49.6 days is also remarkable as it shows two outbursts per orbit, about 0.5 in phase apart, with one considerably brighter than the other (Fig. 16). To our knowledge, two optical outbursts per binary orbit have not been reported from other BeXRBs However, an NS in a nearly circular orbit, which is tilted relative to the Be disk, approaches the disk twice about 0.5 in phase apart. Disk material may be pushed away and towards us during the two encounters that could be partly be hidden by the disk and naturally lead to two different optical outbursts. A similar, but in some respects different, phenomenon was reported by Monageng et al. (2022) for the BeXRB pulsar SXP 15.3 in the SMC. Also for that system, two periodicities, 74.5 d and 148 d, were found from optical (OGLE) and X-rays (Swift). However, the difference is that the optical outbursts occur regularly, but X-ray outbursts only for every second optical outburst. The authors discuss this similarly with a misalignment between the Be disk and the orbital plane of the NS, which is in a nearly circular orbit. No clear X-ray outbursts are known from J0453, which suggests that the NS does not approach the Be disk as close as in the case of SXP 15.3, but still sufficiently near to disturb it.
The V − I colour variations during the first part of the light curves (Fig. 14) are weakly correlated with brightness (I). A marginal trend of reddening with brightness is visible. When the source became brighter than I = 15.42 mag, the V − I index stayed at a constant level. Usually, colour indices that show little changes with brightness indicate a stable circumstellar disk (Reig & Fabregat 2015). The saturation of V − I during the bright, long outburst may suggest that the total emission from the star (bluer) and the disk (redder) is completely dominated by the disk emission, maybe because the star is fully obscured by the disk. A SALT-HRS spectrum as we have obtained it for the other two systems could could help to constrain the inclination and size of the disk to verify such a scenario.
3.2. XMMU J045736.9–692727
J0457 was in the FoV of two pointed XMM-Newton observations. The higher luminosity by a factor of 5–10, compared to J0453, allowed us to do a detailed spectral and temporal analysis. The X-ray spectrum is well represented by an absorbed power law with photon index 0.6, which is on the lower end of the distribution (Haberl & Pietsch 2004) and indicates a harder spectrum. The X-ray luminosity between the two XMM-Newton and other observations back to 1993 with ROSAT changed by a factor of about two, while on shorter timescales of hours, similar variations are seen.
We discovered X-ray pulsations in the flux of J0457, with a period of ∼317.7 s. The LS periodogram shows peaks at the fundamental frequency and three harmonics, caused by a highly complex pulse profile (Fig. 7) with a deep narrow (0.1 in phase) dip. Pulse profiles of Be/X-ray binary pulsars are known to be complex in soft (< 10 keV) X-ray energy ranges with multiple emission peaks and sometimes narrow absorption dips, which go deeper than the broader minima between emission peaks. Phase-resolved spectroscopy revealed that matter in the accretion streams partially obscures the emitted radiation causing the dips (e.g. Maitra et al. 2012; Naik 2013). Examples in the Magellanic Clouds are Swift J053041.9−665426 = LXP 28.8, which shows a narrow dip, very similar to J0457, with a width of ∼0.1 in phase (Vasilopoulos et al. 2013), but less well resolved due to a lower statistical quality of the pulse profile. This is also the case for XMMU J005929.0−723703 = SXP 202b, with possibly two dips (widths of 0.1 and 0.13 in phase, Haberl et al. 2008).
The dip seen in the pulse profiles of J0457 shows a peculiar phase dependence with energy. It is broader in the soft (0.2–2.0 keV) band as compared to the hard (2.0–12 keV) band, which results in an HR increase at the beginning and end of the dip. However, when the dip is deepest in the hard band, the HR shows a sudden drop. This resembles a partial eclipse of the X-ray source, which is surrounded by dense material that leads to increased absorption before and after the eclipse. An eclipse-like event could originate from a special viewing geometry when our line of sight passes parallel through the accretion column onto one of the magnetic poles of the neutron star. To further explore this scenario, data of higher statistical quality are required to allow a detailed pulse phase spectroscopy with sufficiently fine phase bins to resolve the dip and test more complex absorption models.
As optical counterpart we identify 2MASS 04573695−6927275, a V = 14.2 mag star. Brightness and colours are typical for a Be star in the LMC. Optical spectroscopy with SALT HRS confirms the Be nature and revealed complex Hα and Hβ emission line profiles. From the modelling of the Hα line profiles of Be stars (Silaj et al. 2010), such complex structures are not expected. An axisymmetric disk is expected to produce a double-peaked, symmetric line profile, while asymmetric profiles are thought to arise from one-armed density waves in the circumstellar disk. These models were developed for isolated Be stars, the presence of a neutron star in a BeXRB likely leads to additional distortions of the disk and may be the reason for the higher complexity of the Hα emission observed from J0457.
A simple modelling of the Hα profile with multiple Gaussian lines suggests four emission lines: one broad and three narrower (Table 4), which indicate velocity differences of the emitting gas of up to Δv = 125 km s−1 along the line of sight. The two lines, which are responsible for the double-peak appearance, are located relatively symmetrical to the centre of the broad line, with Δv ∼ 66 km s−1. Assuming this is caused by Keplerian rotation, we can constrain the distance of the emitting gas to the central star. With a Keplerian velocity of vK =  , with r the distance of the emitting gas to the central star with mass M and G the gravitational constant, we obtain:
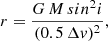 (2)
(2)
with i the disk inclination (Monageng et al. 2017). Adopting M = 17 M⊙ for a star with spectral type B0, typical for BeXRBs, results in r = 2.1sin2i × 1012 m. This value, together with the relatively small equivalent width of −8 Å, which indicates a small disk, requires a small inclination angle (Monageng et al. 2017; Grundstrom & Gies 2006). The stronger blue-shifted line may be the result of a one-armed oscillation, with an enhanced density region on the blue end of the disk. The additional line at −90 km s−1 suggests that this region also extends to the inner disk (r ∝ 1/(Δv)2). The Hβ line, which shows a very similar profile, is consistent with this picture. The derived Δv of 100 km s−1 results in a factor of 2.3 smaller distance from the star.
The OGLE I and V light curves show a very strong increase in brightness over about 850 days, which is superimposed by regular outbursts (which repeat every ∼274 days) with an amplitude of ∼0.15 mag (in I). After the brightness reached a maximum of 13.1 mag a sudden drop by ∼1 mag occurred within 73–165 days. Because the minimum was not sampled (gap of 92 days), the drop by 1 mag needs to be regarded as a lower limit. After the drop the brightness recovered to its pre-outburst level. A similar recovery was also recorded at the beginning of the OGLE monitoring, about 4395 days (12 years) before the one in August 2013. Unfortunately, the answer to whether the first dip was also preceded by a similar outburst will remain unknown.
The behaviour of J0457 in the optical is very similar to an outburst from 3XMM J051259.8−682640 (Haberl et al. 2017), however, it is even more extreme in amplitude. 3XMM J051259.8−682640 showed three deep dips, which occurred 1350 days (3.7 years) apart, but only one of the three was preceded by an outburst. Haberl et al. (2017) proposed that such regular dips might indicate the orbital period of the binary system and the dips originate from the interaction of the neutron star with the circumstellar disk of the Be star when the NS approaches the Be star in an eccentric orbit. This could lead to a (partial) disruption of the disk, which is replenished until the NS returns. The more than threefold longer dipping (orbital?) period in J0457 might allow the disk to obtain a larger size than in 3XMM J051259.8−682640, resulting in a stronger outburst and deeper dip.
However, the OGLE light curve of J0457 also exhibits a shorter periodicity around 274 days, which originates from three strong outbursts that occurred during the rise to the brightness maximum. While this period is typical for binary periods of BeXRBs, it is not stable throughout the full light curve. The other smaller outbursts are not in phase with the stronger ones.
Most of the time, J0457 exhibited a linear correlation of V − I colour with brightness. In particular, at the faintest level during the deep dip, the system was bluest and reddened with brightness. Reddening with brightness is also observed from a number of BeXRBs in the Magellanic Clouds (Treiber et al. 2021; Haberl et al. 2017; Vasilopoulos et al. 2014; Coe et al. 2012). Such a behaviour is expected during disk build-up when more emission from the cooler disk is contributing. During the final rise to a maximum brightness of J0457, the colour index reached an apparent limit, suggesting that the circumstellar disk completely dominated the emission.
3.3. RX J0524.2–6620
The X-ray spectrum of the system may be fitted by an absorbed power-law component. However, the presence of residuals in the high energies dictates the use of models with more free parameters. These residuals are often seen in BeXRBs in the MCs (e.g. Sturm et al. 2014; Vasilopoulos et al. 2020). Adding a high energy cut-off flattens the residuals in a more physical way than adding an additional thermal continuum component. Specifically we find that adding a blackbody component with temperature of ∼1.95 keV and size of ∼460 m provides the best statistical fit. Although such emission feature has been seen in persistent long period Galactic BeXRBs, the component is typically less hot (i.e. ≲1.4 keV) and contributes a smaller percentage of the flux (i.e. ≲40%) in the 0.3–10.0 keV band (La Palombara et al. 2013).
As the optical counterpart, we identified a V = 14.9 mag star. The brightness, colours, and the Hα emission seen in our SALT HRS spectrum confirm the nature of J0524 as a BeXRB. The Hα line profile is also structured with two broad and clearly resolved lines. Most likely, these originate from opposite sides of the circumstellar disk and are shifted with Δv by about 178 km s−1. Following Eq. (2), based on the same assumptions as for J0457, we derived r = 2.9sin2i × 1011 m. Monageng et al. (2017) found smaller disk sizes (by a factor of about ten) from Galactic BeXRBs during epochs when their Hα line EQW was measured around −4 Å, which is similar to the value of J0524. This would indicate i ∼ 20°.
The optical light curve of J0524 shows characteristic flares, however, no clear periodic behaviour is evident. Long-term changes in optical magnitude are an ubiquitous characteristic of BeXRBs and are generally attributed to the Be disk build-up and disappearance. Optical flares might also mark the interaction of the NS and the Be disk during periastron passage. In fact, given that the orientation of the disk can change due to precession, the resulting flares can also be quasi-periodic in nature as seen in the characteristic case of RX J0529.8−6556 (Treiber et al. 2021), but also predicted by simulations (Martin & Franchini 2021).
The colour magnitude diagram of J0524 (see Fig. 21) shows a characteristic hysteresis loop. This loop-like track is evident in a number of BeXRBs in the MCs (e.g. Maggi et al. 2013) and in isolated Be stars as well (de Wit et al. 2006). This evolutionary track might be explained by a disk that grows during the rise, but becomes hollow during the decay, thus forming a ring of a somewhat equal brightness that is nonetheless redder in colour.
4. Conclusions
Our discovery of two new BeXRB pulsars, with periods of 317.7 s from J0457 and 360.7 s from J0524, increases the number of known HMXB pulsars in our neighbour galaxy to 25. Their pulse period distribution is shown in Fig. 22. Knigge et al. (2011) first reported a bimodal distribution of the spin periods of BeXRB binary pulsars in the LMC, the SMC, and the Milky Way with two maxima at around 10 s and several 100 s, which are most clearly seen for the SMC systems (Haberl & Sturm 2016). Although the number of LMC systems has increased considerably over the last years, there is still no clear bimodal distribution visible from the LMC. Moreover, the LMC hosts a higher number of supergiant HMXBs and, possibly, a higher relative abundance of pulsars with NS spin periods longer than ∼1000 s (e.g. Clark et al. 2015; Vasilopoulos et al. 2018; Maitra et al. 2021b), indicating the presence of a younger population. The continuation of targeted and serendipitous X-ray observations of the LMC will likely allow for more of its HMXB pulsar population to be revealed and pave the way for more definitive conclusions.
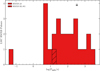 |
Fig. 22. Spin period distribution for 25 HMXB pulsars in the LMC. Apart from LMC X-4, which is a supergiant system powered by Roche-Lobe overflow, all other pulsars orbit a Be star. The two arrows mark the periods of the two newly discovered systems. |
Available at https://heasarc.gsfc.nasa.gov/xanadu/xspec/
Extracted using NASA’s HEASARC web interface https://heasarc.gsfc.nasa.gov/cgi-bin/Tools/w3nh/w3nh.pl
Acknowledgments
This work used observations obtained with XMM-Newton, an ESA science mission with instruments and contributions directly funded by ESA Member States and NASA. The XMM-Newton project is supported by the DLR and the Max Planck Society. This research has made use of the VizieR catalogue access tool, CDS, Strasbourg, France. The original description of the VizieR service was published in A&AS 143, 23. This work has made use of data from the European Space Agency (ESA) mission Gaia (https://www.cosmos.esa.int/gaia), processed by the Gaia Data Processing and Analysis Consortium (DPAC, https://www.cosmos.esa.int/web/gaia/dpac/consortium). Funding for the DPAC has been provided by national institutions, in particular the institutions participating in the Gaia Multilateral Agreement.
References
- Antoniou, V., & Zezas, A. 2016, MNRAS, 459, 528 [Google Scholar]
- Antoniou, V., Zezas, A., Hatzidimitriou, D., & Kalogera, V. 2010, ApJ, 716, L140 [NASA ADS] [CrossRef] [Google Scholar]
- Arnaud, K. A. 1996, in Astronomical Data Analysis Software and Systems V, ASP Conf. Ser., 101, 17 [Google Scholar]
- Ballester, P. 1992, Eur. South. Obs. Conf. Workshop Proc., 41, 177 [NASA ADS] [Google Scholar]
- Buckley, D. A. H., Swart, G. P., & Meiring, J. G. 2006, in SPIE Conf. Ser., ed. L. M. Stepp, 6267, 62670Z [NASA ADS] [Google Scholar]
- Clark, J. S., Bartlett, E. S., Broos, P. S., et al. 2015, A&A, 579, A131 [NASA ADS] [CrossRef] [EDP Sciences] [Google Scholar]
- Coe, M. J., Haberl, F., Sturm, R., et al. 2012, MNRAS, 424, 282 [NASA ADS] [CrossRef] [Google Scholar]
- Crause, L. A., Sharples, R. M., Bramall, D. G., et al. 2014, in Ground-based and Airborne Instrumentation for Astronomy V, eds. S. K. Ramsay, I. S. McLean, & H. Takami, SPIE Conf. Ser., 9147, 91476T [NASA ADS] [Google Scholar]
- Crawford, S. M. 2015, Astrophysics Source Code Library [record ascl:1511] [Google Scholar]
- Cutri, R. M., Skrutskie, M. F., van Dyk, S., et al. 2003, VizieR On-line Data Catalog: II/246 [Google Scholar]
- de Wit, W. J., Lamers, H. J. G. L. M., Marquette, J. B., & Beaulieu, J. P. 2006, A&A, 456, 1027 [NASA ADS] [CrossRef] [EDP Sciences] [Google Scholar]
- Dickey, J. M., & Lockman, F. J. 1990, ARA&A, 28, 215 [Google Scholar]
- Evans, I. N., Primini, F. A., Glotfelty, K. J., et al. 2010, ApJS, 189, 37 [NASA ADS] [CrossRef] [Google Scholar]
- Gaia Collaboration (Brown, A. G. A., et al.) 2021, A&A, 649, A1 [NASA ADS] [CrossRef] [EDP Sciences] [Google Scholar]
- Gaia Collaboration (Prusti, T., et al.) 2016, A&A, 595, A1 [NASA ADS] [CrossRef] [EDP Sciences] [Google Scholar]
- Gregory, P. C., & Loredo, T. J. 1996, ApJ, 473, 1059 [NASA ADS] [CrossRef] [Google Scholar]
- Grundstrom, E. D., & Gies, D. R. 2006, ApJ, 651, L53 [NASA ADS] [CrossRef] [Google Scholar]
- Haberl, F., & Pietsch, W. 2004, A&A, 414, 667 [NASA ADS] [CrossRef] [EDP Sciences] [Google Scholar]
- Haberl, F., & Sturm, R. 2016, A&A, 586, A81 [NASA ADS] [CrossRef] [EDP Sciences] [Google Scholar]
- Haberl, F., Dennerl, K., & Pietsch, W. 2003, A&A, 406, 471 [NASA ADS] [CrossRef] [EDP Sciences] [Google Scholar]
- Haberl, F., Eger, P., & Pietsch, W. 2008, A&A, 489, 327 [NASA ADS] [CrossRef] [EDP Sciences] [Google Scholar]
- Haberl, F., Israel, G. L., Rodriguez Castillo, G. A., et al. 2017, A&A, 598, A69 [NASA ADS] [CrossRef] [EDP Sciences] [Google Scholar]
- Haberl, F., Salganik, A., Maitra, C., et al. 2021, ATel, 15133, 1 [NASA ADS] [Google Scholar]
- Kahabka, P. 2002, A&A, 388, 100 [NASA ADS] [CrossRef] [EDP Sciences] [Google Scholar]
- Klus, H., Bartlett, E. S., Bird, A. J., et al. 2013, MNRAS, 428, 3607 [NASA ADS] [CrossRef] [Google Scholar]
- Kniazev, A. Y., Gvaramadze, V. V., & Berdnikov, L. N. 2016, MNRAS, 459, 3068 [NASA ADS] [CrossRef] [Google Scholar]
- Knigge, C., Coe, M. J., & Podsiadlowski, P. 2011, Nature, 479, 372 [NASA ADS] [CrossRef] [Google Scholar]
- König, O., Saxton, R. D., Kretschmar, P., et al. 2022, Astron. Comput., 38, 100529 [CrossRef] [Google Scholar]
- La Palombara, N., Mereghetti, S., Sidoli, L., Tiengo, A., & Esposito, P. 2013, Mem. Soc. Astron. It., 84, 626 [NASA ADS] [Google Scholar]
- Lomb, N. R. 1976, Ap&SS, 39, 447 [Google Scholar]
- Maggi, P., Haberl, F., Sturm, R., et al. 2013, A&A, 554, A1 [NASA ADS] [CrossRef] [EDP Sciences] [Google Scholar]
- Maggi, P., Haberl, F., Kavanagh, P. J., et al. 2016, A&A, 585, A162 [NASA ADS] [CrossRef] [EDP Sciences] [Google Scholar]
- Maitra, C., Paul, B., & Naik, S. 2012, MNRAS, 420, 2307 [NASA ADS] [CrossRef] [Google Scholar]
- Maitra, C., Haberl, F., Filipović, M. D., et al. 2019, MNRAS, 490, 5494 [Google Scholar]
- Maitra, C., Haberl, F., Maggi, P., et al. 2021a, MNRAS, 504, 326 [NASA ADS] [CrossRef] [Google Scholar]
- Maitra, C., Haberl, F., Vasilopoulos, G., et al. 2021b, A&A, 647, A8 [NASA ADS] [CrossRef] [EDP Sciences] [Google Scholar]
- Martin, R. G., & Franchini, A. 2021, ApJ, 922, L37 [NASA ADS] [CrossRef] [Google Scholar]
- Meaburn, J. 1980, MNRAS, 192, 365 [NASA ADS] [CrossRef] [Google Scholar]
- Monageng, I. M., McBride, V. A., Coe, M. J., Steele, I. A., & Reig, P. 2017, MNRAS, 464, 572 [NASA ADS] [CrossRef] [Google Scholar]
- Monageng, I. M., Coe, M. J., Townsend, L. J., et al. 2022, MNRAS, 501, 6075 [NASA ADS] [CrossRef] [Google Scholar]
- Naik, S. 2013, ASI Conf. Ser., 8, 103 [NASA ADS] [Google Scholar]
- Pietrzyński, G., Graczyk, D., Gieren, W., et al. 2013, Nature, 495, 76 [Google Scholar]
- Reig, P. 2011, Ap&SS, 332, 1 [Google Scholar]
- Reig, P., & Fabregat, J. 2015, A&A, 574, A33 [NASA ADS] [CrossRef] [EDP Sciences] [Google Scholar]
- Rolleston, W. R. J., Trundle, C., & Dufton, P. L. 2002, A&A, 396, 53 [NASA ADS] [CrossRef] [EDP Sciences] [Google Scholar]
- Savitzky, A., & Golay, M. J. E. 1964, Anal. Chem., 36, 1627 [Google Scholar]
- Saxton, R. D., Read, A. M., Esquej, P., et al. 2008, A&A, 480, 611 [NASA ADS] [CrossRef] [EDP Sciences] [Google Scholar]
- Saxton, R. D., König, O., Descalzo, M., et al. 2022, Astron. Comput., 38, 100531 [NASA ADS] [CrossRef] [Google Scholar]
- Scargle, J. D. 1982, ApJ, 263, 835 [Google Scholar]
- Silaj, J., Jones, C. E., Tycner, C., Sigut, T. A. A., & Smith, A. D. 2010, ApJS, 187, 228 [NASA ADS] [CrossRef] [Google Scholar]
- Stahl, O., Kaufer, A., & Tubbesing, S. 1999, in Optical and Infrared Spectroscopy of Circumstellar Matter, eds. E. Guenther, B. Stecklum, & S. Klose, ASP Conf. Ser., 188, 331 [NASA ADS] [Google Scholar]
- Strüder, L., Briel, U., Dennerl, K., et al. 2001, A&A, 365, L18 [Google Scholar]
- Sturm, R., Haberl, F., Pietsch, W., et al. 2013, A&A, 558, A3 [NASA ADS] [CrossRef] [EDP Sciences] [Google Scholar]
- Sturm, R., Haberl, F., Vasilopoulos, G., et al. 2014, MNRAS, 444, 3571 [NASA ADS] [CrossRef] [Google Scholar]
- Tanaka, Y. 1986, in Observations of Compact X-Ray Sources, eds. D. Mihalas, & K. H. A. Winkler, 255, 198 [NASA ADS] [Google Scholar]
- Treiber, H., Vasilopoulos, G., Bailyn, C. D., et al. 2021, MNRAS, 503, 6187 [CrossRef] [Google Scholar]
- Turner, M. J. L., Abbey, A., Arnaud, M., et al. 2001, A&A, 365, L27 [CrossRef] [EDP Sciences] [Google Scholar]
- Udalski, A., Szymanski, M. K., Soszynski, I., & Poleski, R. 2008, Acta Astron., 58, 69 [NASA ADS] [Google Scholar]
- Udalski, A., Szymański, M. K., & Szymański, G. 2015, Acta Astron., 65, 1 [NASA ADS] [Google Scholar]
- van Jaarsveld, N., Buckley, D. A. H., McBride, V. A., et al. 2018, MNRAS, 475, 3253 [Google Scholar]
- Vasilopoulos, G., Maggi, P., Haberl, F., et al. 2013, A&A, 558, A74 [NASA ADS] [CrossRef] [EDP Sciences] [Google Scholar]
- Vasilopoulos, G., Haberl, F., Sturm, R., Maggi, P., & Udalski, A. 2014, A&A, 567, A129 [NASA ADS] [CrossRef] [EDP Sciences] [Google Scholar]
- Vasilopoulos, G., Maitra, C., Haberl, F., Hatzidimitriou, D., & Petropoulou, M. 2018, MNRAS, 475, 220 [Google Scholar]
- Vasilopoulos, G., Ray, P. S., Gendreau, K. C., et al. 2020, MNRAS, 494, 5350 [NASA ADS] [CrossRef] [Google Scholar]
- Wilms, J., Allen, A., & McCray, R. 2000, ApJ, 542, 914 [Google Scholar]
- XMM-SSC. 2018, VizieR Online Data Catalog: IX/53 [Google Scholar]
- Zaritsky, D., Harris, J., Thompson, I. B., & Grebel, E. K. 2004, AJ, 128, 1606 [Google Scholar]
All Tables
XMM-Newton observations of XMMU J045315.1−693242, XMMU J045736.9−692727, and RX J0524.2−6620.
Optical counterparts of XMMU J045315.1−693242, XMMU J045736.9−692727, and RX J0524.2−6620.
All Figures
|
Fig. 1. EPIC spectra of J0453 together with the best-fit absorbed power-law model (histograms). The EPIC-pn count rate (data and model shown in black) is reduced due to the source location on a chip gap. No MOS1 data are available, MOS2 data are marked in red. |
| In the text | |
|
Fig. 2. EPIC spectra of J0457 from the two XMM-Newton observations (Table 1) together with the best-fit absorbed power law. The EPIC-pn, MOS1 and MOS2 data and best-fit model are shown in black (blue), green (light blue), and red (magenta) for obsID 0804550101 (0841660301), respectively. |
| In the text | |
|
Fig. 3. EPIC spectra of J0524 together with the best-fit absorbed power-law model with high-energy cutoff (fdcut, see Table 3) as histograms. The EPIC-pn, MOS1 and MOS2 data and best-fit model are shown in black, green, and red, respectively. |
| In the text | |
|
Fig. 4. Background-subtracted X-ray light curve of J0453 in the 0.2–12 keV energy band with time bins of 600 s. The light curve is vignetting- and PSF-corrected and it combines EPIC-pn and MOS2 data. Time zero corresponds to MJD 58142.5517 (2018 January 24, 13:19:28.7 UT). |
| In the text | |
|
Fig. 5. Background-subtracted X-ray light curve of J0457 from observation 0804550101 in the 0.2–12 keV energy band with time bins of 318 s (corresponding to the pulse period). The light curve is vignetting- and PSF-corrected and combines EPIC-pn, MOS1 and MOS2 data. Time zero corresponds to MJD 58063.1707 (2017 November 6, 04:05:50.6 UT). |
| In the text | |
|
Fig. 6. LS periodogram of J0457. Pulsations are clearly detected with a fundamental frequency corresponding to a period of ∼318 s together with signals at three harmonic frequencies. The red dashed line marks the 3σ confidence level. |
| In the text | |
|
Fig. 7. Corrected EPIC-pn light curves folded with 317.72 s showing the pulse profile of J0457 in the energy bands of 0.2–2.0 keV (soft), 2.0–12 keV (hard) and total 0.2–12 keV. The intensity profiles are normalised to their mean count rates, 0.189 cts s−1, 0.268 cts s−1, and 0.457 cts s−1 for the soft, hard, and total energy bands, respectively. For the hardness ratio (HR), the count rate in the hard band was divided by that in the soft band. A deep, sharp dip can be seen, which causes the high number of harmonic frequency peaks in the periodogram (Fig. 6). |
| In the text | |
|
Fig. 8. Background-subtracted X-ray light curve of J0524 in the 0.2–12 keV energy band with time bins of 630.7 s (corresponding to the pulse period). The light curve is vignetting- and PSF-corrected and it combines EPIC-pn, MOS1, and MOS2 data. |
| In the text | |
|
Fig. 9. Corrected EPIC-pn light curve folded with 360.7 s showing the pulse profile of J0524 in the energy band of 0.2–12 keV, normalised to the mean count rate of 0.124 cts s−1. |
| In the text | |
|
Fig. 10. SALT HRS spectra of J0457 around the Hα (top) and Hβ (bottom) lines. Both lines are in emission and highly structured. The spectrum around Hβ is smoothed using a rolling average filter with kernel size of 5. The wavelengths shifted to the rest system of the LMC are indicated by the green vertical lines. |
| In the text | |
|
Fig. 11. SALT HRS spectrum of J0524 around the Hα line, marked as in Fig. 10. The narrow line is a residual feature from sky background subtraction. The spectrum is smoothed using a rolling average filter with kernel size 5. |
| In the text | |
|
Fig. 12. OGLE I-band light curve of J0453 between 2001 September 14 and 2020 March 13. The vertical dashed red line indicates the time of the XMM-Newton observation. |
| In the text | |
|
Fig. 13. OGLE V-band light curve of J0453 between 2003 December 28 and 2016 December 18. The outburst is marked in red. The XMM-Newton observation was performed after the last V-band observations. See also Fig. 12. |
| In the text | |
|
Fig. 14. J0453: OGLE V − I colour index vs. I (interpolated linearly to the times of the V-band measurements). As in Fig. 13, the data taken during the outburst are marked in red. |
| In the text | |
|
Fig. 15. LS periodogram of the OGLE I-band data (before the large outburst, HJD < 2456000 days) of J0453. The arrows mark the highest peaks at 49.61 days and 24.81 days. The red and black dashed lines mark the 95% and 99% confidence levels. |
| In the text | |
|
Fig. 16. Folded OGLE I-band light curve of J0453 with a period of 49.61 days, repeated for two cycles for clarity. |
| In the text | |
|
Fig. 17. OGLE I-band light curve of J0457 between 2001 September 14 and 2020 March 13. The vertical dashed lines indicate the times of the XMM-Newton slew detection (2006 August 5; blue) and the pointed observations (0804550101 and 0841660301, Table 1; red). |
| In the text | |
|
Fig. 18. OGLE V-band light curve of J0457 between 2003 December 23 and 2020 February 18. See also Fig. 17. |
| In the text | |
|
Fig. 19. J0457: OGLE V − I colour index vs. I (interpolated linearly to the times of the V-band measurements). |
| In the text | |
|
Fig. 20. OGLE I and V band light curves of J0524. The vertical dashed red line indicates the time of the XMM-Newton observation. The shaded region marks the period with more dense monitoring in the V filter and can be used to track colour evolution through a “flare”. |
| In the text | |
|
Fig. 21. J0524: OGLE V − I colour index vs. I (interpolated linearly to the times of the V-band measurements). Left panel: we plot the complete data set. Right panel: we restrict the times to MJD 55400–55600 (see shaded region in Fig. 20). Apart from a general trend of redder when brighter, smoothing the date reveals a hysteresis loop (see right panel), where the rise of a flare is bluer than the decay. |
| In the text | |
|
Fig. 22. Spin period distribution for 25 HMXB pulsars in the LMC. Apart from LMC X-4, which is a supergiant system powered by Roche-Lobe overflow, all other pulsars orbit a Be star. The two arrows mark the periods of the two newly discovered systems. |
| In the text | |
Current usage metrics show cumulative count of Article Views (full-text article views including HTML views, PDF and ePub downloads, according to the available data) and Abstracts Views on Vision4Press platform.
Data correspond to usage on the plateform after 2015. The current usage metrics is available 48-96 hours after online publication and is updated daily on week days.
Initial download of the metrics may take a while.