Open Access
Fig. 14.
Download original image
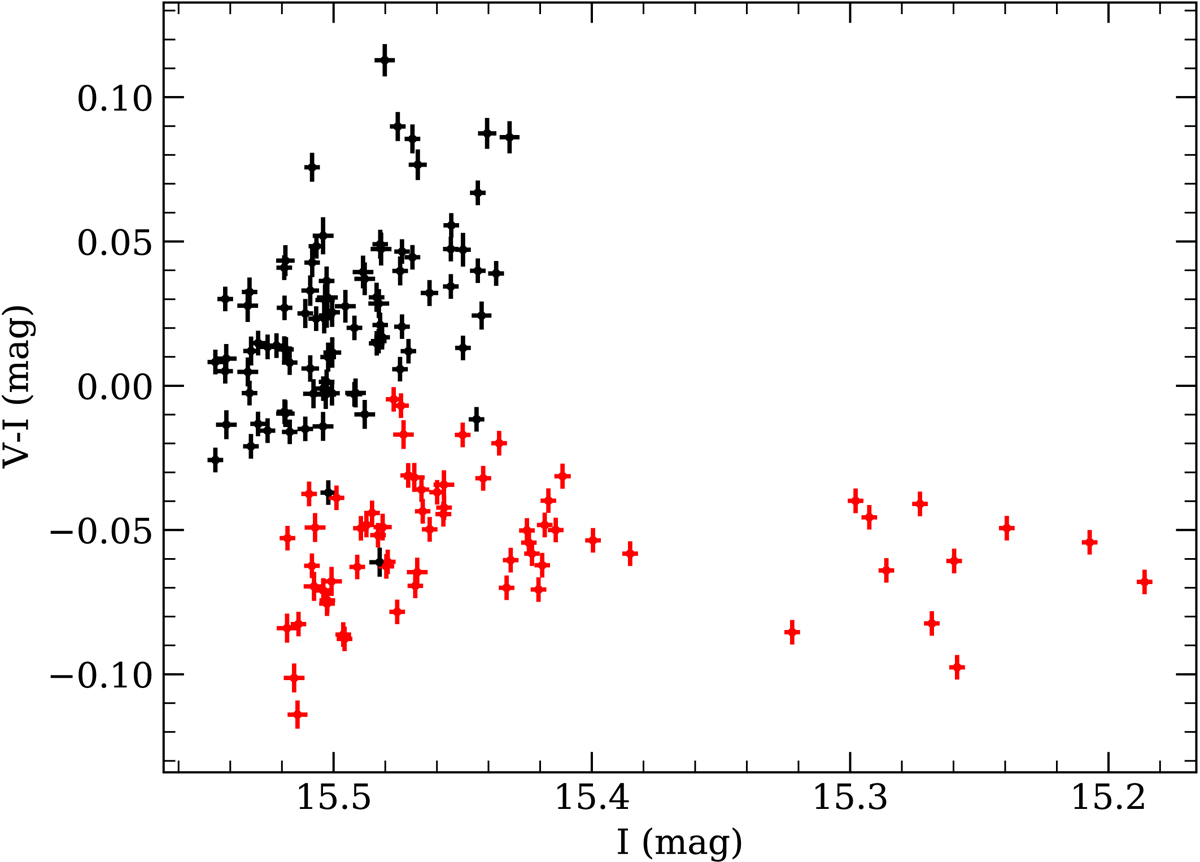
J0453: OGLE V − I colour index vs. I (interpolated linearly to the times of the V-band measurements). As in Fig. 13, the data taken during the outburst are marked in red.
Current usage metrics show cumulative count of Article Views (full-text article views including HTML views, PDF and ePub downloads, according to the available data) and Abstracts Views on Vision4Press platform.
Data correspond to usage on the plateform after 2015. The current usage metrics is available 48-96 hours after online publication and is updated daily on week days.
Initial download of the metrics may take a while.