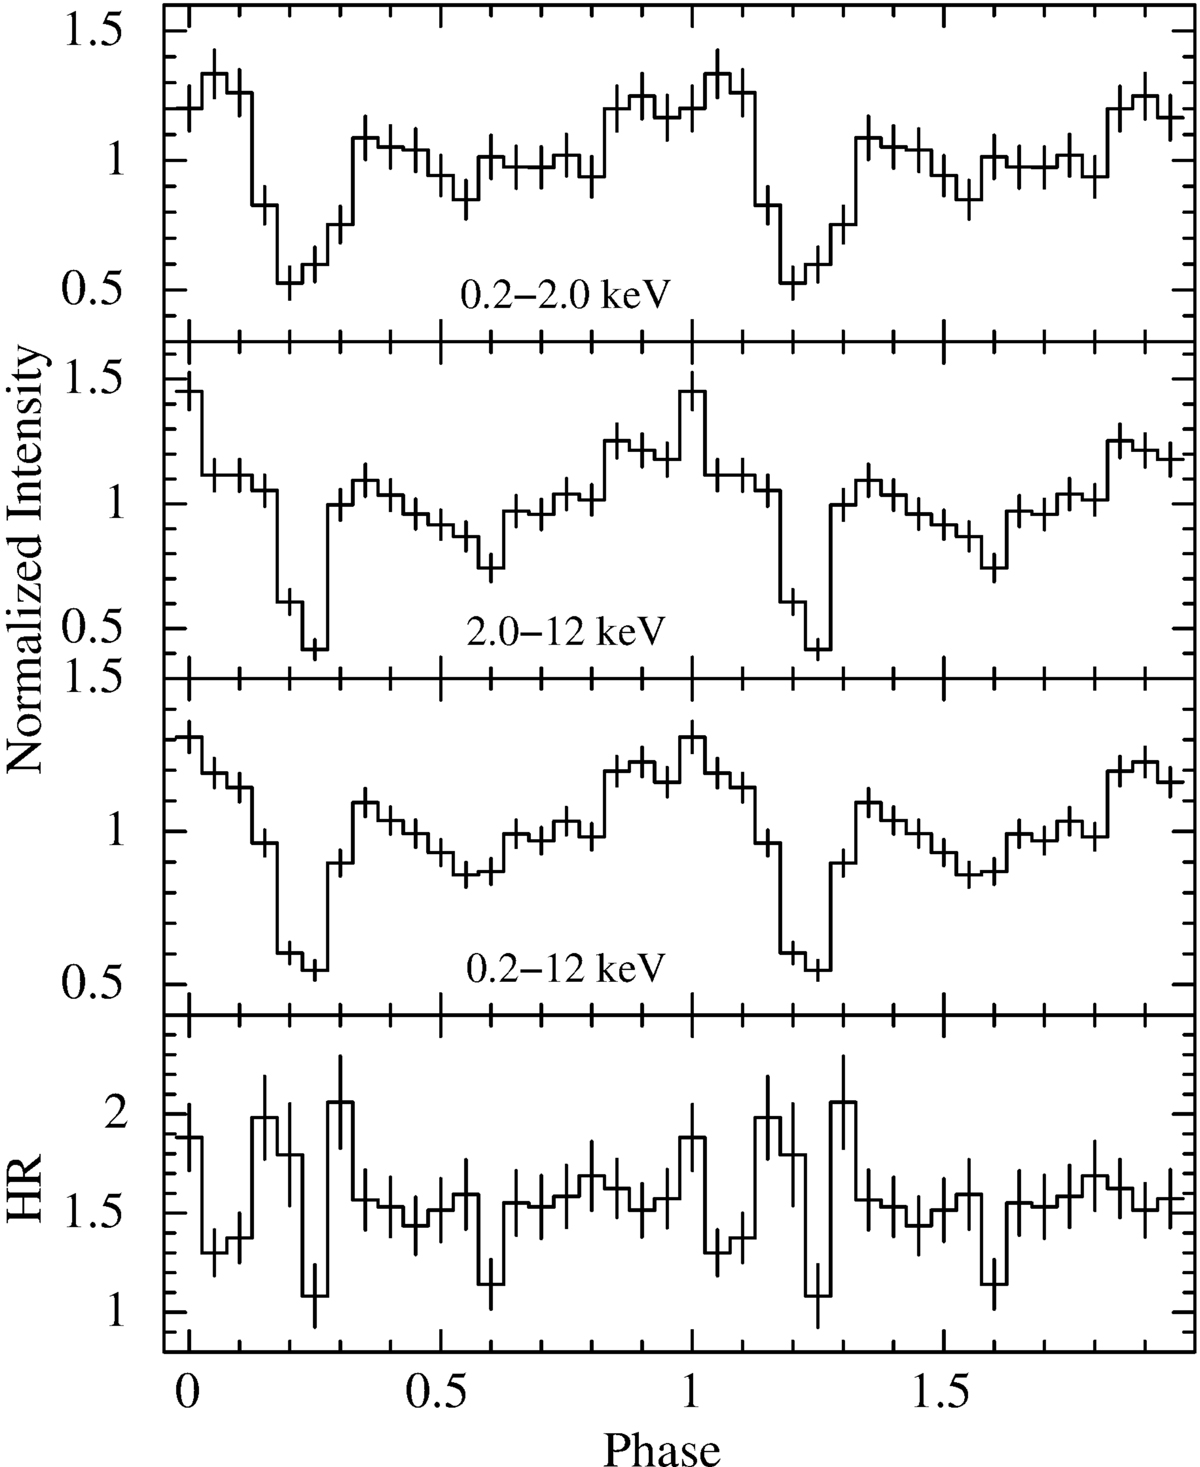
Fig. 7.
Download original image
Corrected EPIC-pn light curves folded with 317.72 s showing the pulse profile of J0457 in the energy bands of 0.2–2.0 keV (soft), 2.0–12 keV (hard) and total 0.2–12 keV. The intensity profiles are normalised to their mean count rates, 0.189 cts s−1, 0.268 cts s−1, and 0.457 cts s−1 for the soft, hard, and total energy bands, respectively. For the hardness ratio (HR), the count rate in the hard band was divided by that in the soft band. A deep, sharp dip can be seen, which causes the high number of harmonic frequency peaks in the periodogram (Fig. 6).
Current usage metrics show cumulative count of Article Views (full-text article views including HTML views, PDF and ePub downloads, according to the available data) and Abstracts Views on Vision4Press platform.
Data correspond to usage on the plateform after 2015. The current usage metrics is available 48-96 hours after online publication and is updated daily on week days.
Initial download of the metrics may take a while.