Fig. 21.
Download original image
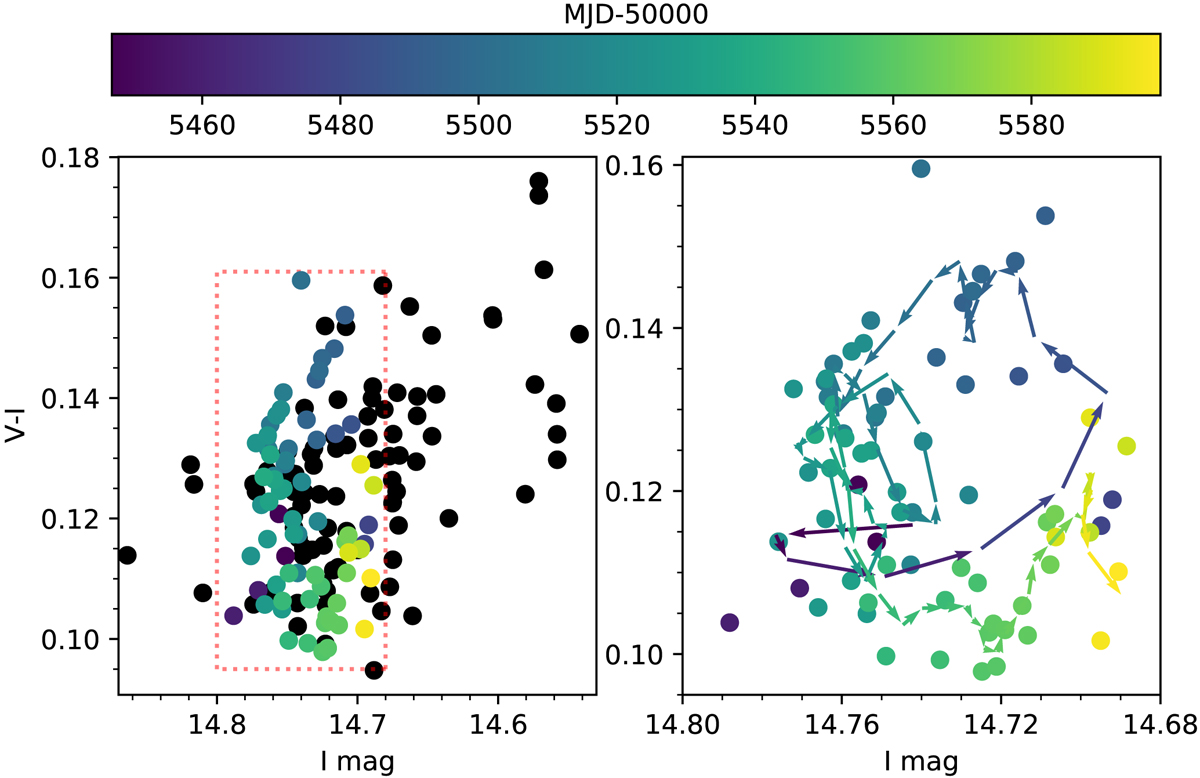
J0524: OGLE V − I colour index vs. I (interpolated linearly to the times of the V-band measurements). Left panel: we plot the complete data set. Right panel: we restrict the times to MJD 55400–55600 (see shaded region in Fig. 20). Apart from a general trend of redder when brighter, smoothing the date reveals a hysteresis loop (see right panel), where the rise of a flare is bluer than the decay.
Current usage metrics show cumulative count of Article Views (full-text article views including HTML views, PDF and ePub downloads, according to the available data) and Abstracts Views on Vision4Press platform.
Data correspond to usage on the plateform after 2015. The current usage metrics is available 48-96 hours after online publication and is updated daily on week days.
Initial download of the metrics may take a while.