Open Access
Fig. 15.
Download original image
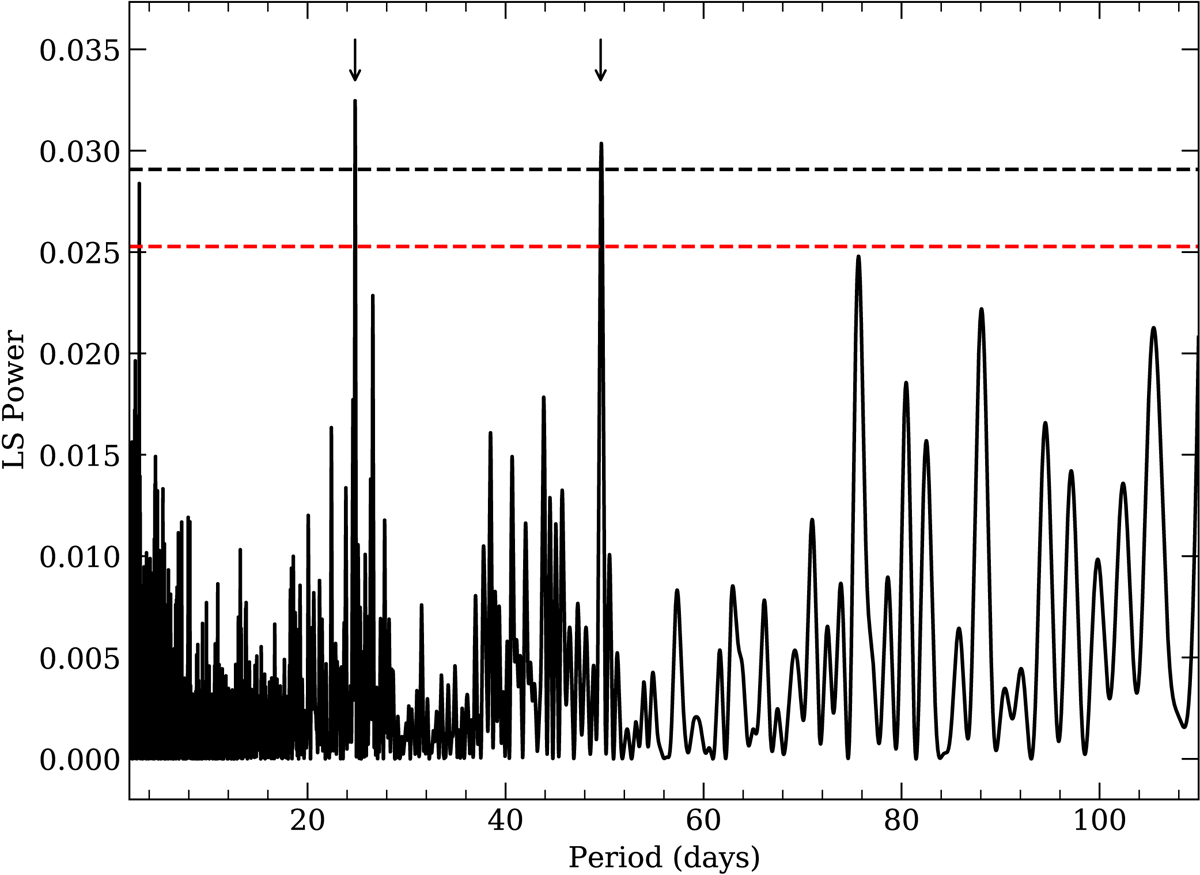
LS periodogram of the OGLE I-band data (before the large outburst, HJD < 2456000 days) of J0453. The arrows mark the highest peaks at 49.61 days and 24.81 days. The red and black dashed lines mark the 95% and 99% confidence levels.
Current usage metrics show cumulative count of Article Views (full-text article views including HTML views, PDF and ePub downloads, according to the available data) and Abstracts Views on Vision4Press platform.
Data correspond to usage on the plateform after 2015. The current usage metrics is available 48-96 hours after online publication and is updated daily on week days.
Initial download of the metrics may take a while.