| Issue |
A&A
Volume 661, May 2022
|
|
|---|---|---|
| Article Number | A124 | |
| Number of page(s) | 12 | |
| Section | Stellar structure and evolution | |
| DOI | https://doi.org/10.1051/0004-6361/202142058 | |
| Published online | 16 May 2022 | |
THA 15−31: Discovery with VLT/X-shooter and Swift/UVOT of a new symbiotic star of the accreting-only variety
1
INAF-Osservatorio Astronomico di Padova, 36012 Asiago (VI), Italy
e-mail: ulisse.munari@oapd.inaf.it
2
INAF-Osservatorio Astronomico di Capodimonte, Via Moiariello 16, 80131 Napoli, Italy
3
INAF-Osservatorio Astrofisico di Catania, Via S. Sofia 78, 95123 Catania, Italy
4
INAF-Osservatorio di Astrofisica e Scienza dello Spazio, Via Gobetti 101, 40129 Bologna, Italy
5
Departamento de Ciencias Físicas, Universidad Andrés Bello, Fernández Concha 700, Las Condes, Santiago, Chile
6
Lund Observatory, Department of Astronomy and Theoretical Physics, Box 43 221 00 Lund, Sweden
7
Institute for Astronomy, Astrophysics, Space Applications and Remote Sensing, National Observatory of Athens, Penteli 15236, Greece
Received:
20
August
2021
Accepted:
10
February
2022
We report the discovery and characterization of a new symbiotic star of the accreting-only variety, which we observed in the optical/near-infrared (NIR) with VLT/X-shooter and in the X-rays/ultraviolet with Swift/UVOT+XRT. The new symbiotic star, THA 15−31, was previously described as a pre-main sequence star belonging to the Lupus 3 association. Our observations, ancillary data, and Gaia EDR3 parallax indicate that THA 15−31 is a symbiotic star composed of an M6III red giant and an accreting companion, is subject to EB − V = 0.38 reddening, and is located at a distance of ∼12 kpc and at 1.8 kpc above the Galactic plane in the outskirts of the Bulge. The luminosity of the accreting companion is ∼100 L⊙, placing THA 15−31 among the symbiotic stars accreting at a high rate (2.5 × 10⁻⁸ M⊙ yr−1 if the accretion is occurring on a white dwarf of 1 M⊙). The observed emission lines originate primarily from H I, He I, and Fe II, with no He II or other high-excitation lines observed; a sharp central absorption superimposed on the Balmer emission lines is observed, while all other lines have a simple Gaussian-like profile. The emission from the companion dominates over the M6III red giant at U and B-band wavelengths, and is consistent with an origin primarily in an optically thick accretion disk. No significant photometric variability is observed at optical or NIR wavelengths, suggesting either a face-on orbital orientation and/or that the red giant is far from Roche-lobe filling conditions. The profile of emission lines supports a low orbital inclination if they form primarily in the accretion disk. An excess emission is present in AllWISE W3 (12 μm) and W4 (22 μm) data, radiating a luminosity ≥35 L⊙, consistent with thermal emission from optically thin circumstellar dust.
Key words: binaries: symbiotic
© ESO 2022
1. Introduction
THA 15−31 was first noted by The (1962) while compiling a list of faint H-alpha emission stars in Lupus and Scorpius, and later rediscovered as Sz 105 by Schwartz (1977) during a deep red objective-prism survey of southern dark clouds. This led to THA 15−31 being considered as a candidate young stellar object (YSO) and as such it was included in many surveys of the Lupus 3 star forming region, with observations ranging from X-rays to optical, infrared (IR), and radio (Hughes et al. 1994; Chen et al. 1997; Ghez et al. 1997; Krautter et al. 1997; Nuernberger et al. 1997; Gómez & Persi 2002; Kirk & Myers 2011; Mužić et al. 2014). The classification of THA 15−31 as a classical T Tau star of M4 spectral type with 0.15 M⊙ mass and 0.03 L⊙ luminosity was generally copied from one survey to another.
The first hint of an erroneous YSO classification of THA 15−31 came from López Martí et al. (2011) who investigated the distribution in proper motion of members of Lupus 3 and found that THA 15−31 belongs to a heterogeneous group of background objects that are highly distinct from true YSOs in the foreground. The problematic absence of Li I 6708 absorption in the spectra of THA 15−31 – a hallmark of YSOs – was then noted by Alcalá et al. (2014), while Frasca et al. (2017) derived a surface gravity for THA 15−31 that is more in line with a cool giant than a YSO. Based on these findings, THA 15−31 was then finally rejected by Alcalá et al. (2017) from the list of YSO members of Lupus 3. This is, in broad terms, the current and rather limited knowledge about THA 15−31.
Our interest in THA 15−31 was triggered by the recent release of Gaia EDR3 (Gaia Collaboration 2020), which lists a 0.0422 ± 0.0398 mas parallax for the object. Although still affected by a large error, it significantly improves upon the previous value of 0.0323 ± 0.0765 mas given in Gaia DR2, and definitively supports a large distance (at least several kpc) to THA 15−31, which in turn implies the presence of a cool giant in the system and definitively rules out any link to the Lupus dark clouds. To investigate its nature, we analyzed an archive VLT/X-shooter optical-IR spectrum of THA 15−31 and obtained satellite ultraviolet (UV) observations with the Neil Gehrels Swift Observatory (hereafter Swift). Supplemented by epoch photometry from NeoWISE and ASASSN, as well as other ancillary data, we now show that THA 15−31 is indeed an accreting-only symbiotic star (SySt), with an accretion luminosity (Lacc) that is much higher than that characterizing the sample of 33 new, accreting-only SySts that we recently identified and studied (Munari et al. 2021) among the 0.6 million stars observed by the GALAH spectroscopic survey of the southern sky (De Silva et al. 2015; Buder et al. 2021).
Symbiotic stars are interacting binaries where a red giant (RG) fuels a hot companion (HC) via accretion either through Roche-lobe overflow or wind intercept. In the vast majority of SySts the hot companion is believed to be a white dwarf (WD), while the hard and pulsed X-ray emission observed in a small subset suggests that the accretion takes place on a neutron star (NS). The RG+WD symbiotic stars are broadly divided into two major groups (see the recent review by Munari 2019 for details): those accreting-only (acc-SySts) whose optical spectra are dominated by the RG with no or weak emission lines, and the burning-type (burn-SySts) with optical spectra dominated by a strong nebular continuum and a rich emission line spectrum, that originate from the wind of the RG which is largely ionized by the very hot and luminous WD undergoing surface nuclear burning of accreted material.
It is possible that SySts spend most of their time in the accreting-only phase, quietly accumulating material on the surface of the WD. When enough material has built up, nuclear burning begins. If the accreted matter is electron degenerate, the burning proceeds explosively (Starrfield et al. 2020) resulting in a nova outburst. If the accreted matter is instead not electron-degenerate, the nuclear burning develops slowly and in thermal equilibrium (Fujimoto 1982).
There is a clear disproportion among cataloged SySts (Allen 1984; Belczyński et al. 2000; Merc et al. 2019; Akras et al. 2019a) in favor of the burn-SySt type which are much more easily discovered, and the known examples of the acc-SySt variety could simply be “the tip of the iceberg” (Mukai et al. 2016). The acc-SySts are well distributed in accretion luminosity, from the 10 − 100 L⊙ of some well-studied objects like EG And (Skopal 2005; Nuñez et al. 2016) to the emerging large population of lower 1 − 10 L⊙ objects exemplified by the first sample of 33 SySts discovered by Munari et al. (2021) in the course of the GALAH survey. The higher Lacc systems are characterized by a brighter HC (collectively including the accretion disk, its central star, and some RG wind ionized by them both) and by much stronger emission lines compared to lower Lacc systems, although generally missing the higher ionization features like He II, [FeV II], OV I, or [FeX] that adorn the spectra of the burn-SySt type. SySts accreting on neutron stars, while generally inconspicuous at optical and near-UV wavelengths, may radiate abundantly in hard X-rays (e.g., Masetti et al. 2007a,b; Nucita et al. 2014).
Identification of new SySts of the accreting-only, high-Lacc variety appears to be important for properly measuring their frequency relative to the lower Lacc systems, and will help to address the fundamental question of whether accretion luminosity can be used to distinguish between SySts of different nature (e.g., in terms of mass, orbital separation, and filling of the Roche lobe), or whether accretion simply proceeds in a highly sporadic fashion, irrespective of the nature of the underlying SySt. The latter applies to the symbiotic star and recurrent nova T CrB, as discussed in Munari et al. (2016) and Luna et al. (2020): for 70 years following its nova eruption in 1946, the accretion luminosity was so low that only feeble Hα emission was generally visible superimposed on the spectrum of the M3III cool giant. However, starting with 2015, the Lacc in T CrB hugely increased and the optical spectra are now persistently dominated by a strong nebular continuum and imposing emission lines, in a replica of the accretion surge that preceded the 1946 thermonuclear outburst (Hachenberg & Wellmann 1939).
2. Observations
2.1. X-Shooter spectrum
The X-Shooter data used here were acquired on April 18, 2012, within the context of the X-shooter guaranteed-time observations (GTO) granted to INAF (cf. Alcalá et al. 2011, 2014 and references therein). X-shooter provides simultaneous wavelength coverage from ∼3000 Å to ∼2.48 μm. For the observations of THA 15–31, slits of 0 5/0
5/0 4/0
4/0 4 were used in the UltraViolet-Blue/Visual/Near-InfraRed (UVB/VIS/NIR) arms, respectively, yielding resolving powers of 9100/17400/10500.
The observations were performed at parallactic angle with one cycle using the A–B nodding mode, with single-node exposure of 150 s, 100 s, and 100 s for a total of 300 s, 200 s, and 200 s in the UVB, VIS, and NIR arms, respectively. Telluric standard stars were observed with the same instrumental setup and at very similar airmass to THA 15–31. Flux standards during the same night were observed through the 5 arcsec slits for flux calibration purposes.
Data reduction was performed independently for each spectrograph arm using the X-Shooter pipeline (version 1.3.7; Modigliani et al. 2010). The standard steps of processing included bias and dark subtraction, flat-fielding, optimal extraction, sky subtraction, and wavelength and flux calibration (the latter carried out in IRAF1). Wavelength shifts due to instrumental flexure were corrected for using the FLEXCOMP package within the pipeline. The precision in wavelength calibration is better than 0.01 pix in the UVB and VIS arms, corresponding to 0.02 Å, but errors can be as large as ∼0.06 Å in the NIR arm. The wavelength calibration allows an average precision in radial velocity of ∼1.0 km s−1 in the VIS arm. The telluric correction was performed independently in the VIS and NIR spectra, as explained in Appendix A of Alcalá et al. (2014). By comparing the response function of different flux standards observed during the same night, we estimate an intrinsic precision on the flux calibration of ∼5% (cf. Alcalá et al. 2014, 2017).
2.2. Swift observations
Our Swift observations of THA 15−31 were acquired on April 9, 2021, starting at 21:43 UT with the on-board instruments X-Ray Telescope (hereafter XRT, Burrows et al. 2005) and UltraViolet-Optical Telescope (hereafter UVOT, Roming et al. 2005). The XRT allows coverage of the X–ray band between 0.3 and 10 keV, whereas UVOT data were collected using the three available UV filters (cf. Poole et al. 2008; Breeveld et al. 2011 for details). On-source pointing was simultaneously performed with the two instruments; it lasted 1560 s for XRT, whereas for UVOT 444 s were spent using the UVW1 filter and 515 s in both UVM2 and UVW2 filters.
Count rates on Level 2 (i.e. calibrated and containing astrometric information) UVOT images at the position of our target were measured through aperture photometry using 5″ apertures, whereas the corresponding background was evaluated using a combination of several circular regions in source-free nearby areas. Magnitudes were measured with the UVOTSOURCE task. The data were then calibrated using the UVOT photometric system described by Poole et al. (2008), and we included the recent (November 2020) fixings recommended by the UVOT team. The observed fluxes in the three UV filters are listed in Table 1 and the corresponding magnitudes in Table 4 (Vega scale).
Swift-UVOT observations of THA 15−31.
THA 15−31 was not detected in X-rays with XRT. Data analysis was performed using the XRTDAS standard pipeline package (XRTPIPELINE v. 0.13.4) in order to produce screened event files. All X-ray data were acquired in photon counting (PC) mode (Hill et al. 2004) adopting the standard grade filtering (0–12 for PC) according to the XRT nomenclature. For each source, scientific data were extracted from the images using an extraction radius of 47″ (20 pixels) centered at the optical coordinates of the source, while the corresponding background was evaluated in a source-free region of radius 94″ (40 pixels).
We do not detect any X-ray emission down to a 3σ limit of 2.2 × 10⁻³ cts s−1 in the 0.3–10 keV band at the position of THA 15−31; this estimate was obtained using the XSPEC package. Assuming a bremsstrahlung spectrum, with temperature kT = 2 keV, which gives a 0.3–10 keV flux limit of < 6.3 × 10⁻¹⁴ erg cm−2 s−1.
3. Results
3.1. Spectral type, radial velocity, and reddening
The optical part of the X-shooter spectrum shown in Fig. 1 is dominated by the molecular TiO absorption bands of the RG, and this offers the possibility to derive some of the basic properties of THA 15−31: (1) the relative intensity of molecular bands and their fine structure, which vary by huge amounts among cool giants, thus allowing us to derive an accurate spectral type for the RG; (2) the veiling by the emission from HC, which increases toward shorter wavelengths; and (3) the overall slope, controlled by the amount of reddening. The reddening and spectral type are determined without significant degeneracy among them, contrary to the case of modeling the spectral energy distribution (SED) based on broad-band photometric data only: the key to success here is the strong and sharp band-heads that develop within individual TiO bands over a short wavelength interval to make their interplay independent from reddening. The technique was thoroughly tested and applied in Corradi et al. (2010) for the analysis of new SySts discovered photometrically by the INT Photometric Hα Survey (IPHAS) and re-observed spectroscopically for confirmation and characterization.
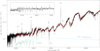 |
Fig. 1. Optical spectrum of THA 15−31 as recorded with X-shooter (black) is fitted (red) by combining the spectrum of the cool giant (M6III, green spectrum) and that of the hot companion (blue line). The latter is a bremsstrahlung spectrum taken to approximate the mix of the accretion disk, the central star, and possibly some RG wind ionized by them. The spectra of the M6III cool giant and of the hot companion are reddened by EB − V = 0.38 following the Fitzpatrick (1999) reddening law for the standard RV = 3.1 case. The inset is a zoomed-in view of the head of the Balmer series and the Balmer jump. |
The fitting to the optical part of the X-shooter spectrum of THA 15−31 is presented in Fig. 1. To this aim we adopted the library of intrinsic spectra of real M-type giants by Fluks et al. (1994)2 and the interstellar reddening law of Fitzpatrick (1999) for the standard RV = 3.1 case. The emission from HC is a mixture of different sources (accretion disk, central star, nebular continuum) present in unknown proportions, and physical parameters that cannot be unambiguously determined with available data. As a fair approximation of the overall shape of the HC emission in the wavelength range covered by Fig. 1, we adopted a bremsstrahlung spectrum for gas at Te = 10 000 K. However, none of the results presented in this paper depend on this assumption.
The fit of the X-shooter spectrum displayed in Fig. 1 is remarkably good, fixing the reddening to EB − V = 0.38 ± 0.04 and the spectral type to M6III, with an uncertainty smaller than 1 spectral subclass, because the structure of molecular bands is strongly different for stars with M5III and M7III spectral types. A spectral type M6III is the one most frequently found in Galactic SySts. The modest EB − V = 0.38 ± 0.04 reddening agrees well with the relatively high Galactic latitude of the object (b = +8.5 deg), and with the STILISM 3D-map of the Galactic interstellar reddening (Lallement et al. 2014; Capitanio et al. 2017): the latter indicates an exit of the line of sight to THA 15−31 from the dust slab on the Galactic plane at a distance of 600 pc from Earth, where it reaches EB − V = 0.40 ± 0.05. The agreement is also good with the value EB − V = 0.34 ± 0.03 derived from the 3D map of Galactic extinction by Marshall et al. (2006). Unfortunately, the location on the sky of THA 15−31 is too far south for other popular 3D maps of Galactic extinction to be considered, such as those based on IPHAS (Sale et al. 2014) or PanSTARRS (Green et al. 2019) sky surveys. The limited resolution of X-Shooter is not sufficient to attempt to resolve the interstellar from the stellar component of the Na I line, and thus derive the reddening from its equivalent width (see also below, Sect. 3.6). The heliocentric radial velocity of the M6III giant is determined as
by application of the ROTFIT code (Frasca et al. 2006), specifically modified for X-shooter data (cf. Alcalá et al. 2014), and confirmed by cross-correlation against the synthetic spectral library of Munari et al. (2005).
The inset in Fig. 1 zooms onto the THA 15−31 spectrum at the head of the Balmer series, highlighting two interesting features that are further discussed in Sect. 3.7. First, the series of individual Balmer lines is visible in absorption up to about H(29), corresponding to much higher quantum levels than those observed in normal stars. Second, the Balmer continuum below λ ≤ 3646 Å is in absorption. This is a rare occurrence: inspection of the spectral atlases of SySt by Allen (1984) and Munari & Zwitter (2002), which survey most (∼150) of the symbiotic stars known at the time, reveals only about half a dozen objects showing a Balmer continuum in absorption, whilst the majority of surveyed SySts present the Balmer continuum in emission, sometimes spectacularly so. The SySts showing the Balmer continuum in absorption include V4368 Sgr (a symbiotic nova at maximum brightness when the burning shell around the WD expanded to mimic an A–F supergiant, Munari 2019), TX CVn (the A/B spectral type of the companion is explained by Kenyon and Webbink as originating from a low-mass white dwarf (∼0.27 M⊙) with a rejuvenated hydrogen burning shell), and V694 Mon (the A spectral type of the companion comes from a large accretion disk forming around a massive (≥0.9 M⊙) white dwarf; Lucy et al. 2020). We believe that in THA 15–31 the Balmer continuum in absorption originates in the accretion disk around the companion, as discussed below in Sect. 3.7.
3.2. Distance
We mention above how the very small parallax given in Gaia EDR3 indicates a large distance to THA 15−31 (at least several kpc). The associated error is however too large for a safe inversion of the parallax to derive an accurate value for the distance (cf. Bailer-Jones 2015; Luri et al. 2018). To estimate the latter, we compare THA 15−31 with SU Lyn, a prototype for accreting-only symbiotic stars that harbors a similar M6III which suffers from a low EB − V = 0.05 ± 0.02 (Mukai et al. 2016; Lallement et al. 2014; Gontcharov & Mosenkov 2018). SU Lyn is nearby and therefore its Gaia EDR3 parallax is accurate at 1.373 ± 0.063 mas, which fixes the absolute 2MASS KS magnitude of SU Lyn to M(KS) = − 7.72 ± 0.11, where the error propagates the uncertainties on KS, the parallax and the reddening. Assuming that the M6III giant in THA 15−31 is characterized by the same M(KS) as the M6III giant in SU Lyn, the distance to THA 15−31 turns out to be 12 ± 0.6 kpc, a value that we adopt in the remainder of this paper. The corresponding height above the galactic plane is 1.8 kpc, which matches the median value for known SySts believed to be old-population objects (Munari et al. 2021, their Fig. 7).
3.3. Photometric stability
THA 15−31 does not appear to be significantly variable at optical or IR wavelengths. The RG of THA 15−31 can be probed with the epoch IR photometry performed by the Wide-field Infrared Survey Explorer (WISE) over its four photometric bands W1, W2, W3, and W4 (3.4, 4.6, 12 and 22 μm, respectively). While observations in W3 and W4 bands could be performed only during the initial cryogenic phase before the depletion of hydrogen coolant (the first 10 months following launch in 2009), a four-month mission extension was subsequently conducted in the remaining W1 and W2 bands. The AllWISE catalog (Cutri et al. 2013) combines observations from these 2009–2010 cryogenic and post-cryogenic survey phases, while NeoWISE (Mainzer et al. 2011, 2014) refers to the data the satellite is collecting in W1 and W2 bands since it was brought out of hibernation and resumed observations in 2014. The long-term light curve of THA 15−31 in the W1 and W2 bands is plotted in Fig. 2. The IR brightness of THA 15−31 appears to have remained relatively constant over the monitored 2009–2010 and 2014–2020 time intervals. A Fourier analysis suggests the presence of a sinusoidal signal of ∼0.06 mag semi-amplitude and ∼1400 day period in the W2 data, albeit at low statistical significance. However, the currently available NeoWISE data do not yet cover two full cycles of this possible long periodicity. The W1 data are affected by errors larger than the amplitude of such a possible periodicity, and cannot be used to confirm that it is real rather than an artefact.
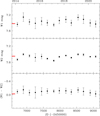 |
Fig. 2. Epoch photometry of THA 15−31 in the infrared W1 and W2 bands as recorded by the NeoWISE mission. The thick red horizontal mark is the corresponding value listed in the AllWISE catalog (see Sect. 3.3 for details). |
If the RG dominates the flux at longer wavelengths, the relative contribution of HC grows moving blueward and optical photometry is strongly influenced by it (cf. spectral fitting in Fig. 1 and the SED discussed in Sect. 3.4 below). We therefore inspected public databases of patrol all-sky surveys in search for epoch optical photometry of THA 15−31. The object is unfortunately located too far south for the ZTF survey (Masci et al. 2019; Bellm et al. 2019), which is conducted with the Palomar Schmidt telescope and has a deep limiting magnitude and a sharp angular resolution. On the other hand, the ASASSN survey (Shappee et al. 2014; Kochanek et al. 2017) covers the whole sky nightly in V or g bands, but the large adopted pixel size (7.8 arcsec) means that THA 15−31 cannot be resolved from a nearby field star of comparable magnitude located 11 arcsec away (2MASS 16083631−4016120), and the two stars are measured together as an unresolved pair by ASASSN. Gaia EDR3 reports BP = 15.18 and 16.08 mag for THA 15−31 and the nearby star, respectively. The ASASSN light curve for this blended source is presented in Fig. 3 and is characterized by a limited dispersion in brightness (rms = 0.126 mag) around a mean value (V = 14.76 mag) that could be somewhat fluctuating over a long timescale (by ∼0.2 mag). How much of this rather limited variability is real and intrinsic to THA 15−31 is hard to say, and it could be due to the field star, or instead to the blending of two stellar images into one. Certainly, variable seeing and focusing can be expected to affect the result of the aperture-photometry performed by ASASSN on such an unresolved but obviously not-single source.
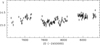 |
Fig. 3. ASASSN V-band light curve of the blend composed by THA 15−31 and the nearby field star 2MASS 16083631−4016120, recorded together as a single unresolved source. |
In summary, recorded photometric data suggest that THA 15−31 does not appear to vary significantly, to the point that combining multi-wavelength data that have been gathered at different epochs into a single SED seems a reasonable procedure for deriving some basic properties of the system.
3.4. Spectral energy distribution
The reddening-corrected SED of THA 15−31 is presented in Fig. 4, where it is compared to that of an M6III giant built from the intrinsic colors listed by Bessell (1990), Koornneef (1983), Lee (1970), and Wu et al. (1982). The absence of significant variability by either the RG or the HC, as discussed in the previous section, allows us to build the SED of THA 15−31 by combining non-simultaneous data from different sources: AllWISE W1, W2, W3, and W4 magnitudes (Cutri et al. 2013), 2MASS JHKs (Cutri et al. 2003), APASS DR8 BVg′r′i′ (Henden & Munari 2014), SkyMapper z′ (Wolf et al. 2018), and the Swift UVOT UVW1, UVM2, and UVW2 data from our observations as described in Sect. 2 above.
 |
Fig. 4. Spectral energy distribution of THA 15−31 (black dots and black/green line) corrected for EB − V = 0.38 reddening and compared to that of a normal, single M6III star (red dots and line). |
The SED in Fig. 4 shows that THA 15−31 matches well a field M6III in the red and in the NIR, confirming the results from the spectral fitting in Fig. 1. Integrating the flux distribution under the red line in Fig. 4 for the M6III giant in THA 15−31 returns a luminosity of
corresponding to a bolometric magnitude Mbol = −4.75 which closely matches the expectation for a M6III (cf. Straižys 1992; Sowell et al. 2007).
The contribution by HC to the SED of THA 15−31 is rather obvious in Fig. 4, with the observed flux distribution floating well above that of the RG in the optical and UV. The difference for λ≤ 7000 Å between the interpolating black and red lines in Fig. 4 corresponds to a radiated luminosity of
A value frequently cited in the literature for other SySts is the LUV luminosity radiated over the three UVOT photometric bands (cf. Mukai et al. 2016): for THA 15−31 this value is 6.3 × 1034 erg s−1 or

which places THA 15–31 among the acc-SySts accreting at high rates. Lopes de Oliveira et al. (2018) found LUV to vary between 0.3 and 2.8 L⊙ for SU Lyn, and its median value for the accreting SySts studied by Luna et al. (2013) is 5 L⊙, while Luna et al. (2018) derived LUV = 25 L⊙ for RT Cru. Flickering in the UV is ubiquitous among acc-SySts (Luna et al. 2013), but there is far less flickering at optical wavelengths (Zamanov et al. 2017), with its detection requiring the greatest care (Munari et al. 2021). The acc-SySts with the largest-amplitude flickering are generally those with the highest Ṁacc, and this bodes well for a search in THA 15–31.
The SED in Fig. 4 shows an excess emission over the WISE W3 and W4 bands, which is probably caused by dust. Integrating the difference between the red and green lines in Fig. 4 for λ ≥ 5 μm allows us to derive the luminosity of this IR excess as

Such dust does not add to the extinction of interstellar origin affecting THA 15−31 as defined in Sect. 3.1 above, meaning it either does not project over the M6III star or, if it engulfs the central binary, it is located at a sufficiently large distance to dilute the dust grains below the column density required to impact the observed reddening.
An energy distribution fitted by a stellar photosphere over the entire 1 − 4 μm range (bands J through L) is labeled S-type following the terminology introduced by Allen & Glass (1974), as opposed to D-type when emission from dust at 800–1000 K dominates instead. The majority of known SySts are of the S-type, while SySts of the D-type usually harbor an RG affected by Mira pulsating variability. Later, Allen (1982) introduced a third class, the D′-type, where emission from dust at 400–500 K causes an excess in L-band (3.5 μm) while JHK bands remain dominated by the stellar photosphere.
A fourth class, termed S+IR, was recently introduced by Akras et al. (2019a, hereafter Ak19) and is characterized by a large excess emission detectable only over the 12−22 μm range covered by the WISE W3 and W4 bands. Ak19 compiled an updated catalog of known SySts and classified them into the four types: S, S+IR, D′, and D. Their criteria would have grouped THA 15–31 with the S-type SySts, as illustrated in Fig. 5 where our program star is overplotted on the original Ak19 Fig. 4 and its IR energy distribution is fitted in the same fashion as their Fig. 3. Nonetheless, THA 15–31 presents a clear excess emission in W3 and W4 bands, and an association with the pure S-type objects would under-represent this. To classify SySts in IR, Ak19 fitted their energy distributions with simple blackbodies: one for the stellar photosphere, another for the dust. The latter was only required when the excess caused by dust was too large to be accommodated within a stretching of the fit with just the stellar-photosphere blackbody. Thus, in the Ak19 reference frame, the transition from pure S to S+IR type occurs only for really large excess emission at W3 and W4 bands: a moderate excess as displayed by THA 15–31 is not distinguished from a pure stellar photosphere. THA 15–31 is the first identified example of a symbiotic star with a moderate amount of excess in W3 and W4 bands, a transition object between SySts of really pure S-type and the S+IR ones. It would be fair to expect that other SySts similar to THA 15–31 exist among those grouped into the S-type by Ak19.
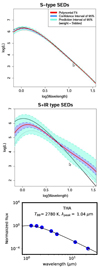 |
Fig. 5. THA 15−31 in the near infrared. Top and central panels: THA 15−31 (black line) is overplotted to Fig. 4 from Akras et al. (2019a). Bottom panel: energy distribution of THA 15−31 fitted with a single blackbody in the same fashion as Fig. 3 of Akras et al. (2019a). See discussion in Sect. 3.4. |
We conclude this section by noting that the X-ray nondetection of THA 15–31 is easily explained by its inferred distance. Indeed, the ∼1500 s integration we performed with Swift/XRT, which implies an X-ray luminosity upper limit of < 1.1 × 1033 (< 1.4 × 1033 unabsorbed) in the 0.3–10 keV band, would not have led to the X-ray detection of SU Lyn (the proto-type of the low-Lacc SySts; Mukai et al. 2016) or EG And (representing the high-Lacc SySts; Nuñez et al. 2016) if they were at the distance of THA 15−31, which is approximately 20 times more distant than the two above examples, thus reducing the observed flux by a factor of 400 and bringing it below the sensitivity threshold of XRT.
3.5. Emission lines
A sample of the recorded emission line profiles of THA 15–31 is presented in Fig. 6: Balmer lines show broad wings and a sharp absorption superimposed on the emission component, while all other lines are well fitted by a single Gaussian in emission. The P Cyg profile for He I 10 830 is only apparent and is not genuine: the absorption to the left is a normal photospheric line from the M6III star (Si I 10 827 Å; cf. Vaughan & Zirin 1968). Table 2 lists the radial velocity and integrated flux of observed emission lines.
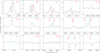 |
Fig. 6. Line profiles for THA 15−31. Top and central rows: profiles for a sample of the emission lines recorded on the X-shooter spectrum of THA 15−31. Bottom row: some additional spectral features from the same spectrum and discussed in the text. All panels are plotted over the same velocity scale. The thin vertical lines mark the laboratory wavelength in the rest frame of the red giant. |
Heliocentric wavelength of line photo-center, corresponding heliocentric radial velocity, and integrated flux for emission lines identified in the X-shooter spectrum of THA 15–31.
The profile of Balmer lines was de-convolved with a Voigt profile for the emission and a Gaussian for the absorption, and the resulting fit is over-plotted on the observed profile in Fig. 6. The principal parameters of the fitting are listed in Table 3. Given the weakness of the emission component of Hγ and Hδ, the corresponding values in Table 3 are much more uncertain than for Hα and Hβ. There is an obvious progression moving up along the Balmer series: the absorption component is on the blue side of the emission in Hα and progressively turns to the red side for higher terms. This behavior is not generally observed in SySts, for which the difference in velocity between emission and absorption components usually remains the same for different Balmer lines. However, we sometimes observe a pattern in SySts that is similar to that displayed by THA 15–31; for example as displayed by CH Cyg and Hen 2-468 on the spectra we collected on July 24, 2016, with the Asiago 1.82m+Echelle telescope. We do not have a simple explanation at hand for such behavior. In most SySts, the absorption component is seen to follow the orbital motion of the RG with an offset of −10/−20 km s−1, suggesting it forms in the wind that blows off the RG and engulfs the whole binary. In any case, the radial velocities reported in Table 2 for the emission lines of THA 15–31 other than Balmer suggest that they form in a stratified medium: the mean velocity for He I singlets is +7.5 ± 0.5 and for triplets is +20.5 ± 1 km s−1; it is −3 ± 1 km s−1 for Fe II multiplet #42, and +12.5 ± 1 km s−1 for multiplet #49.
Summary of the basic parameters of THA 15−31.
The lack of essential information for this object, such as orbital period, orbital inclination, or the presence of flickering, prevents us from speculating as to where and how the emission lines form in THA 15–31, if in the accretion disk, in the ionized wind of the M6III, or both. If they form primarily in the main body of an accretion disk, the single-Gaussian shape of the nonBalmer lines argues in favor of a disk seen at low inclination (face-on). A high inclination disk (edge-on) could be accommodated if, at the time of X-shooter observation, the view to a significant fraction of the disk was obstructed (as, e.g., during ingress or egress from an eclipse behind the M6III giant). On the other hand, the presence of a fast-developing flickering could argue in favor of the presence of a luminous hot spot at the outer rim of the disk, and this could be a relevant site for emission-line formation (as is inferred from the so called “S-wave” orbital modulation observed in cataclysmic variables; e.g., Hellier 2001). The presence of a hot spot would in turn imply that the M6III likely fills its Roche lobe, and mass transfer proceeds primarily via overflow at L1 with the resulting stream impacting the disk at the location of the hot spot. The higher and harder the luminosity radiated by the HC, the larger the fraction of the RG wind it can ionize; in turn this would shift the primary source of emission-line formation from the disk toward the ionized wind. The orbital modulation of the radial velocity and of the line profiles would be different in the two cases, and long-term, high-resolution spectroscopic monitoring would be clearly beneficial in identifying the location of formation of the emission lines and in constraining other basic parameters of THA 15–31.
As a final comment, we note that the Hα and Hβ emission lines in Fig. 6 would have well satisfied the selection criteria in Munari et al. (2021) if THA 15–31 were in GALAH, in addition to the spectral signatures of an M-giant and the absence of radial pulsations in the light curve. The profile of THA 15–31 Hα is a fine match to that of the 33 GALAH SySts, and the condition on equivalent widths EW(Hα) > EW(Hβ) is met within a large margin. The EW of Hα and Hβ is one order of magnitude larger in THA 15–31 than in the 33 GALAH SySts, and the luminosity radiated by the respective accreting stars scales by the same proportion.
3.6. Other spectral features
The bottom row of Fig. 6 shows the X-shooter spectrum at some interesting wavelengths. The Ca II line is well centered at the M6III radial velocity, with a clean profile. Considering that Ca II and Fe II have a similar ionization potential, this suggests that Fe II emission lines do not form in or near the M6III atmosphere. On the other hand, the Na I doublet is instead blueshifted (by −9.7 ± 0.6 and −10.4 ± 0.6 km s−1 for D1 and D2 components, respectively). Considering that (1) the equivalent width of the interstellar component corresponding to EB − V = 0.38 reddening is rather large at 0.53 Å (from the calibration by Munari & Zwitter 1997), and that (2) the general radial velocity of the interstellar medium is expected to be negative along the line of sight to THA 15–31 (Brand & Blitz 1993), the observed −10 km s−1 radial velocity for Na I could result from the unresolved blend between interstellar and stellar components. The He II panel in Fig. 6 clearly shows the absence of this line, the hallmark of high-ionization conditions in symbiotic stars. The ZrO panel is centered at the head of the deepest absorption band from this molecule, which is usually the strongest among s-element oxides in optical spectra (Keenan 1954); its absence suggests the M6III giant has not (yet) undergone the third dredge-up and has not been polluted in s-elements by the progenitor of the current WD companion (cf. Jorissen 2003 for extrinsic s-element stars among SySts). Finally, no Li I is present in the spectrum of THA 15–31.
3.7. The source of UV excess
Although quite relevant, the LHC = 100 L⊙ luminosity estimated above for the hot component of THA 15–31 is too low to be ascribed to stable nuclear burning on the surface of a WD, a condition believed to hold for a significant fraction of known SySts (Kenyon 1986; Sokoloski 2003). The conditions for stable and steady H-burning at the surface of an accreting WD have been explored, among others, by Nomoto et al. (2007), Shen & Bildsten (2007), and Wolf et al. (2013). In these models, the lowest burning luminosities, Lburn = 1740 L⊙, pertain to the lightest WD models of 0.51 M⊙ accreting at 2.5 × 10⁻⁸ M⊙ yr−1, while for a WD of 1.34 M⊙ accreting at 1.1 × 10⁻⁶ M⊙ yr−1 the burning luminosity reaches the upper limit of Lburn = 81 000 L⊙. A similar argument would hold against residual shell-burning from a previous nova outburst, a scenario also contrasting with the stable brightness seen when comparing the present-day THA 15–31 to the Palomar DSS-1 plates of the 1950s.
Alternative to nuclear burning on a WD, the UV excess observed in THA 15–31 may originate from ionized circumstellar material; a normal stellar companion; or an accretion disk. We consider them in turn, and conclude in favor of the latter.
The inset of Fig. 1 shows a Balmer continuum in marked absorption. Ionized gas glowing under recombination would inevitably present the Balmer continuum in emission (Osterbrock & Ferland 2006), not in absorption: this suffices to exclude nebular material – such as an ionized fraction of the wind from the M6III – as the primary source of the UV excess in THA 15–31.
Several reasons also argue against a normal star as the source of UV excess. The emission lines of He I observed in THA 15–31 originate from upper levels ∼23 eV above the ground state. This and the lack of He II emission lines suggests excitation temperatures in the range 2.5−5.0 × 10⁴ K. For normal stars, such a range corresponds to O and early-B spectral types, for which the radiated luminosity (103 to 104 L⊙; Drilling & Landolt 2000) appears too large in comparison to the 100 L⊙ of the HC in THA 15–31. Another argument against a normal star is the Balmer series visible in absorption up to H(29) in the inset of Fig. 1. It is well known (e.g., Inglis & Teller 1939) that the quantum number of the last term observed in the Balmer series relates to the electronic density; in practical terms (cf. Jaschek & Jaschek 1990; Munari et al. 2005), the last Balmer line observable is ∼H(16) for hot main sequence stars and ∼H(19) for their high-luminosity counterparts. H(18) or H(19) are also the last term visible in emission in nonbinary Mira variables (A. Siviero, priv. comm.). The H(29) recorded in THA 15–31 suggests an electronic density much lower than encountered in the stellar atmospheres of normal stars, and even more so for the high-surface-gravity OB subdwarfs.
Further evidence against the hypothesis that the HC in THA 15–31 is a normal star is the energy distribution of the hot component in Fig. 4, which cannot be approximated by any stellar model for O- or B-type stars or by a black body at a given temperature: the observed shape resembles instead a gray-body distribution, of the type that may originate from the combined emission of the anuli of an accretion disk, each emitting at a different temperature (cf. La Dous 1989). Finally, binaries composed of cool giants and hot normal star companions are named VV Cep variables, from the prototype (Pantaleoni González et al. 2020); as discussed in Munari et al. (2021) such objects are rather massive and very young, with all known members of the class laying close to the plane of the Galaxy, with a median height of just 50 pc. The much greater height of THA 15–31, 1.8 kpc from the plane, is incompatible with the young age of the O- and B-type stars there.
We are then left with an accretion disk as the source for the UV excess observed in THA 15–31. In support of this, we note that on the Asiago Echelle spectra that we regularly obtain on V694 Mon, the highest Balmer line visible in absorption is either H(28) or H(29), similarly to THA 15–31. V694 Mon is a well-known symbiotic star that attracted much attention in 1990 when, for some months, it displayed short-living and distinct broad absorption lines distributed in velocity up to 6000 km s−1 (Tomov et al. 1990). There is a general consensus that V694 harbors an accreting WD, with its massive disk dominating at optical and UV wavelengths (Shore et al. 1994; Zamanov et al. 2011; Lucy et al. 2020), and confirmed by its large flickering activity (Michalitsianos et al. 1993; Tomov et al. 1996) and the characteristic hard X-ray emission from the boundary layer (Stute & Sahai 2009).
3.8. The accreting star
Having established an accretion disk as the likely source of the UV excess emission, the next step is to constrain the nature of the central object. We lack crucial observations at wavelengths intermediate between Swift UVOT and XRT intervals, which would be of high diagnostic value here. Nonetheless, available data allow us set useful constraints.
We computed accretion disk models to fit the UV excess observed in THA 15–31 for different choices of the central object, always of the nonmagnetic variety: a neutron star, a white dwarf, and a main sequence star. The models are adapted from the implementation presented in Mucciarelli et al. (2007) and Patruno & Zampieri (2008), with the disk that extends from the surface of the central object up to twice the circularization radius, and includes self-irradiation. Examples of the resulting SED are presented in Fig. 7.
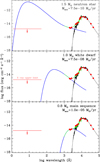 |
Fig. 7. Examples of fitting the SED of THA 15–31 combining the M6III with an accretion disk (and its central object) around a neutron star (top), a white dwarf (center), and a main sequence star (bottom). Details are discussed in Sect. 3.8. The arrow on the left marks the upper limit in X-rays from Swift-XRT observations. The reference distribution for the M6III is the same as that used in Fig. 1. |
The computed luminosity and energy distribution depend on a number of parameters, including: the masses of the central and the donor stars, the binary period, the accretion rate, the SED of the donor, in addition to the inclination angle and the orbital phase of the binary system. For THA 15–31, most of them are unknown, and reasonable ranges have been extensively explored. The results presented in Fig. 7 are typical of each class, and can therefore be regarded as guidelines for these three configurations: their energy distribution invariably peaks in the X-rays for a neutron star, in the extreme UV for a white dwarf, and in the near-UV for a main sequence star.
At the top of Fig. 7, we consider the case of a neutron star of 1.5 M⊙ and accreting at 7.5e−10 M⊙ yr−1. Whatever the mass of the neutron star or the accretion rate, fitting the flux in the Swift UVOT bands always produces an X-ray emission far in excess of the upper limit observed in THA 15–31 with Swift XRT. Introducing a magnetic field for the neutron star would only exacerbate the problem, channeling the inner parts of the disk onto the polar caps and increasing the X-ray flux with the emission from the accretion columns. Therefore, we can confidently exclude a neutron star as the accreting object in THA 15–31.
At the bottom of Fig. 7, we explore a main sequence (MS) star as the central object, with a mass of 0.8 M⊙ and accreting at 1e−05 M⊙ yr−1. As already noted by Kenyon & Webbink (1984), workable MS models for SySts invariably require furious mass-accretion rates, and our simulations certainly confirm this. The very shallow potential well of an MS star, whilst easily accounting for the absence of any X-ray emission, requires very high Ṁacc to produce enough flux to fit THA 15–31 in the UV. The temperature attained by the main body of the disk is generally too low to support photoionization at energies larger than for hydrogen. Harder photons can be produced at the boundary layer, but the high optical thickness of such a disk suggests that they are all absorbed locally with few escaping beyond the boundary layer itself. The modeling of the boundary layer under the very large accreting rates required by an MS is rather uncertain, and a simple scaled-up version of the formalism generally adopted for WD or NS could be misleading. For such a reason, we have not included a boundary layer in the disk model for the MS case at the bottom of Fig. 7.
At the center of Fig. 7, we finally consider a WD as the accreting object. In the plotted case, the WD has a mass of 1.0 M⊙ and accretes at 7.5e−08 M⊙ yr−1. The WD is slowly rotating, has a radius of 0.008 R⊙, and the accretion efficiency and the albedo of the disk and donor surface layers are fixed at 2.6 × 10⁻⁴ and 0.9, respectively. The mass adopted for the M6III is 1.2 M⊙, 1000 days for the orbital period, and i = 60° for the orbital inclination. With such a configuration, the Roche lobe of the donor is comparable to the radius of the M6III giant (∼200 − 300 R⊙). The bolometric luminosity of the disk is 150 L⊙, consistent with the estimate reported in Eq. (3). The emission from the disk well accounts for the Swift/UVOT flux and peaks in the extreme UV, providing a significant reservoir of ionizing photons for the formation of the hydrogen emission lines (there are also enough λ ≤ 228 Å photons to expect detection of He II 4686. The spectra of THA 15–31 do not show this line, but they were taken several years before the acquisition of the Swift observations modeled here, and changes in the accretion rate between the two epochs may explain the difference). At the same time, the spectrum cuts off well below the soft X-rays, which is consistent with the lack of detection with Swift/XRT. We did not perform a fit because it would not be particularly constraining for the accretion disk (considering that most of the SED is dominated by the red supergiant). However, varying Ṁ, i, and the albedo, we verified that the observed fluxes can be satisfactorily reproduced in a range of values close to those reported above, which shows that the result is relatively robust. In particular, a value of Ṁacc = 2e − 08 M⊙ is also acceptable for a face-on system (i ∼ 0°) with an albedo of 0.8. We note that the accretion rate is above Eddington, but the bolometric disk luminosity is not because the efficiency is low.
The mass-loss rate of isolated, nonpulsating M giants is generally assumed to be a few 10−7 M⊙ yr−1 (e.g., Livio & Warner 1984). The above requirements on Ṁacc for the case of an accreting WD in THA 15–31 would be easily met by conventional Roche-lobe overflow or by the wind Roche-lobe overflow suggested by the hydrodynamical simulations of Mohamed & Podsiadlowski (2012). If the orbital separation in THA 15–31 is too large for the RG to approach its Roche-lobe, the accretion needs to proceed via wind-intercept. Assuming the wind leaves the RG and travels distances longer than the orbital separation in a spherically symmetric arrangement, the standard Bondi–Hoyle treatment for wind-intercept (Livio & Warner 1984) shows that the companion captures only a few percent of the material lost by the RG, too low a fraction to account for the high Lacc observed in THA 15–31. This fraction needs to be one order of magnitude higher than allowed by the Bondi–Hoyle scenario, a condition frequently encountered in SySts (e.g., Skopal 2005). This can be explained by the companion’s gravitational focusing of the wind leaving the RG toward the orbital plane (e.g., Decin et al. 2019). The latter results in a strong density enhancement on the orbital plane at the expense of the polar directions: the higher density favors a higher accretion by the companion compared to the case of an unfocussed, spherically symmetric wind outflowing from the RG. The presence of a strong density enhancement on the equatorial plane of SySts is expected theoretically (Mohamed & Podsiadlowski 2007; Booth et al. 2016), and was confirmed by the marked bipolar shape observed for the spatially resolved nova ejecta of RS Oph (Ribeiro et al. 2009) and V407 Cyg (Giroletti et al. 2020), and inferred by modeling of line profiles in high-inclination systems like EG And by Shagatova et al. (2016, 2021).
In conclusion, an accretion disk around a WD provides the simplest and easiest explanation for the UV excess seen in THA 15–31, with a large space of parameters able to reproduce observations, and with the required mass-loss rate from the cool giant being a fine match to normal values. While there is no room for a NS in THA 15–31, a disk around an MS star could still fit the UVOT observations but only while invoking an accretion rate on the MS star of at least two orders of magnitude larger than the mass-loss rate typical of nonpulsating M giants. A rate of 1e−05 M⊙ yr−1 is achieved only at the tip of the AGB, where it may be supported by radial pulsations (Höfner & Olofsson 2018). These evolved giants are usually enshrouded in massive circumstellar cocoons abundant in dust, and may show over-abundance in s-element following third dredge-up episodes. Such an AGB is unlikely present in THA 15–31: no radial pulsations, or large dust excess, or even s-element overabundance is observed, and as noted in Fig. 1 the spectral match with normal M6III giants is instead perfect. Therefore, while the presence of an MS star in THA 15–31 cannot be excluded with absolute certainty, it would require that such an odd series of conditions be met that it is (highly) unlikely.
The brightness of THA 15–31 on the blue plates of the first Palomar all-sky photographic atlas was similar to current values, suggesting it was accreting to a comparable rate during the 1950s. It would be interesting to reconstruct its long-term light curve, for example from inspection of archive photographic plates, and ascertain for how long the current Ṁacc has been maintained. The presence or absence of past, unnoticed outbursts could then be compared with the stability of accretion disks in SySts over time, and the amount of material piled-up on the companion with the amount necessary to ignite nuclear burning on the surface of a WD.
Finally, the previous misclassification of THA 15–31 as a young stellar object suggests that other accreting-only symbiotic stars may be lurking in old YSO catalogs. Such misclassification is not unprecedented: a significant fraction of symbiotic stars of the burning type were originally discovered and classified as bona fide planetary nebulae: it was only the discovery at later times and on IR wavelengths of the presence of a cool giant in the system that led to rectification of their initial classification (e.g., Allen 1983; Acker & Stenholm 1990). In regard to this, we find that the IR selection criteria for SySts, derived by Akras et al. (2019b) following a machine learning approach, nicely distinguish THA 15–31 from true YSOs in the list of Hα emission stars for the Lupus and Scorpius regions compiled by The (1962).
We corrected an incorrect shape in the Fluks et al. spectrum over the 7300−8200 Å range and replaced the linear extrapolation below 3900 Å by substituting them with observations of HD 148783 that we obtained with the Asiago 1.22m+B&C telescope. This star is the prime standard for spectral type M6III according to the compilation by Yamashita et al. (1977).
Acknowledgments
We would like to thank the anonymous Referee for constructive suggestions that led to improve the paper. A. Skopal provided useful comments on an early version of this paper, and A. Siviero let us to access unpublished data from his atlas of high resolution spectra of Mira variables. We thank Jamie Kennea and the Swift team for the quick approval and the rapid acquisition of the observations we requested. NM acknowledges financial support through ASI-INAF and “Mainstream” agreement 2017-14-H.0 (PI: T. Belloni). JMA and AF acknowledge financial support from the project PRIN-INAF 2019 Spectroscopically Tracing the Disk Dispersal Evolution (STRADE). This work was supported by the Swedish strategic research programme eSSENCE. GT was supported by the project grant “The New Milky Way” from the Knut and Alice Wallenberg Foundation and by the grant 2016-03412 from the Swedish Research Council. GT also acknowledges financial support of the Slovenian Research Agency (research core funding no. P1-0188 and project N1-0040). This publication makes use of data products from the Near-Earth Object Wide-field Infrared Survey Explorer (NEOWISE), which is a joint project of the Jet Propulsion Laboratory/California Institute of Technology and the University of Arizona. NEOWISE is funded by the National Aeronautics and Space Administration.
References
- Acker, A., & Stenholm, B. 1990, A&AS, 86, 219 [NASA ADS] [Google Scholar]
- Akras, S., Guzman-Ramirez, L., Leal-Ferreira, M. L., & Ramos-Larios, G. 2019a, ApJS, 240, 21 [NASA ADS] [CrossRef] [Google Scholar]
- Akras, S., Leal-Ferreira, M. L., Guzman-Ramirez, L., & Ramos-Larios, G. 2019b, MNRAS, 483, 5077 [NASA ADS] [CrossRef] [Google Scholar]
- Alcalá, J. M., Stelzer, B., Covino, E., et al. 2011, Astron. Nachr., 332, 242 [CrossRef] [Google Scholar]
- Alcalá, J. M., Natta, A., Manara, C. F., et al. 2014, A&A, 561, A2 [NASA ADS] [CrossRef] [EDP Sciences] [Google Scholar]
- Alcalá, J. M., Manara, C. F., Natta, A., et al. 2017, A&A, 600, A20 [NASA ADS] [CrossRef] [EDP Sciences] [Google Scholar]
- Allen, D. A. 1982, The Nature of Symbiotic Stars (Dordrecht: Springer) [Google Scholar]
- Allen, D. A. 1983, MNRAS, 204, 113 [NASA ADS] [CrossRef] [Google Scholar]
- Allen, D. A. 1984, PASA, 5, 369 [NASA ADS] [CrossRef] [Google Scholar]
- Allen, D. A., & Glass, I. S. 1974, MNRAS, 167, 337 [CrossRef] [Google Scholar]
- Bailer-Jones, C. A. L. 2015, PASP, 127, 994 [Google Scholar]
- Belczyński, K., Mikołajewska, J., Munari, U., Ivison, R. J., & Friedjung, M. 2000, A&AS, 146, 407 [NASA ADS] [CrossRef] [EDP Sciences] [Google Scholar]
- Bellm, E. C., Kulkarni, S. R., Graham, M. J., et al. 2019, PASP, 131, 018002 [Google Scholar]
- Bessell, M. S. 1990, PASP, 102, 1181 [NASA ADS] [CrossRef] [Google Scholar]
- Booth, R. A., Mohamed, S., & Podsiadlowski, P. 2016, MNRAS, 457, 822 [NASA ADS] [CrossRef] [Google Scholar]
- Brand, J., & Blitz, L. 1993, A&A, 275, 67 [NASA ADS] [Google Scholar]
- Breeveld, A. A., Landsman, W., Holland, S. T., et al. 2011, AIP Conf. Proc., 1358, 373 [NASA ADS] [CrossRef] [Google Scholar]
- Buder, S., Sharma, S., Kos, J., et al. 2021, MNRAS, 506, 150 [NASA ADS] [CrossRef] [Google Scholar]
- Burrows, D. N., Hill, J. E., Nousek, J., et al. 2005, Space Sci. Rev., 120, 165 [NASA ADS] [CrossRef] [Google Scholar]
- Capitanio, L., Lallement, R., Vergely, J. L., Elyajouri, M., & Monreal-Ibero, A. 2017, A&A, 606, A65 [NASA ADS] [CrossRef] [EDP Sciences] [Google Scholar]
- Chen, H., Grenfell, T. G., Myers, P. C., & Hughes, J. D. 1997, ApJ, 478, 295 [NASA ADS] [CrossRef] [Google Scholar]
- Corradi, R. L. M., Valentini, M., Munari, U., et al. 2010, A&A, 509, A41 [NASA ADS] [CrossRef] [EDP Sciences] [Google Scholar]
- Cutri, R. M., Skrutskie, M. F., van Dyk, S., et al. 2003, VizieR On-line Data Catalog: II/246 [Google Scholar]
- Cutri, R. M., Wright, E. L., Conrow, T., et al. 2013, VizieR On-line Data Catalog: II/328 [Google Scholar]
- Decin, L., Homan, W., Danilovich, T., et al. 2019, Nat. Astron., 3, 408 [NASA ADS] [CrossRef] [Google Scholar]
- De Silva, G. M., Freeman, K. C., Bland-Hawthorn, J., et al. 2015, MNRAS, 449, 2604 [NASA ADS] [CrossRef] [Google Scholar]
- Drilling, J. S., & Landolt, A. U. 2000, Allen’s Astrophysical Quantities (New York: AIP Press), 381 [Google Scholar]
- Fitzpatrick, E. L. 1999, PASP, 111, 63 [Google Scholar]
- Fluks, M. A., Plez, B., The, P. S., et al. 1994, A&AS, 105, 311 [NASA ADS] [Google Scholar]
- Frasca, A., Guillout, P., Marilli, E., et al. 2006, A&A, 454, 301 [NASA ADS] [CrossRef] [EDP Sciences] [Google Scholar]
- Frasca, A., Biazzo, K., Alcalá, J. M., et al. 2017, A&A, 602, A33 [NASA ADS] [CrossRef] [EDP Sciences] [Google Scholar]
- Fujimoto, M. Y. 1982, ApJ, 257, 767 [NASA ADS] [CrossRef] [Google Scholar]
- Gaia Collaboration. 2020, VizieR On-line Data Catalog: I/350 [Google Scholar]
- Ghez, A. M., McCarthy, D. W., Patience, J. L., & Beck, T. L. 1997, ApJ, 481, 378 [Google Scholar]
- Giroletti, M., Munari, U., Körding, E., et al. 2020, A&A, 638, A130 [NASA ADS] [CrossRef] [EDP Sciences] [Google Scholar]
- Gómez, M., & Persi, P. 2002, A&A, 389, 494 [NASA ADS] [CrossRef] [EDP Sciences] [Google Scholar]
- Gontcharov, G. A., & Mosenkov, A. V. 2018, VizieR On-line Data Catalog: II/354 [Google Scholar]
- Green, G. M., Schlafly, E., Zucker, C., Speagle, J. S., & Finkbeiner, D. 2019, ApJ, 887, 93 [NASA ADS] [CrossRef] [Google Scholar]
- Hachenberg, O., & Wellmann, P. 1939, Z. Astrophys., 17, 246 [NASA ADS] [Google Scholar]
- Hellier, C. 2001, Cataclysmic Variable Stars (New York: Springer) [Google Scholar]
- Henden, A., & Munari, U. 2014, Contrib. Astron. Obs. Skalnatė, 43, 518 [Google Scholar]
- Hill, J. E., Burrows, D. N., Nousek, J. A., et al. 2004, Proc. SPIE, 5165, 217 [NASA ADS] [CrossRef] [Google Scholar]
- Höfner, S., & Olofsson, H. 2018, A&ARv, 26, 1 [Google Scholar]
- Hughes, J., Hartigan, P., Krautter, J., & Kelemen, J. 1994, AJ, 108, 1071 [NASA ADS] [CrossRef] [Google Scholar]
- Inglis, D. R., & Teller, E. 1939, ApJ, 90, 439 [NASA ADS] [CrossRef] [Google Scholar]
- Jaschek, C., & Jaschek, M. 1990, The Classification of Stars (Cambridge: Cambridge University Press) [Google Scholar]
- Jorissen, A. 2003, ASP Conf. Ser., 303, 25 [NASA ADS] [Google Scholar]
- Keenan, P. C. 1954, ApJ, 120, 484 [NASA ADS] [CrossRef] [Google Scholar]
- Kenyon, S. J. 1986, The Symbiotic Stars (Cambridge: Cambridge University Press) [CrossRef] [Google Scholar]
- Kenyon, S. J., & Webbink, R. F. 1984, ApJ, 279, 252 [NASA ADS] [CrossRef] [Google Scholar]
- Kirk, H., & Myers, P. C. 2011, ApJ, 727, 64 [Google Scholar]
- Kochanek, C. S., Shappee, B. J., Stanek, K. Z., et al. 2017, PASP, 129, 104502 [Google Scholar]
- Koornneef, J. 1983, A&A, 500, 247 [NASA ADS] [Google Scholar]
- Krautter, J., Wichmann, R., Schmitt, J. H. M. M., et al. 1997, A&AS, 123, 329 [NASA ADS] [CrossRef] [EDP Sciences] [Google Scholar]
- La Dous, C. 1989, A&A, 211, 131 [NASA ADS] [Google Scholar]
- Lallement, R., Vergely, J.-L., Valette, B., et al. 2014, A&A, 561, A91 [NASA ADS] [CrossRef] [EDP Sciences] [Google Scholar]
- Lee, T. A. 1970, ApJ, 162, 217 [NASA ADS] [CrossRef] [Google Scholar]
- Livio, M., & Warner, B. 1984, The Observatory, 104, 152 [NASA ADS] [Google Scholar]
- Lopes de Oliveira, R., Sokoloski, J. L., Luna, G. J. M., Mukai, K., & Nelson, T. 2018, ApJ, 864, 46 [NASA ADS] [CrossRef] [Google Scholar]
- López Martí, B., Jiménez-Esteban, F., & Solano, E. 2011, A&A, 529, A108 [NASA ADS] [CrossRef] [EDP Sciences] [Google Scholar]
- Lucy, A. B., Sokoloski, J. L., Munari, U., et al. 2020, MNRAS, 492, 3107 [NASA ADS] [CrossRef] [Google Scholar]
- Luna, G. J. M., Sokoloski, J. L., Mukai, K., & Nelson, T. 2013, A&A, 559, A6 [NASA ADS] [CrossRef] [EDP Sciences] [Google Scholar]
- Luna, G. J. M., Mukai, K., Sokoloski, J. L., et al. 2018, A&A, 616, A53 [NASA ADS] [CrossRef] [EDP Sciences] [Google Scholar]
- Luna, G. J. M., Sokoloski, J. L., Mukai, K. M., & Kuin, N. P. 2020, ApJ, 902, L14 [NASA ADS] [CrossRef] [Google Scholar]
- Luri, X., Brown, A. G. A., Sarro, L. M., et al. 2018, A&A, 616, A9 [NASA ADS] [CrossRef] [EDP Sciences] [Google Scholar]
- Mainzer, A., Bauer, J., Grav, T., et al. 2011, ApJ, 731, 53 [Google Scholar]
- Mainzer, A., Bauer, J., Cutri, R. M., et al. 2014, ApJ, 792, 30 [Google Scholar]
- Marshall, D. J., Robin, A. C., Reylé, C., Schultheis, M., & Picaud, S. 2006, A&A, 453, 635 [NASA ADS] [CrossRef] [EDP Sciences] [Google Scholar]
- Masci, F. J., Laher, R. R., Rusholme, B., et al. 2019, PASP, 131, 018003 [Google Scholar]
- Masetti, N., Rigon, E., Maiorano, E., et al. 2007a, A&A, 464, 277 [NASA ADS] [CrossRef] [EDP Sciences] [Google Scholar]
- Masetti, N., Landi, R., Pretorius, M. L., et al. 2007b, A&A, 470, 331 [NASA ADS] [CrossRef] [EDP Sciences] [Google Scholar]
- Merc, J., Gális, R., & Wolf, M. 2019, Astron. Nachr., 340, 598 [NASA ADS] [CrossRef] [Google Scholar]
- Michalitsianos, A. G., Perez, M., Shore, S. N., et al. 1993, ApJ, 409, L53 [NASA ADS] [CrossRef] [Google Scholar]
- Modigliani, A., Goldoni, P., Royer, F., et al. 2010, SPIE, 7737, 773728 [NASA ADS] [Google Scholar]
- Mohamed, S., & Podsiadlowski, P. 2007, ASP Conf. Ser., 372, 397 [Google Scholar]
- Mohamed, S., & Podsiadlowski, P. 2012, Balt. Astron., 21, 88 [Google Scholar]
- Mucciarelli, P., Zampieri, L., Treves, A., et al. 2007, ApJ, 658, 999 [NASA ADS] [CrossRef] [Google Scholar]
- Mukai, K., Luna, G. J., Cusumano, G. I., et al. 2016, MNRAS, 461, L1 [NASA ADS] [CrossRef] [Google Scholar]
- Munari, U. 2019, in The Impact of Binary Stars on Stellar Evolution, eds. G. Beccari, & H. M. J. Boffin (Cambridge: Cambridge University Press), 77 [arXiv:1909.01389] [Google Scholar]
- Munari, U., & Zwitter, T. 1997, A&A, 318, 269 [NASA ADS] [Google Scholar]
- Munari, U., & Zwitter, T. 2002, A&A, 383, 188 [NASA ADS] [CrossRef] [EDP Sciences] [Google Scholar]
- Munari, U., Sordo, R., Castelli, F., & Zwitter, T. 2005, A&A, 442, 1127 [NASA ADS] [CrossRef] [EDP Sciences] [Google Scholar]
- Munari, U., Dallaporta, S., & Cherini, G. 2016, New Astron., 47, 7 [NASA ADS] [CrossRef] [Google Scholar]
- Munari, U., Traven, G., Masetti, N., et al. 2021, MNRAS, 505, 6121 [NASA ADS] [CrossRef] [Google Scholar]
- Mužić, K., Scholz, A., Geers, V. C., Jayawardhana, R., & López Martí, B. 2014, ApJ, 785, 159 [Google Scholar]
- Nomoto, K., Saio, H., Kato, M., & Hachisu, I. 2007, ApJ, 663, 1269 [Google Scholar]
- Nucita, A. A., Stefanelli, S., De Paolis, F., et al. 2014, A&A, 562, A55 [NASA ADS] [CrossRef] [EDP Sciences] [Google Scholar]
- Nuernberger, D., Chini, R., & Zinnecker, H. 1997, A&A, 324, 1036 [NASA ADS] [Google Scholar]
- Nuñez, N. E., Nelson, T., Mukai, K., Sokoloski, J. L., & Luna, G. J. M. 2016, ApJ, 824, 23 [CrossRef] [Google Scholar]
- Osterbrock, D. E., & Ferland, G. J. 2006, Astrophysics of Gaseous Nebulae and Active Galactic Nuclei (Sausalito: University Science Books) [Google Scholar]
- Pantaleoni González, M., Maíz Apellániz, J., Barbá, R. H., & Negueruela, I. 2020, Res. Notes AAS, 4, 12 [CrossRef] [Google Scholar]
- Patruno, A., & Zampieri, L. 2008, MNRAS, 386, 543 [NASA ADS] [CrossRef] [Google Scholar]
- Poole, T. S., Breeveld, A. A., Page, M. J., et al. 2008, MNRAS, 383, 627 [Google Scholar]
- Ribeiro, V. A. R. M., Bode, M. F., Darnley, M. J., et al. 2009, ApJ, 703, 1955 [NASA ADS] [CrossRef] [Google Scholar]
- Roming, P. W. A., Kennedy, T. E., Mason, K. O., et al. 2005, Space Sci. Rev., 120, 95 [Google Scholar]
- Sale, S. E., Drew, J. E., Barentsen, G., et al. 2014, MNRAS, 443, 2907 [NASA ADS] [CrossRef] [Google Scholar]
- Schwartz, R. D. 1977, ApJS, 35, 161 [Google Scholar]
- Shappee, B. J., Prieto, J. L., Grupe, D., et al. 2014, ApJ, 788, 48 [Google Scholar]
- Shagatova, N., Skopal, A., & Cariková, Z. 2016, A&A, 588, A83 [NASA ADS] [CrossRef] [EDP Sciences] [Google Scholar]
- Shagatova, N., Skopal, A., Shugarov, S. Y., et al. 2021, A&A, 646, A116 [NASA ADS] [CrossRef] [EDP Sciences] [Google Scholar]
- Shen, K. J., & Bildsten, L. 2007, ApJ, 660, 1444 [NASA ADS] [CrossRef] [Google Scholar]
- Shore, S. N., Aufdenberg, J. P., & Michalitsianos, A. G. 1994, AJ, 108, 671 [NASA ADS] [CrossRef] [Google Scholar]
- Skopal, A. 2005, A&A, 440, 995 [NASA ADS] [CrossRef] [EDP Sciences] [Google Scholar]
- Sokoloski, J. L. 2003, ASP Conf. Proc., 303, 202 [NASA ADS] [Google Scholar]
- Sowell, J. R., Trippe, M., Caballero-Nieves, S. M., & Houk, N. 2007, AJ, 134, 1089 [NASA ADS] [CrossRef] [Google Scholar]
- Starrfield, S., Bose, M., Iliadis, C., et al. 2020, ApJ, 895, 70 [NASA ADS] [CrossRef] [Google Scholar]
- Straižys, V. 1992, Multicolor Stellar Photometry (Tucson: Pachart Publishing House) [Google Scholar]
- Stute, M., & Sahai, R. 2009, A&A, 498, 209 [NASA ADS] [CrossRef] [EDP Sciences] [Google Scholar]
- The, P.-S. 1962, On faint H-alpha emission stars in Lupus and Scorpius (Lembang: Contr. from the Bosscha Observ.), 15 [Google Scholar]
- Tomov, T., Kolev, D., Georgiev, L., et al. 1990, Nature, 346, 637 [NASA ADS] [CrossRef] [Google Scholar]
- Tomov, T., Kolev, D., Ivanov, M., et al. 1996, A&AS, 116, 1 [NASA ADS] [Google Scholar]
- Vaughan, A. H., & Zirin, H. 1968, ApJ, 152, 123 [NASA ADS] [CrossRef] [Google Scholar]
- Wolf, W. M., Bildsten, L., Brooks, J., & Paxton, B. 2013, ApJ, 777, 136 [Google Scholar]
- Wolf, C., Onken, C. A., Luvaul, L. C., et al. 2018, PASA, 35, e010 [Google Scholar]
- Wu, C. C., Boggess, A., Bohlin, R. C., et al. 1982, in The IUE Spectral Atlas, ESA Ultraviolet Stellar Classification Classification, 182, 25 [NASA ADS] [Google Scholar]
- Yamashita, Y., Nariai, K., & Norimoto, Y. 1977, An Atlas of Representative Stellar Spectra (Tokyo: University of Tokyo Press) [Google Scholar]
- Zamanov, R., Boeva, S., Latev, G., et al. 2011, IBVS, 5995, 1 [NASA ADS] [Google Scholar]
- Zamanov, R. K., Boeva, S., Nikolov, Y. M., et al. 2017, Astron. Nachr., 338, 680 [NASA ADS] [CrossRef] [Google Scholar]
All Tables
Heliocentric wavelength of line photo-center, corresponding heliocentric radial velocity, and integrated flux for emission lines identified in the X-shooter spectrum of THA 15–31.
All Figures
|
Fig. 1. Optical spectrum of THA 15−31 as recorded with X-shooter (black) is fitted (red) by combining the spectrum of the cool giant (M6III, green spectrum) and that of the hot companion (blue line). The latter is a bremsstrahlung spectrum taken to approximate the mix of the accretion disk, the central star, and possibly some RG wind ionized by them. The spectra of the M6III cool giant and of the hot companion are reddened by EB − V = 0.38 following the Fitzpatrick (1999) reddening law for the standard RV = 3.1 case. The inset is a zoomed-in view of the head of the Balmer series and the Balmer jump. |
| In the text | |
|
Fig. 2. Epoch photometry of THA 15−31 in the infrared W1 and W2 bands as recorded by the NeoWISE mission. The thick red horizontal mark is the corresponding value listed in the AllWISE catalog (see Sect. 3.3 for details). |
| In the text | |
|
Fig. 3. ASASSN V-band light curve of the blend composed by THA 15−31 and the nearby field star 2MASS 16083631−4016120, recorded together as a single unresolved source. |
| In the text | |
|
Fig. 4. Spectral energy distribution of THA 15−31 (black dots and black/green line) corrected for EB − V = 0.38 reddening and compared to that of a normal, single M6III star (red dots and line). |
| In the text | |
|
Fig. 5. THA 15−31 in the near infrared. Top and central panels: THA 15−31 (black line) is overplotted to Fig. 4 from Akras et al. (2019a). Bottom panel: energy distribution of THA 15−31 fitted with a single blackbody in the same fashion as Fig. 3 of Akras et al. (2019a). See discussion in Sect. 3.4. |
| In the text | |
|
Fig. 6. Line profiles for THA 15−31. Top and central rows: profiles for a sample of the emission lines recorded on the X-shooter spectrum of THA 15−31. Bottom row: some additional spectral features from the same spectrum and discussed in the text. All panels are plotted over the same velocity scale. The thin vertical lines mark the laboratory wavelength in the rest frame of the red giant. |
| In the text | |
|
Fig. 7. Examples of fitting the SED of THA 15–31 combining the M6III with an accretion disk (and its central object) around a neutron star (top), a white dwarf (center), and a main sequence star (bottom). Details are discussed in Sect. 3.8. The arrow on the left marks the upper limit in X-rays from Swift-XRT observations. The reference distribution for the M6III is the same as that used in Fig. 1. |
| In the text | |
Current usage metrics show cumulative count of Article Views (full-text article views including HTML views, PDF and ePub downloads, according to the available data) and Abstracts Views on Vision4Press platform.
Data correspond to usage on the plateform after 2015. The current usage metrics is available 48-96 hours after online publication and is updated daily on week days.
Initial download of the metrics may take a while.