Free Access
Fig. 5.
Download original image
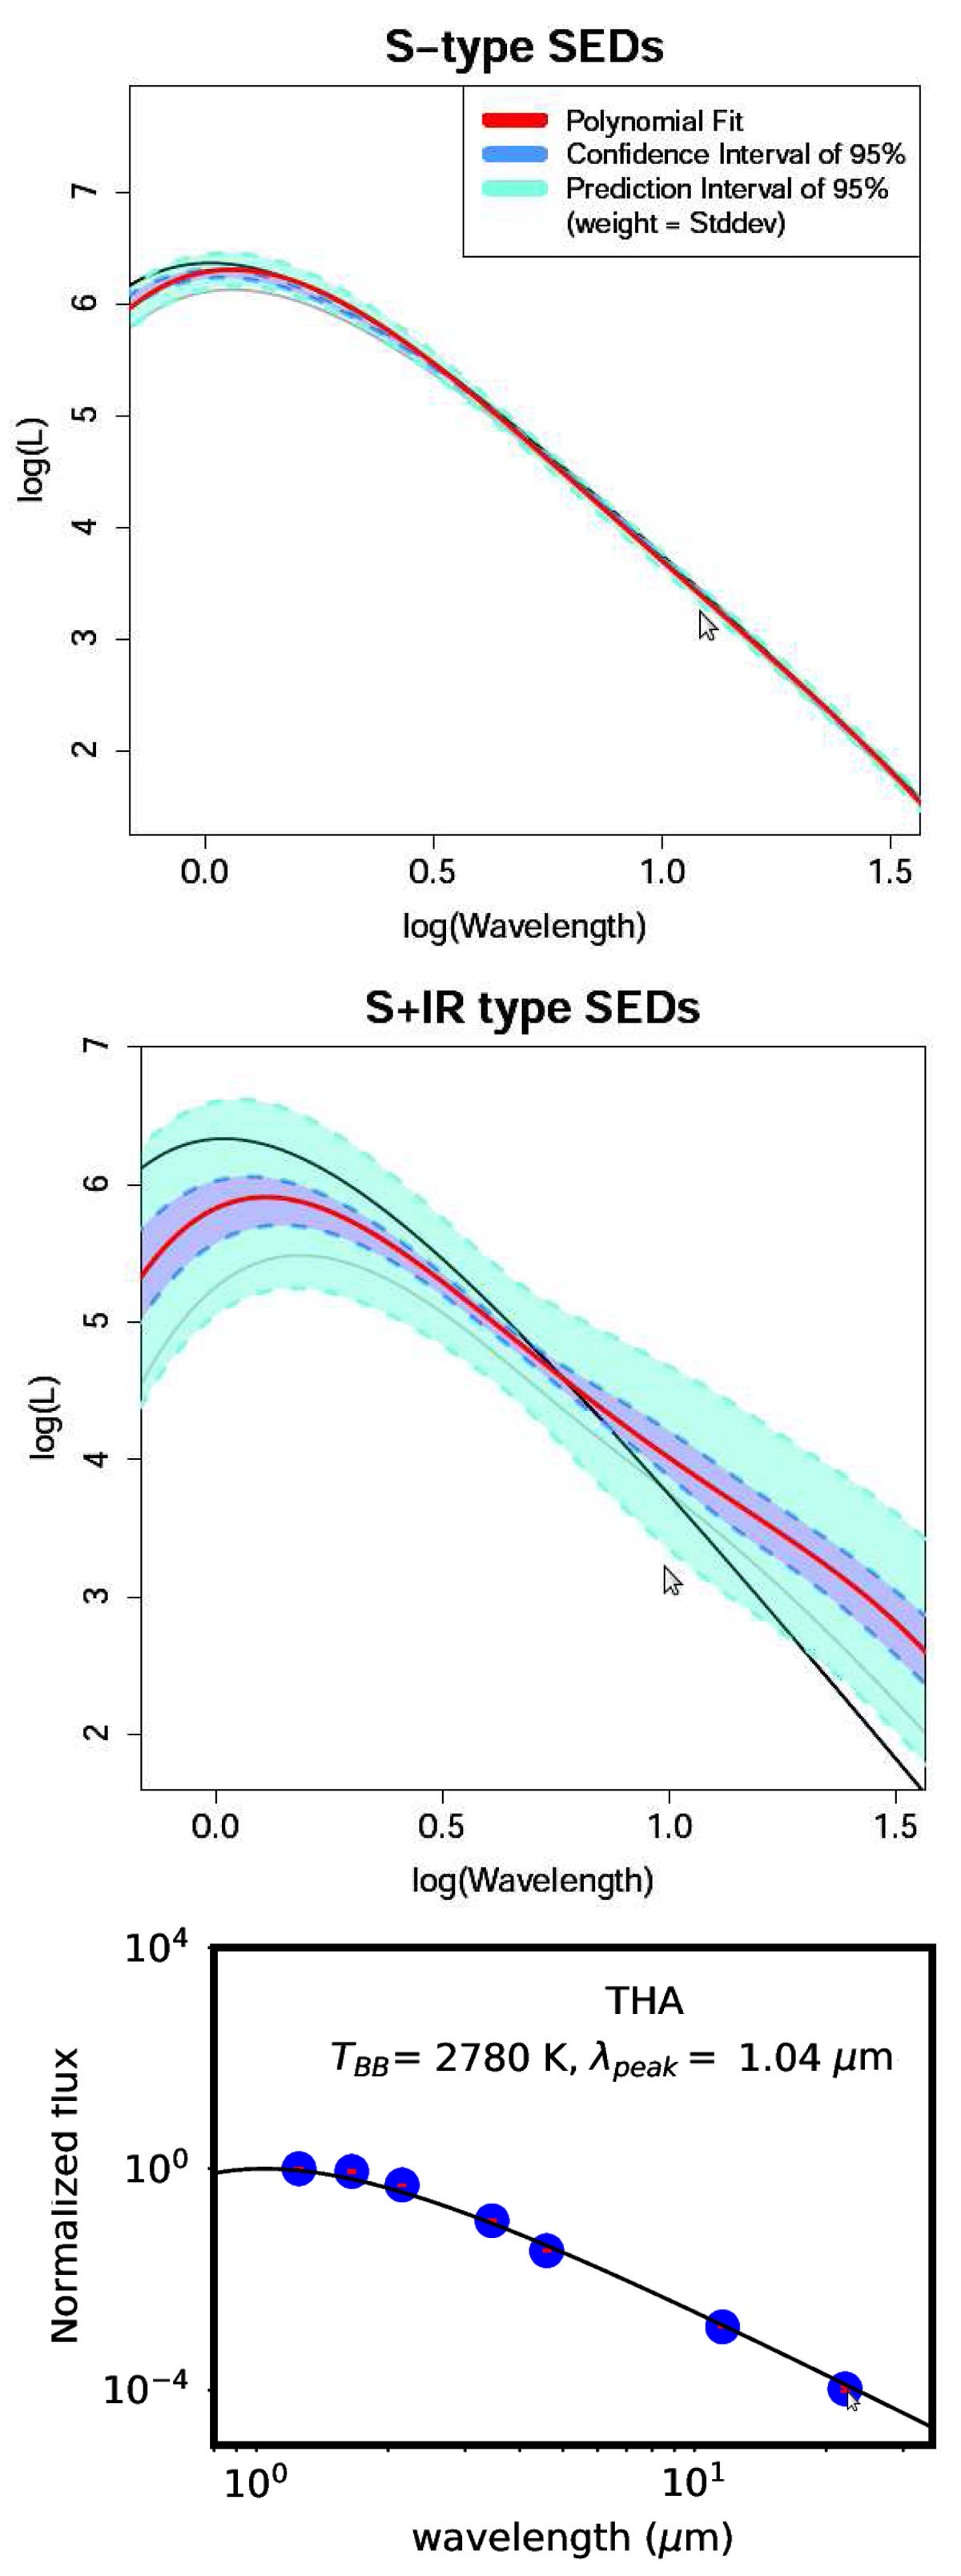
THA 15−31 in the near infrared. Top and central panels: THA 15−31 (black line) is overplotted to Fig. 4 from Akras et al. (2019a). Bottom panel: energy distribution of THA 15−31 fitted with a single blackbody in the same fashion as Fig. 3 of Akras et al. (2019a). See discussion in Sect. 3.4.
Current usage metrics show cumulative count of Article Views (full-text article views including HTML views, PDF and ePub downloads, according to the available data) and Abstracts Views on Vision4Press platform.
Data correspond to usage on the plateform after 2015. The current usage metrics is available 48-96 hours after online publication and is updated daily on week days.
Initial download of the metrics may take a while.