Fig. 6.
Download original image
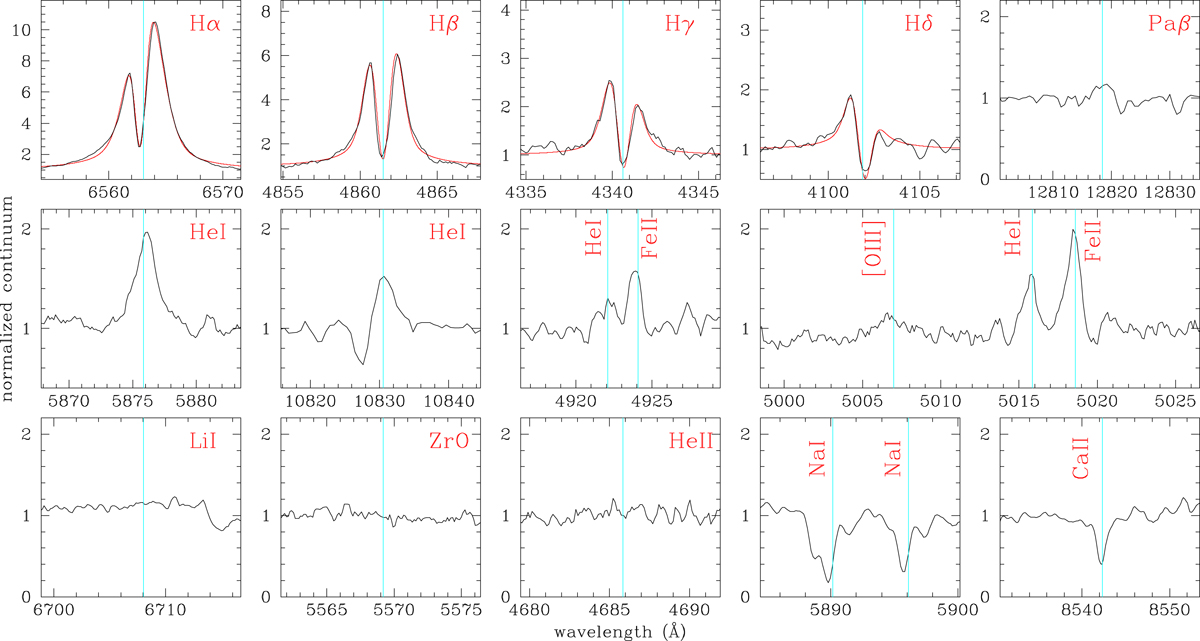
Line profiles for THA 15−31. Top and central rows: profiles for a sample of the emission lines recorded on the X-shooter spectrum of THA 15−31. Bottom row: some additional spectral features from the same spectrum and discussed in the text. All panels are plotted over the same velocity scale. The thin vertical lines mark the laboratory wavelength in the rest frame of the red giant.
Current usage metrics show cumulative count of Article Views (full-text article views including HTML views, PDF and ePub downloads, according to the available data) and Abstracts Views on Vision4Press platform.
Data correspond to usage on the plateform after 2015. The current usage metrics is available 48-96 hours after online publication and is updated daily on week days.
Initial download of the metrics may take a while.