| Issue |
A&A
Volume 661, May 2022
The Early Data Release of eROSITA and Mikhail Pavlinsky ART-XC on the SRG mission
|
|
|---|---|---|
| Article Number | A45 | |
| Number of page(s) | 8 | |
| Section | Stellar structure and evolution | |
| DOI | https://doi.org/10.1051/0004-6361/202141821 | |
| Published online | 18 May 2022 | |
SRG/ART-XC, Swift, NICER, and NuSTAR study of different states of the transient X-ray pulsar MAXI J0903–531
1
Space Research Institute of the Russian Academy of Sciences,
Profsoyuznaya Str. 84/32,
Moscow
117997,
Russia
e-mail: This email address is being protected from spambots. You need JavaScript enabled to view it.
2
Department of Physics and Astronomy, 20014 University of Turku,
Finland
e-mail: This email address is being protected from spambots. You need JavaScript enabled to view it.
3
Institut für Astronomie und Astrophysik, Universität Tübingen,
Sand 1,
72076
Tübingen,
Germany
4
Leiden Observatory, Leiden University,
2300
RA Leiden,
The Netherlands
5
Dr. Remeis-Observatory & Erlangen Centre for Astroparticle Physics, Friedrich-Alexander-Universität Erlangen-Nürnberg,
Sternwartstr. 7,
96049
Bamberg,
Germany
Received:
17
July
2021
Accepted:
12
August
2021
Abstract
The results of the broadband spectral and timing study of the recently discovered transient X-ray pulsar MAXI J0903–531 in a wide range of luminosities that differ by a factor of ~30 are reported. The observed X-ray spectrum in both states can be described as a classical pulsar-like spectrum consisting of a power law with a high-energy cutoff. We argue that the absence of the spectrum transformation to the two-hump structure that is expected at low fluxes indicates that the magnetic field of the neutron star is relatively weak below (2–3) × 1012 G. This estimate is consistent with other indirect constraints and non-detection of any absorption features that might be interpreted as a cyclotron absorption line. The timing analysis of the NuSTAR data revealed only slight variations of a single-peaked pulse profile of the source as a function of the energy band and mass accretion rate. In both intensity states, the pulsed fraction increases from 40% to roughly 80% with the energy. Finally, we were also able to obtain the orbital solution for the binary system using data from the Fermi/GBM, NICER, and NuSTAR instruments.
Key words: accretion, accretion disks / magnetic fields / X-rays: binaries / stars: neutron / pulsars: individual: MAXI J0903-531 / radiative transfer
© ESO 2022
1 Introduction
The transient X-ray source MAXI J0903–531 was discovered with the MAXI/GSC nova alert system on April 14, 2021, with an indication of a gradual increase in flux (Yamaoka et al. 2021). An accurate source localisation with coordinates of αJ2000.0 = 136°.27866, δJ2000.0 = –53° 50518 (2″.8 uncertainty radius at the 90% confidence level) was obtained two days later with the Swift/XRT telescope (Kennea et al. 2021). Kennea et al. reported a possible optical counterpart, Gaia EDR3 source 5311384333263075840, with a distance estimated at about 10 kpc (Bailer-Jones et al. 2021). A subsequent discovery of coherent pulsations with a period of P = 14.055 s (Ray et al. 2021) by the NICER telescope then allowed an unambiguous identification of the object as a transient X-ray pulsar (XRP). A spectral type of the companion star of B1.5–2 III-Ve was determined using observations at the Southern African Large Telescope (SALT; Monageng et al. 2021), suggesting that MAXI J0903–531 is a new Galactic Be X-ray binary system (Be/XRP).
Analysis of the long-term monitoring of the companion star from the ASAS-SN project revealed a strong modulation at a period of 3.84 days with an amplitude of 0.05 magnitudes (Monageng et al. 2021). Another periodicity at 0.79 days was found using the Transiting Exoplanet Survey Satellite (TESS) data. This might be interpreted as a pulsation period or the rotation period of the Be star (Rivera Sandoval et al. 2021). This periodicity was later confirmed using the OGLE survey data (Udalski 2021), although the authors suggested that the 3.8 d periodicity is a 1-day alias of the 0.79 days period. Based on the analysis of long-term monitoring data from the Swift/BAT transient monitor and Fermi/GBM monitor, another longer periodicity with a period of about 57 days was later found by Corbet et al. (2021). Assuming that this is the orbital period, the location of MAXI J0903–531 in the Corbet diagram (Corbet 1986) supports its Be/XRP classification.
Based on the NICER data, it was shown that the 0.5–10 keV energy spectrum cannot be described by just an absorbed power-law model, but an additional blackbody component with a temperature of kT = 0.61 ± 0.02 keV is required (Ray et al. 2021). Closer to the end of the outburst, when MAXI J0903–531 faded to the 3–50 keV flux of 1.35 × 10⁻¹¹ ergs−1 cm−2 (i.e. about 40 times lower than the peak of the outburst), the source was also observed with the NuSTAR observatory in the broad energy band (Thalhammer et al. 2021). It was shown that the broadband energy spectrum can be fitted with an absorbed cutoff power-law model with a photon index of 1.25 and a folding energy of 27 keV. The absorption column density and blackbody component could not be constrained with the available data. MAXI J0903–531 therefore demonstrates a clear transient behaviour and was observed in a very wide range of luminosities.
The timing and spectral properties of accreting XRPs differ significantly at low- and high-mass accretion rates. This sheds light on different physical aspects of the emission production and the interaction with matter in the presence of extreme magnetic fields. We therefore focus on reporting results of the detailed study of the temporal and spectral properties of MAXI J0903–531 using the data from various X-ray instruments in the broad energy band at mass accretion rates that differ by a factor of ~30.
2 Data analysis
As described above, MAXI J0903–531 was observed with different X-ray and optical facilities since its discovery. Below, we briefly describe the reduction procedures for each of the data sets we used. The observations are listed in Table 1.
2.1 NuSTAR
The main instrument for our study is the NuSTAR observatory. It hosts two identical focal plane modules A and B (FPMA and FPMB; Harrison et al. 2013) that cover the broad energy range of 3–79 keV. NuSTAR observed MAXI J0903–531 twice: the first time on May 3, 2021 (ObsID 90701315002), about two weeks after the discovery of the source and thus already closer to the end of an outburst at a comparatively low luminosity (Thalhammer et al. 2021). The second observation was performed on June 10, 2021 (ObsID 90701320002), following a trigger by the SRG/ART-XC telescope, which discovered the resumed activity of MAXI J0903–531, so that the flux in the second observation is higher by a factor of 30 than in the first NuSTAR pointing.
The data for both observations were reduced following the standard procedures described in the NuSTAR user guide and using the standard NuSTAR Data Analysis Software NUSTARDAS v1.9.6 with the CALDB version 20 210 524. The source and background spectra and light curves were extracted from circular regions with radii of 50″ and 150″ in the low state (observation 90701315002) and 60″ and 150″ in the bright state (observation 90701320002), respectively. The background in both cases was extracted from a source-free region in the corner of the field of view. The scientific products were obtained using the NUPRODUCTS routine with the default parameters. Energy spectra were optimally rebinned using the prescription from Kaastra & Bleeker (2016). The light curves were background and baricentrically corrected. In order to increase statistics, we added the light curves from the two NuSTAR modules (FPMA and FPMB).
2.2 SRG/ART-XC
The Spectrum Roentgen Gamma (SRG) observatory (Sunyaev et al. 2021) hosts two X-ray telescopes: the Mikhail Pavlinsky ART-XC, operating in the 4–30 keV energy range (Pavlinsky et al. 2021), and eROSITA, operating in the 0.2–10 keV (Predehl et al. 2021). This mission aims at the most sensitive all-sky survey in the X-ray band.
SRG/ART-XC observed MAXI J0903–531 both during the surveys (on June 2, 2020; December 6, 2020; and June 6, 2021) and during the technical stop (parking position) before the orbit correction on May 23, 2021. In the survey mode, each source on the sky is observed once in half a year, with an exposure time of about several dozen seconds. In the low-intensity state, this exposure allowed us to only detect the source and roughly estimate its flux. The exposure collected during the parking position is much longer (5.9 ks). This observation allowed us to measure the source spectrum and determine its flux very accurately. During the third all-sky survey scan, on June 6, 2021, the source was also bright enough to reconstruct its spectrum with ART-XC. As described above, this observation was a trigger for the follow-up observation with NuSTAR.
The ART-XC telescope consists of seven identical grazing-incidence focusing modules with a total effective area of ~450 cm2 at 6 keV, an energy resolution of 1.4 keV at 6 keV, an angular resolution of ~50″, and a timing resolution of 23 μs. ART-XC data were processed with the analysis software ART-PRODUCTS v0.9 and with ART-XC CalDB version 20200401. A description of the ART-XC telescope and the software can be found in Pavlinsky et al. (2021). All energy spectra were rebinned to have at least 1 count per energy channel.
Observations of MAXI J0903–531.
2.3 NICER
Soon after the source was discovered, the Neutron star Interior Composition Explorer (NICER; Gendreau et al. 2012) started its monitoring with a cadence of about one day. The monitoring continued for almost 40 days and covered the whole outburst and some fraction of the quiescent period before the next outburst. We use the NICER data that were collected until MAXI J0903–531 entered the low-luminosity state when its flux became background dominated, that is, above F0.5–10 keV ~ 10−11 erg s−1 cm−2 (or before MJD 59 335).
The raw NICER data were reduced using the NICERDAS software version 7a, and the default filtering criteria were applied. The background was estimated using the tool NIBACKGEN3C501 (Remillard et al., in prep.) with the default parameters. Each spectrum was binned to have at least 1 count per energy channel.
2.4 Swift
To study the long-term behaviour of the source, including in the quiescent state, simultaneously with our NuSTAR observation in the bright state, we triggered a two-month monitoring of MAXI J0903–531 with the XRT telescope (Burrows et al. 2005) on board the Neil Gehrels Swift Observatory (Gehrels et al. 2004) with a cadence of 3 days. Depending on the source brightness, the data were collected either in the photon-counting (PC) or windowed-timing (WT) mode. The spectra for each observation were extracted using the online tools (Evans et al. 2009) provided by the UK Swift Science Data Centre2 and were binned to have at least 1 count per energy channel.
3 Results
Using all available observations described above, we are able to study the temporal and spectral properties of MAXI J0903–531 at different timescales and mass accretion rates. The overall light curve of the source covering about four months of observations is presented in Fig. 1. In addition, we separately discuss results obtained in two deep observations with NuSTAR, which also allow a detailed spectral analysis in the broad energy band.
3.1 Timing analysis
MAXI J0903–531 demonstrates strong flux variability at different timescales. As shown by Corbet et al. (2021), at long timescales, the source exhibits a transient behaviour with a period of about 57 days. The authors suggested that this activity is connected to periastron passages of the neutron star in an eccentric binary system. At short timescales, the flux from MAXI J0903–531 pulsates with a period of ~14 s (Ray et al. 2021). We discuss the variations in spin frequency and pulse profiles of the source throughout the outburst.
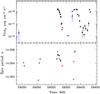 |
Fig. 1 Light curve of MAXI J0903–531 from the all available data (top). An observed flux is given in the 0.5–10 keV energy band for Swift/XRT (black) and NICER (grey), and in the 4–12 keV for SRG/ART-XC (blue) and NuSTAR (red). Bottom: baricentre-corrected spin period of the pulsar obtained from Fermi/GBM (open circles), NICER (grey), and NuSTAR (red). |
3.1.1 Spin frequency changes and binary orbit
Using the background-subtracted and baricentre-corrected light curves, we measured the spin period of pulsar in all available NICER and NuSTAR observations, applying the standard epoch folding technique (EFSEACH tool from the FTOOLS package; Leahy 1987). The uncertainty on the spin period was estimated as described by Boldin et al. (2013). In addition, measurements provided by the Fermi/GBM XRPs monitoring project3 were also used. Low count statistics did not allow us to detect pulsations in the SRG/ART-XC data. Because no orbital parameters except for the tentatively identified 57-day orbital period are known, no binary correction was applied to the light curves for the initial timing analysis. The resulting dependence of the apparent spin period of MAXI J0903–531 on time is shown in the bottom panel of Fig. 1.
Figure 1 shows that both the observed spin frequency and flux of MAXI J0903–531 exhibit ~57 days periodic variations that are likely associated with the orbital modulation. The very strong apparent spin-down just before the outburst and the gradual spin-up after the peak of the outburst is opposite to what is expected from an accreting neutron star under the influence of an accretion torque, and can only be explained by a Doppler effect associated with orbital motion. In addition, a possible long-term spin-down trend is observed, as was already mentioned by Corbet et al. (2021).
To recover the intrinsic spin evolution of the pulsar and orbital ephemerides, we modelled the observed spin frequency changes. To model the observed spin history, we used an approach similar to that used by Doroshenko et al. (2016). However, considering that only a few measurements of spin frequency are available that only cover a limited orbital phase interval, we adopted a simplified approach. In particular, we described the intrinsic spin history as a piecewise linear function characterised by steady spin-up and spin-down during and between the outbursts, respectively. The frequency change rates were considered as free parameters in both cases, but were assumed to equal for all burst or quiescence intervals. The reference epoch for the spin-up episodes during the outbursts was assumed to coincide with the periastron passage, and quiescent periods were assumed to start 15 days later (which corresponds to the approximate duration of the bright phase of the outburst in which spin-up can be expected) as the reference epoch for inter-burst periods. To avoid jumps in the assumed spin frequency, the resulting piecewise function was additionally smoothed with a 15-day-long Hann window. This mimics the expected changes in spin frequency due to accretion torque in a series of short outbursts quite well.
We emphasise that the model described above is just a rough approximation of the actual intrinsic spin frequency changes. The available data, however, are insufficient to model it more accurately based on the observed flux (as was done e.g. in Tsygankov et al. 2017a; Doroshenko et al. 2018). On the other hand, the accuracy of the spin frequency measurements and the contribution of the intrinsic spin variations are also lower for MAXI J0903–531, so that an accurate description of the intrinsic frequency variations is less important. We verified, for instance, that the derived orbital parameters are almost unaffected when steady spin-down instead of the more complex model adopted above is assumed. This is also confirmed by the fact that best-fit spin-up rate for outbursts is both consistent with zero and with the expected spin-up rate for a neutron star with standard parameters, accreting at an observed luminosity of ~4.5 × 1036 erg s−1. An upper limit on the expected spin-up rate might be derived assuming that the pulsar is close to co-rotation at  , where Rc = (GM/(2πv)2)1/3 ~ 109 cm is the co-rotation radius. The resulting value of 2.6 × 10⁻⁷ Hz day−1 is consistent with our best-fit value, which is also consistent with zero. We therefore conclude that the quality of the available frequency measurements is insufficient to study the intrinsic variations of the spin frequency in detail and that the observed spin evolution is dominated by orbital motion. The derived orbital parameters are therefore only weakly sensitive to assumptions regarding the intrinsic spin variations. The best-fit results are presented in Fig. 2 and Table 2. The reported uncertainties do not account for the systematic effects mentioned above and only reflect statistical uncertainties. The combination of the orbital period and eccentricity obtained for MAXI J0903–531 is typical for the Galactic Be/XRPs (e.g. Townsend et al. 2011).
3.1.2 Energy dependence of the pulse profiles
Sufficiently high count statistics in the NuSTAR data allowed us to study the pulse profile shape as a function of energy range and the source luminosity. Figure 3 shows that the source profile in general is single peaked and only slightly depends on energy. Particularly at energies below 10 keV, it consists of four sub-peaks with increasing domination of one of them at higher energies. This picture is characteristic for the high and low states of the source. At the highest energies (above 40 keV), pulsations are detected only in the brightest observation due to better counting statistics. The pulsed fraction (defined as (Fmax − Fmin)/(Fmax + Fmin), where Fmax and Fmin are the maximum and minimum fluxes in the pulse profile, respectively) increases from 40% to roughly 80% for both states (see Fig. 4). This behaviour is typical for most XRPs (Lutovinov & Tsygankov 2009).
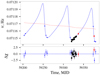 |
Fig. 2 Spin history of the source as observed by Fermi/GBM (blue dots), NICER (black squares), and NuSTAR (red diamonds). The final model including the intrinsic spin frequency variations (red) and those due to the orbital motion (blue) together with the best-fit residuals (lower panel) are also shown. |
Best-fit orbital parameters assuming constant spin-up during outbursts and spin-down between the outbursts.
3.2 Spectral analysis
The spectral properties of MAXI J0903–531 in the low state were studied based on the NuSTAR data (ObsID 90701315002) by Thalhammer et al. (2021). The authors showed that the spectrum can be fitted with a model consisting of a simple absorbed cutoff power-law (CUTOFFPL in XSPEC) with a photon index of  keV and a hydrogen column density fixed at NH = 4.1 × 1021 cm−2. To facilitate comparison of the spectra of MAXI J0903–531 in different intensity states, we uniformly reanalysed all available data. To expand our analysis to the lower energies, we jointly fitted the NuSTAR spectra with the Swift/XRT data collected several days apart from the NuSTAR observations. Particularly, NuSTAR observation 90701315002 was analysed together with XRT observation 00014281005, and NuSTAR observation 90701320002 with the XRT observation 00014281006 (see Table 1). The data from Swift/XRT and NuSTAR were used in the 0.3–10 keV and 3–79 keV bands, respectively. The two broadband spectra were also supplemented with the SRG/ART-XC data in the 4–20 keV energy band (ObsIDs 12110050001 and 13000600100, respectively). To fit the data, we used the XSPEC package (Arnaud 1996) applying W-statistic4 (Wachter et al. 1979) appropriate for modelling the background-subtracted spectra in the low-count regime.
In order to describe the source spectrum acceptably, we used several phenomenological models broadly applied to fit continua of XRPs. We started with CUTOFFPL, modified with a photoelectric absorption model (TBABS in XSPEC, with abundances from Wilms et al. 2000) and the fluorescent emission iron line in the form of an additive Gaussian component (GAU in XSPEC). Although this model fits the spectrum of MAXI J0903–531 in the low state, it is unable to reproduce its spectrum in the high state, resulting in a C-stat (d.o.f.) = 3345.5(707). A Comptonisation model (COMPTT in XSPEC) also produces strong residuals around 10 and 40 keV with a resulting C-stat (d.o.f.) =1313.8(707).
Finally, we were able to obtain a perfect fit using an absorbed power-law model modified with a high-energy exponential cutoff and the iron line (TBABS × (PO × HIGHECUT + GAU); see Fig. 5). To remove artificial absorption-like residuals around the cutoff energy Ecut that are inherently present in this continuum model due to the discontinuity at the cutoff, we also introduced a narrow and shallow (σ = 0.1 Ecut keV, τ = 0.1) negative Gaussian whose central energy was tied to the cutoff energy (see e.g. Coburn et al. 2002). In order to compare the spectra of MAXI J0903–531 in the two states, the same model was applied to the broadband data-sets. The resulting parameters of the best-fit model are presented in Table 3. The parameters of the spectral model are typical of accreting XRPs (e.g. Coburn et al. 2002; Filippova et al. 2005). The absorption value revealed by the fit is just slightly higher than the Galactic mean value in the direction to the source of 0.8 × 1022 cm−2 (Willingale et al. 2013), which is typical of Be/XRPs. The residuals in Fig. 5 also show no significant deviations, which can be interpreted for instance as a cyclotron resonant scattering feature in the spectrum.
To verify the conclusion about the absence of additional spectral features that appear only at some specific rotation phases of the NS, as observed in some XRPs (see e.g. Molkov et al. 2019, 2021), we produced the phase-resolved energy spectra of MAXI J0903–531 using the NuSTAR data in the bright state. In particular, six evenly distributed phase bins were chosen, as shown in Fig. 6. All spectra were fitted with our best-fit model, with the iron line energy and width fixed at the values obtained from the averaged spectrum. Figure 6b shows that the emission hardness is significantly variable over the pulse, mainly due to changes in photon index. We did not find any evidence for any additional emission or absorption features at any phase, however, nor for significant variations in NH value.
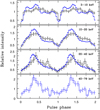 |
Fig. 3 Pulse profiles of MAXI J0903–531 obtained from NuSTAR data in different energy bands. Data for both observations are presented, in black for the low state (ObsID 90701315002), and blue for the high state (ObsID 90701320002). Zero-phase was chosen arbitrarily to match the minimum in the profile. |
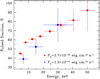 |
Fig. 4 Dependence of the pulsed fraction of MAXI J0903–531 on the energy band based on the NuSTAR data in different states of the source. |
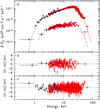 |
Fig. 5 Unfolded energy spectra of MAXI J0903–531 in different states. The luminosity varies by a factor of ~30 (panel a). The black, red, and blue points correspond to the Swift/XRT, NuSTAR, and SRG/ART-XC data, respectively. Data from two NuSTAR modules are combined for illustrative purposes only. The dashed lines represent the best-fitting models listed in Table 3. The corresponding residuals for the low- and high-luminosity states of MAXI J0903–531 are presented in panels b and c, respectively. |
Best-fitting results of the broadband spectra approximation for MAXI J0903–531 in different states obtained with NuSTAR, Swift/XRT, and SRG/ART-XC.
4 Discussion
Neutron stars (magnetars and XRPs) are considered the strongest magnets in the Universe. The only direct way to measure the strength of the magnetic field in these systems is to detect a cyclotron resonant scattering feature in the energy spectrum (see e.g. Staubert et al. 2019). As was discussed in Sect. 3.2, we did not detect any absorption features in the spectrum of MAXI J0903–531. However, the source shows a strong flux variability on different timescales. The behaviour of an XRP when it transits from a high accretion rate regime to quiescence can be used to make some conclusions about the magnetic field of the neutron star.
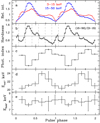 |
Fig. 6 Results of the pulse phase-resolved spectral analysis of MAXI J0903–531 using the NuSTAR data in the bright state. To illustrate the spectral variations over the pulse phase, the normalised pulse profiles in 3–15 keV and 15–50 keV bands and their ratio are shown in panels a and b, respectively. Panels c, d, and e show the behaviour of the photon index, cutoff, and folding energies, respectively. |
4.1 Magnetic field of the neutron star
It was shown theoretically (Illarionov & Sunyaev 1975) and found observationally for several XRPs (Cui 1997; Tsygankov et al. 2016b,a; Lutovinov et al. 2017) that in the case of a fast-rotating neutron star with a strong magnetic field, the so-called propeller effect is expected to stop the accretion abruptly below a certain mass accretion rate. This effect takes place when the magnetospheric and corotation radii are about equal. The corresponding luminosity can be estimated as (see e.g. Campana et al. 2002)
 (1)
(1)
where  is the mass-accretion rate, B12 is the neutron star magnetic field in units 1012 G, P is the neutron star spin period in seconds, M1.4 is the neutron star mass in units 1.4 M⊙, and R6 is the radius in 106 cm. The factor k accounts for the details of interaction of the accretion flow with the magnetosphere, relating its size to the Alfvén radius, that is, k = Rm/RA. In the case of disc accretion, it is usually assumed to be k = 0.5 (Ghosh & Lamb 1978).
Equation (1) shows that the critical luminosity Lprop is a strong function of the pulsar magnetic field and hence can be used to constrain its value. MAXI J0903–531 does not demonstrate sharp decreases in flux (see Fig. 1) and has a hard X-ray spectrum in the quiescent state (with a photon index 1.3 ± 0.3 measured from the XRT data averaged over MJD 59 405-59 423) with luminosity around 3 × 1034 erg s−1 (assuming a distance of 10 kpc and a bolometric correction factor of 2). Using this luminosity as an upper limit on the critical luminosity Lprop, we can derive an upper limit on the dipole component of the neutron star magnetic field of 2 × 10¹² G, assuming a standard mass of 1.4 M⊙ and a radius of 106 cm. A 12 km radius of the neutron star would decrease its magnetic field by about half. These estimates indicate a rather low magnetic field in MAXI J0903–531.
At the same time, the observed stability of the source in quiescence at about several ×1034 ergs−1 shows the transition of the source to the state of a quasi-stable cold-disc accretion due to the reduced disc viscosity at low mass-accretion rates, much like in dwarf novae (Tsygankov et al. 2017b). Transitions to the cold-disc state have been observed in several XRPs (e.g. Rouco Escorial et al. 2018; Nabizadeh et al. 2019; Tsygankov et al. 2019a; Doroshenko et al. 2020) at luminosities of ~1034−35 erg s−1. The luminosity corresponding to the transition to this state can be calculated by the equating the inner radius of the accretion disc when the temperature there reaches 6500 K to the magnetospheric radius of the neutron star, and it can therefore also be used to estimate its magnetic field (Tsygankov et al. 2017b). Thus, using Eq. (12) from Tsygankov et al. (2017b) and the transitional luminosity Lcold ~ 3 × 1034 erg s−1, we obtained a magnetic field of ~3 × 10¹² G, which is similar to one obtained above based on the propeller effect.
4.2 Spectral evolution
Deep NuSTAR observations of MAXI J0903–531 in two states differ by a factor of ~30 in flux. This allowed us to perform a detailed spectral analysis and to compare the spectral shape at very different mass-accretion rates. The goal of this was to verify our assumption of strong changes in the spectra in XRPs when their luminosity reaches ~1035 erg s−1 as was recently found in several X-ray pulsars (X Persei, Doroshenko et al. 2012; GX 304–1, Tsygankov et al. 2019c; A 0535+262, Tsygankov et al. 2019b; GRO J1008–57, Lutovinov et al. 2021; 2SXPS J075542.5–293353, Doroshenko et al. 2021; SRGA J124404.1–632232/SRGU J124403.8–632231, Doroshenko et al. 2022). These spectral changes manifest themselves in the transformation of the classical pulsar-like into a double-hump spectrum and were shown to be caused by the Comptonisation of cyclotron photons in the upper overheated layer of the neutron star atmosphere (Mushtukov et al. 2021; Sokolova-Lapa et al. 2021). Because in the low state of MAXI J0903–531, it was observed by NuSTAR with a luminosity of ~1035 erg s−1, similar spectral changes are expected in the source.
However, Fig. 5 and Table 3 show that the spectrum of MAXI J0903–531 does not exhibit any dramatic variations and appears to be consistent between the two NuSTAR observations. We note that the similarity of X-ray spectra in two luminosity states can be caused by the relatively low (<(2–3) × 1012 G) magnetic field strength at the surface of a neutron star. The high-energy component observed in low states of some XRPs is due to accretion flow braking and subsequent Comptonisation of seed cyclotron photons in the atmosphere of a neutron star. This component of X-ray spectra appears at about the cyclotron energy. In the case of a relatively low magnetic field, the high-energy hump of the spectrum arises at a lower energy and merges with the low-energy hump that is caused by thermal radiation of the atmosphere. Additionally, the X-ray radiation leaving the atmosphere of a neutron star experiences resonant Compton scattering by the infalling material in the accretion channel above the hot spots. Because of the Doppler effect in the accretion channel (Mushtukov et al. 2015), the resonant scattering affects X-ray photons from a wide energy range: 0.6Ecyc ≲ E ≲ Ecyc. The photons that are scattered resonantly above the stellar surface experience bulk Comptonisation (Becker & Wolff 2007) and contribute to the high-energy tail of the spectrum. As a result, the resonant bulk Comptonisation together with merged humps in X-ray spectra largely causes the observed spectral shape in XRPs at a low mass-accretion rate. Therefore we argue that an observation of a classical pulsar-like spectrum in the low-luminosity state indicates a relatively weak magnetic field of the neutron star, which in the case of MAXI J0903–531 is supported by our indirect constraints (see Sect. 4.1).
5 Conclusion
We presented results of the broadband spectral and timing analysis of emission from the recently discovered transient XRP MAXI J0903–531, obtained with the NuSTAR, Swift/XRT, and SRG/ART-XC instruments at two luminosity states that differ by a factor of ~30. The data revealed that the spectrum in both states can be described as a classical pulsar-like spectrum consisting of a power law with high-energy cutoff. The phase-averaged and resolved spectra do not contain any absorption components that might be interpreted as a cyclotron resonant scattering feature.
We argue that absence of the transition in the spectrum from a typical cutoff power-law spectrum to a two-component spectrum at low luminosity that is observed in other pulsars and is also expected in the case of MAXI J0903–531 in the low state indicates a relatively weak magnetic field of the neutron star below (2–3) × 1012 G. This value is compatible with the constraints obtained from the propeller effect and from the transition of the source to the accretion from the cold disc.
A timing analysis of the NuSTAR data revealed only slight variations in the single-peaked pulse profile of the source as a function of energy band and mass-accretion rate. In both intensity states, the pulsed fraction increases from 40% to roughly 80%. We were also able to obtain the orbital solution for the binary system using data from the Fermi/GBM, NICER, and NuSTAR instruments.
Acknowledgements
This work is based on observations with Mikhail Pavlinsky ART-XC telescope, hard X-ray instrument on board the SRG observatory. The SRG observatory was created by Roskosmos (the Lavochkin Association and its subcontractors) in the interests of the Russian Academy of Sciences represented by its Space Research Institute (IKI) in the framework of the Russian Federal Space Program, with the participation of Germany. The ART-XC team thanks the Russian Space Agency, Russian Academy of Sciences and State Corporation Rosatom for the support of the ART-XC telescope design and development. The science data are downlinked via the Deep Space Network Antennae in Bear Lakes, Ussurijsk, and Baykonur, funded by Roskosmos. We grateful to the NuSTAR and Swift teams for approving the DDT observations of MAXI J0903–531. This research has made use of data and software provided by the High Energy Astrophysics Science Archive Research Center (HEASARC), which is a service of the Astrophysics Science Division at NASA/GSFC and the High Energy Astrophysics Division of the Smithsonian Astrophysical Observatory. It also made use of data supplied by the UK Swift Science Data Centre at the University of Leicester. This work was supported by the grant 14.W03.31.0021 of the Ministry of Science and Higher Education of the Russian Federation. We also acknowledge the support from the Academy of Finland travel grants 331 951, 324550 (SST), the Väisälä Foundation (SST), the Netherlands Organization for Scientific Research Veni Fellowship (AAM).
References
- Arnaud, K. A. 1996, in ASP Conf. Ser., 101, Astronomical Data Analysis Software and Systems V, eds. G. H. Jacoby, & J. Barnes (San Francisco: ASP), 17 [NASA ADS] [Google Scholar]
- Bailer-Jones, C. A. L., Rybizki, J., Fouesneau, M., Demleitner, M., & Andrae, R. 2021, AJ, 161, 147 [Google Scholar]
- Becker, P. A., & Wolff, M. T. 2007, ApJ, 654, 435 [NASA ADS] [CrossRef] [Google Scholar]
- Boldin, P. A., Tsygankov, S. S., & Lutovinov, A. A. 2013, Astron. Lett., 39, 375 [NASA ADS] [CrossRef] [Google Scholar]
- Burrows, D. N., Hill, J. E., Nousek, J. A., et al. 2005, Space Sci. Rev., 120, 165 [Google Scholar]
- Campana, S., Stella, L., Israel, G. L., et al. 2002, ApJ, 580, 389 [NASA ADS] [CrossRef] [Google Scholar]
- Coburn, W., Heindl, W. A., Rothschild, R. E., et al. 2002, ApJ, 580, 394 [NASA ADS] [CrossRef] [Google Scholar]
- Corbet, R. H. D. 1986, MNRAS, 220, 1047 [NASA ADS] [CrossRef] [Google Scholar]
- Corbet, R. H. D., Jenke, P., Ballhausen, R., et al. 2021, ATel, 14730, 1 [NASA ADS] [Google Scholar]
- Cui, W. 1997, ApJ, 482, L163 [NASA ADS] [CrossRef] [Google Scholar]
- Doroshenko, V., Santangelo, A., Kreykenbohm, I., & Doroshenko, R. 2012, A&A, 540, L1 [NASA ADS] [CrossRef] [EDP Sciences] [Google Scholar]
- Doroshenko, V., Tsygankov, S., & Santangelo, A. 2016, A&A, 589, A72 [NASA ADS] [CrossRef] [EDP Sciences] [Google Scholar]
- Doroshenko, V., Tsygankov, S., & Santangelo, A. 2018, A&A, 613, A19 [NASA ADS] [CrossRef] [EDP Sciences] [Google Scholar]
- Doroshenko, V., Tsygankov, S., Long, J., et al. 2020, A&A, 634, A89 [NASA ADS] [CrossRef] [EDP Sciences] [Google Scholar]
- Doroshenko, V., Santangelo, A., Tsygankov, S. S., & Ji, L. 2021, A&A, 647, A165 [NASA ADS] [CrossRef] [EDP Sciences] [Google Scholar]
- Doroshenko, V., Staubert, R., Maitra, C., et al. 2022, A&A, 661, A21 (eROSITA EDR SI) [NASA ADS] [CrossRef] [EDP Sciences] [Google Scholar]
- Evans, P. A., Beardmore, A. P., Page, K. L., et al. 2009, MNRAS, 397, 1177 [Google Scholar]
- Filippova, E. V., Tsygankov, S. S., Lutovinov, A. A., & Sunyaev, R. A. 2005, Astron. Lett., 31, 729 [NASA ADS] [CrossRef] [Google Scholar]
- Gehrels, N., Chincarini, G., Giommi, P., et al. 2004, ApJ, 611, 1005 [Google Scholar]
- Gendreau, K. C., Arzoumanian, Z., & Okajima, T. 2012, in SPIE Conf. Ser., Space Telescopes and Instrumentation 2012: Ultraviolet to Gamma Ray, eds. T. Takahashi, S. S. Murray, & J.-W. A. den Herder, 8443, 844313 [NASA ADS] [Google Scholar]
- Ghosh, P., & Lamb, F. K. 1978, ApJ, 223, L83 [Google Scholar]
- Harrison, F. A., Craig, W. W., Christensen, F. E., et al. 2013, ApJ, 770, 103 [Google Scholar]
- Illarionov, A. F., & Sunyaev, R. A. 1975, A&A, 39, 185 [NASA ADS] [Google Scholar]
- Kaastra, J. S., & Bleeker, J. A. M. 2016, A&A, 587, A151 [NASA ADS] [CrossRef] [EDP Sciences] [Google Scholar]
- Kennea, J. A., Bahramian, A., Evans, P. A., et al. 2021, ATel, 14557, 1 [NASA ADS] [Google Scholar]
- Leahy, D. A. 1987, A&A, 180, 275 [NASA ADS] [Google Scholar]
- Lutovinov, A. A., & Tsygankov, S. S. 2009, Astron. Lett., 35, 433 [NASA ADS] [CrossRef] [Google Scholar]
- Lutovinov, A. A., Tsygankov, S. S., Krivonos, R. A., Molkov, S. V., & Poutanen, J. 2017, ApJ, 834, 209 [NASA ADS] [CrossRef] [Google Scholar]
- Lutovinov, A., Tsygankov, S., Molkov, S., et al. 2021, ApJ, 912, 17 [Google Scholar]
- Molkov, S., Lutovinov, A., Tsygankov, S., Mereminskiy, I., & Mushtukov, A. 2019, ApJ, 883, L11 [NASA ADS] [CrossRef] [Google Scholar]
- Molkov, S., Doroshenko, V., Lutovinov, A., et al. 2021, ApJ, 915, L27 [NASA ADS] [CrossRef] [Google Scholar]
- Monageng, I. M., Coe, M. J., Buckley, D. A. H., et al. 2021, ATel, 14564, 1 [NASA ADS] [Google Scholar]
- Mushtukov, A. A., Tsygankov, S. S., Serber, A. V., Suleimanov, V. F., & Poutanen, J. 2015, MNRAS, 454, 2714 [Google Scholar]
- Mushtukov, A. A., Suleimanov, V. F., Tsygankov, S. S., & Portegies Zwart, S. 2021, MNRAS, 503, 5193 [Google Scholar]
- Nabizadeh, A., Tsygankov, S. S., Karasev, D. I., et al. 2019, A&A, 622, A198 [NASA ADS] [CrossRef] [EDP Sciences] [Google Scholar]
- Pavlinsky, M., Tkachenko, A., Levin, V., et al. 2021, A&A, 650, A42 [EDP Sciences] [Google Scholar]
- Predehl, P., Andritschke, R., Arefiev, V., et al. 2021, A&A, 647, A1 [EDP Sciences] [Google Scholar]
- Ray, P. S., Sanna, A., Gendreau, K. C., et al. 2021, ATel, 14559, 1 [NASA ADS] [Google Scholar]
- Rivera Sandoval, L. E., Maccarone, T., & Strader, J. 2021, ATel, 14568, 1 [NASA ADS] [Google Scholar]
- Rouco Escorial, A., van den Eijnden, J., & Wijnands, R. 2018, A&A, 620, L13 [NASA ADS] [CrossRef] [EDP Sciences] [Google Scholar]
- Sokolova-Lapa, E., Gornostaev, M., Wilms, J., et al. 2021, A&A, 651, A12 [NASA ADS] [CrossRef] [EDP Sciences] [Google Scholar]
- Staubert, R., Trümper, J., Kendziorra, E., et al. 2019, A&A, 622, A61 [NASA ADS] [CrossRef] [EDP Sciences] [Google Scholar]
- Sunyaev, R., Arefiev, V., Babyshkin, V., et al. 2021, A&A, 656, A132 [NASA ADS] [CrossRef] [EDP Sciences] [Google Scholar]
- Thalhammer, P., Jaisawal, G. K., Pottschmidt, K., et al. 2021, ATel, 14604, 1 [NASA ADS] [Google Scholar]
- Townsend, L. J., Coe, M. J., Corbet, R. H. D., & Hill, A. B. 2011, MNRAS, 416, 1556 [NASA ADS] [CrossRef] [Google Scholar]
- Tsygankov, S. S., Lutovinov, A. A., Doroshenko, V., et al. 2016a, A&A, 593, A16 [NASA ADS] [CrossRef] [EDP Sciences] [Google Scholar]
- Tsygankov, S. S., Mushtukov, A. A., Suleimanov, V. F., & Poutanen, J. 2016b, MNRAS, 457, 1101 [Google Scholar]
- Tsygankov, S. S., Doroshenko, V., Lutovinov, A. A., Mushtukov, A. A., & Poutanen, J. 2017a, A&A, 605, A39 [NASA ADS] [CrossRef] [EDP Sciences] [Google Scholar]
- Tsygankov, S. S., Mushtukov, A. A., Suleimanov, V. F., et al. 2017b, A&A, 608, A17 [NASA ADS] [CrossRef] [EDP Sciences] [Google Scholar]
- Tsygankov, S. S., Doroshenko, V., Mushtukov, A. A., Lutovinov, A. A., & Poutanen, J. 2019a, A&A, 621, A134 [NASA ADS] [CrossRef] [EDP Sciences] [Google Scholar]
- Tsygankov, S. S., Doroshenko, V., Mushtukov, A. A., et al. 2019b, MNRAS, 487, L30 [NASA ADS] [CrossRef] [Google Scholar]
- Tsygankov, S. S., Rouco Escorial, A., Suleimanov, V. F., et al. 2019c, MNRAS, 483, L144 [NASA ADS] [CrossRef] [Google Scholar]
- Udalski, A. 2021, ATel, 14569, 1 [NASA ADS] [Google Scholar]
- Wachter, K., Leach, R., & Kellogg, E. 1979, ApJ, 230, 274 [NASA ADS] [CrossRef] [Google Scholar]
- Willingale, R., Starling, R. L. C., Beardmore, A. P., Tanvir, N. R., & O’Brien, P. T. 2013, MNRAS, 431, 394 [Google Scholar]
- Wilms, J., Allen, A., & McCray, R. 2000, ApJ, 542, 914 [Google Scholar]
- Yamaoka, K., Negoro, H., Serino, M., et al. 2021, ATel, 14555, 1 [NASA ADS] [Google Scholar]
All Tables
Best-fit orbital parameters assuming constant spin-up during outbursts and spin-down between the outbursts.
Best-fitting results of the broadband spectra approximation for MAXI J0903–531 in different states obtained with NuSTAR, Swift/XRT, and SRG/ART-XC.
All Figures
|
Fig. 1 Light curve of MAXI J0903–531 from the all available data (top). An observed flux is given in the 0.5–10 keV energy band for Swift/XRT (black) and NICER (grey), and in the 4–12 keV for SRG/ART-XC (blue) and NuSTAR (red). Bottom: baricentre-corrected spin period of the pulsar obtained from Fermi/GBM (open circles), NICER (grey), and NuSTAR (red). |
| In the text | |
|
Fig. 2 Spin history of the source as observed by Fermi/GBM (blue dots), NICER (black squares), and NuSTAR (red diamonds). The final model including the intrinsic spin frequency variations (red) and those due to the orbital motion (blue) together with the best-fit residuals (lower panel) are also shown. |
| In the text | |
|
Fig. 3 Pulse profiles of MAXI J0903–531 obtained from NuSTAR data in different energy bands. Data for both observations are presented, in black for the low state (ObsID 90701315002), and blue for the high state (ObsID 90701320002). Zero-phase was chosen arbitrarily to match the minimum in the profile. |
| In the text | |
|
Fig. 4 Dependence of the pulsed fraction of MAXI J0903–531 on the energy band based on the NuSTAR data in different states of the source. |
| In the text | |
|
Fig. 5 Unfolded energy spectra of MAXI J0903–531 in different states. The luminosity varies by a factor of ~30 (panel a). The black, red, and blue points correspond to the Swift/XRT, NuSTAR, and SRG/ART-XC data, respectively. Data from two NuSTAR modules are combined for illustrative purposes only. The dashed lines represent the best-fitting models listed in Table 3. The corresponding residuals for the low- and high-luminosity states of MAXI J0903–531 are presented in panels b and c, respectively. |
| In the text | |
|
Fig. 6 Results of the pulse phase-resolved spectral analysis of MAXI J0903–531 using the NuSTAR data in the bright state. To illustrate the spectral variations over the pulse phase, the normalised pulse profiles in 3–15 keV and 15–50 keV bands and their ratio are shown in panels a and b, respectively. Panels c, d, and e show the behaviour of the photon index, cutoff, and folding energies, respectively. |
| In the text | |
Current usage metrics show cumulative count of Article Views (full-text article views including HTML views, PDF and ePub downloads, according to the available data) and Abstracts Views on Vision4Press platform.
Data correspond to usage on the plateform after 2015. The current usage metrics is available 48-96 hours after online publication and is updated daily on week days.
Initial download of the metrics may take a while.