Fig. 2
Download original image
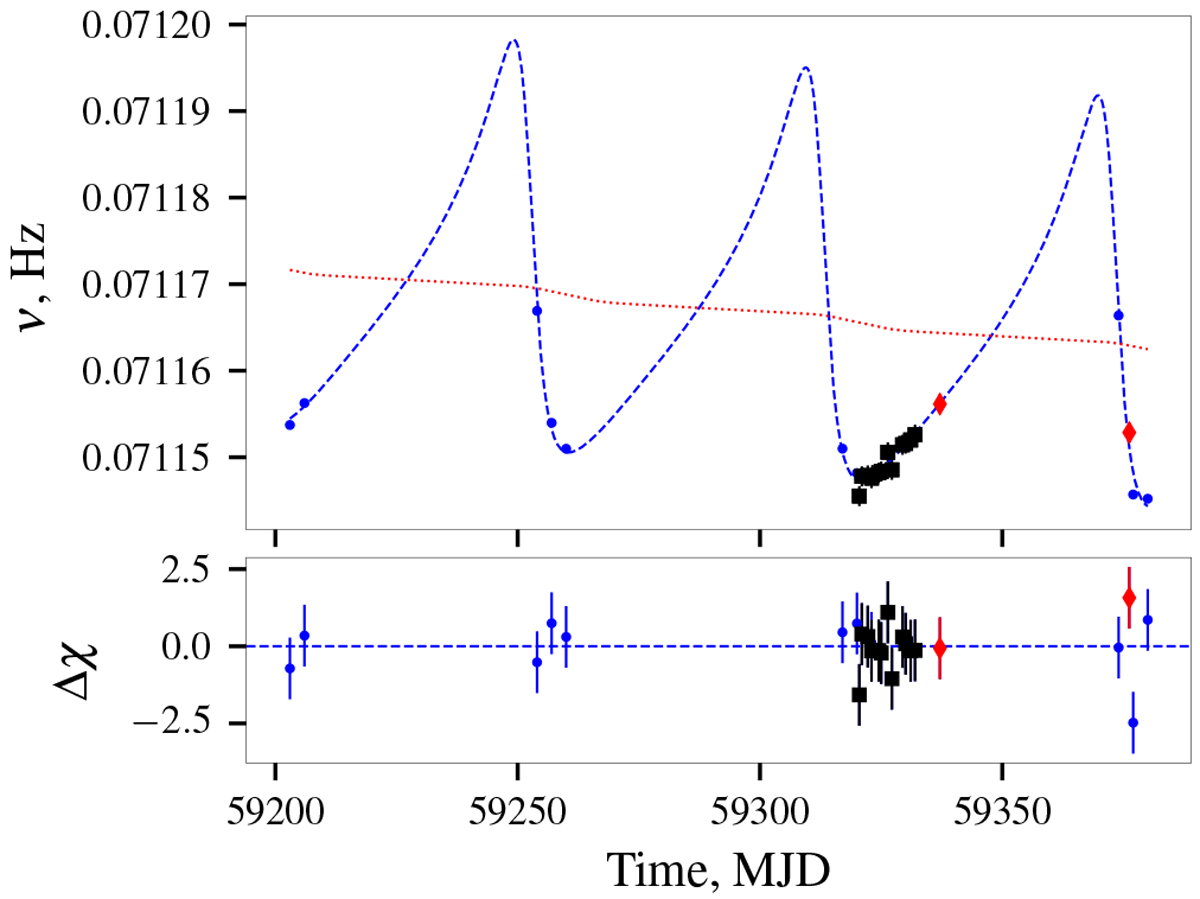
Spin history of the source as observed by Fermi/GBM (blue dots), NICER (black squares), and NuSTAR (red diamonds). The final model including the intrinsic spin frequency variations (red) and those due to the orbital motion (blue) together with the best-fit residuals (lower panel) are also shown.
Current usage metrics show cumulative count of Article Views (full-text article views including HTML views, PDF and ePub downloads, according to the available data) and Abstracts Views on Vision4Press platform.
Data correspond to usage on the plateform after 2015. The current usage metrics is available 48-96 hours after online publication and is updated daily on week days.
Initial download of the metrics may take a while.